

Date: September 20th, 2015
The recent mini-crash we had on August 24th, 2015, as forecasted in the movie Lucy on Scarlett Johansson's passport expiration date, and told here in the previous post 2 months before the event will be just a blip when compared to what is coming in 2016.
(to watch on youtube: www.youtube.com/watch?v=X0AuL9f2eE0)
While I'm not positive on whether we have already topped already this year in 2015, or if we have one more slightly higher high coming in 2016, I will say with 100% confidence that we are in for another crash next year.
This coming week we have the Evil Reptilian Pope coming to visit the White House on September 22, 2015 (http://www.popefrancisvisit.com/schedule/arrival-in-washington-d-c/)... which I can't see as anything positive. This satan worshiping snake is surely making some kind of evil deal with our gangster run government leaders. What it is, I don't know? But it's clear to me that we are nearing the ending period for this stock market as when these people meet it's never good for us sheep. I'm not saying we are going to crash right after he meets but it's coming soon thereafter... like within a few months.
Over in China we have their government banning shorting their stock market back in July of this year (http://www.theguardian.com/world/2015/jul/09/china-bans-major-shareholders-from-selling-their-stakes-for-next-six-months), which spells disaster in my mind. When you don't let traders short the market you don't have any bears to squeeze, and that means you don't have any way to rally a market up from a sell off except for tricking the sheep into buying, and that's probably not possible after you scare them with a big drop.
Next to the sheep buying you have the big institutions buying the sell off, but they aren't dumb either and won't buy it without seeing some trapped shorts to squeeze... which of course gets the market going up big time as they all have to cover at a loss. This is exactly how over here in America our government has keep they market up as high as it's at now. Without shorts in the market to squeeze you will go "no bid" and just crash... and that is precisely what's been happening in China. And I don't think it's over with yet. When America crashes next year China will go down again.
There's your clues in the news that tell you the stage is set to crash in 2016!
Looking at the technical picture we have the monthly chart now looking a lot like it did in 2000 and 2007 before it crashed the following year. The rising channel lines drawn on that chart point to about the 1820 area for the lower rising blue trendline to be support if this month of September were to go down further. So, we should expect that level to hold on a monthly close on it's first hit of that trendline.
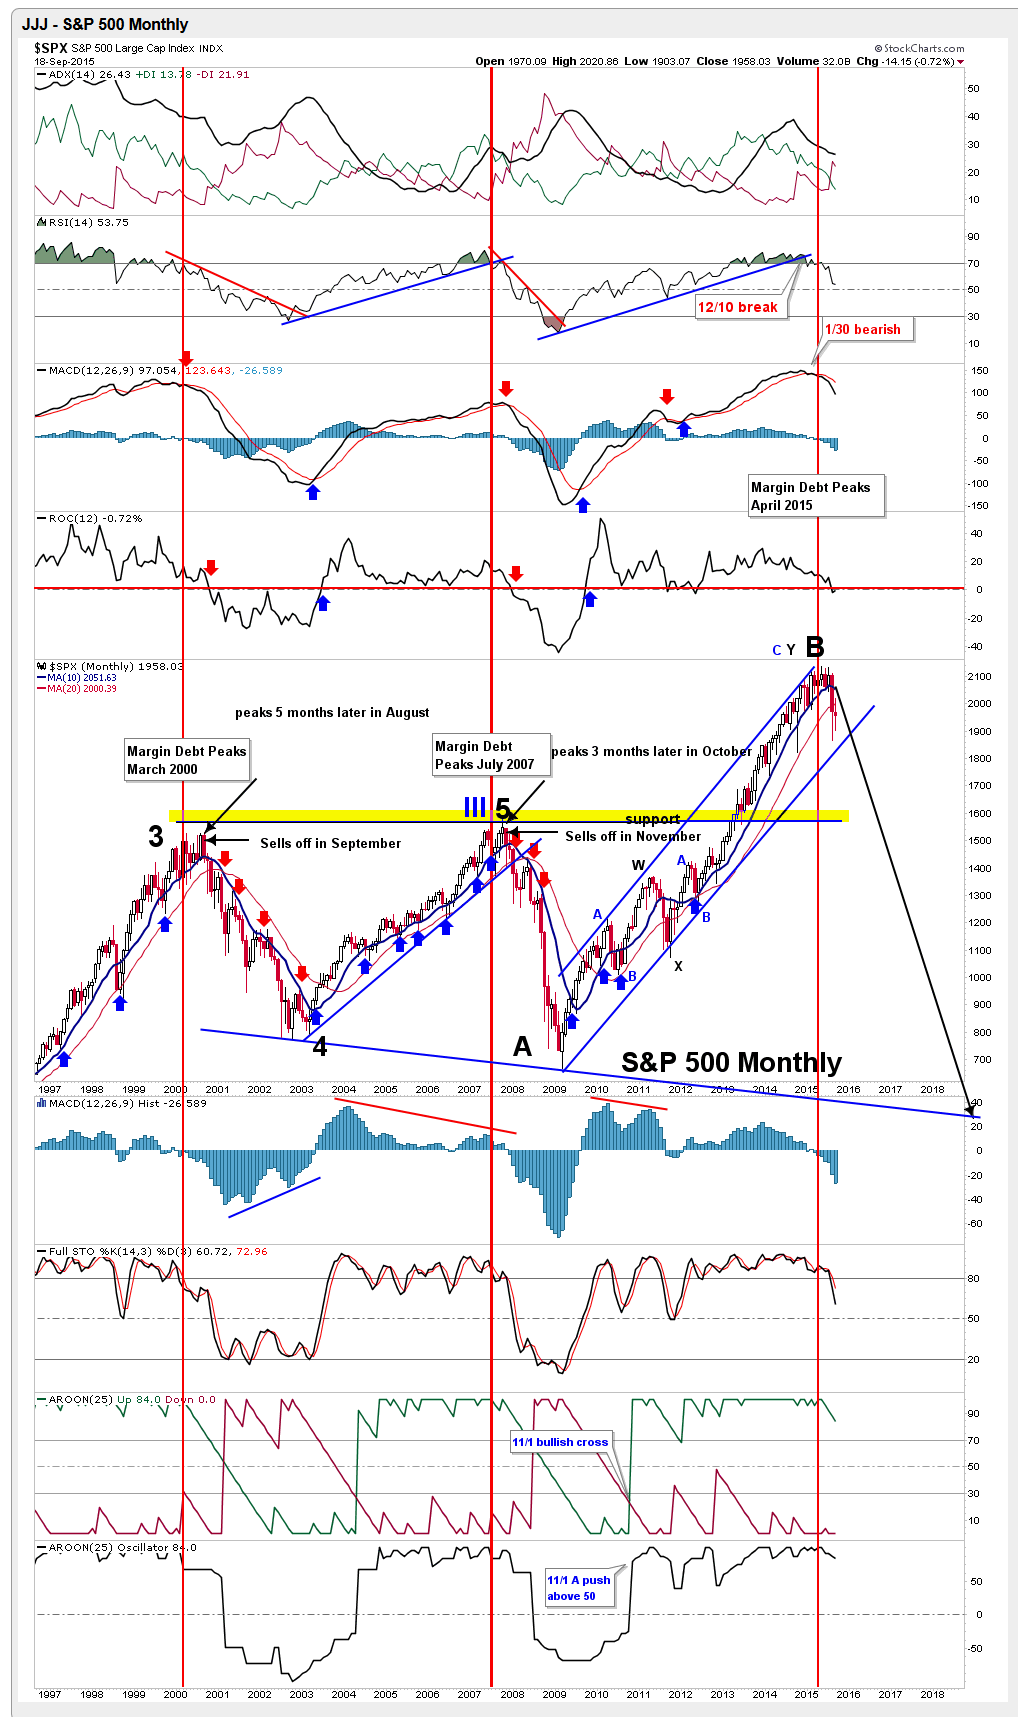
With the current down trendline being labeled Primary Wave 4 down by Tony Caldaro I'll continue to refer to it that way as well since his Elliotwave count seems to be the most accurate I've found. Not that I trade off of it on a day to day basis as I find it mostly helpful in seeing what's behind us and not too predictive for the futures due to it's many alternative wave counts.
However, on the bigger picture it's pretty good and looking forward. Basically we started Primary Wave 1 up from the 666 SPX low in March of 2009 and ended that wave in May, 2011 at 1370 SPX. Then Primary Wave 2 down happened into the 1074 low in October of 2011. Following that we had the super long Primary Wave 3 up that ended in May of 2015 at 2135 SPX. Currently we are in Primary Wave 4 down that should end around the first week of October, 2015.
Once it ends we will be starting Primary Wave 5 up, which should last 2-6 months, and may or may not make a new all time high. If it does make a new high then I'd expect it to last closer to 6 months and top out just above 2200 SPX. If it doesn't make a new high then I'd expect it to last closer to 2 months and would then be called a "truncated" Primary Wave 5... which is common and what I expect to happen.
Since I focus mostly on the technical analysis side of charting and not so much on the Elliotwave side I will say that from a TA side I don't see any new high coming and instead think we'll make a lower high on this Primary Wave 5 rally. In fact, I would not be surprised if they don't have some tricky big squeeze up for the month of October, peaking in early November for this final wave up.
That would then end the entire 5 wave series since the 2009 low and start the next cycle of waves down, that should erase 50%-80% of the entire market over the next couple of years. Should it only be 50% or so then we will likely stop and hold around the 1050-1100 SPX area where a rising trendline of support comes in at. It started at the 1974 low of 62, then the 1982 low of 101 SPX and connects to the 2009 low of 666 SPX. If that fails then we will find ourselves falling to another rising trendline from the 1929-1932 Stock Market crash low that connects to the 1942 low. That rising trendline is pointing to the low 400's on the SPX right now. Yeah, that's one scary low!
Of course we'll find support a the 2009 low of 666 first before it finally breaks and drops to the low 400's on the SPX, but that's too far out to predict right now. We only know that the evil gangsters who run the world want to create their insane New World Order where we sheep are even bigger slaves (and much poorer) then we already all. They want full control of every aspect of our lives, and crashing to the 1050-1100 SPX area doesn't seem too me to be deep enough to get the sheep into putting chips in their head or hands for the "Mark of the Beast" as foretold in the Bible.
But crashing to the low 400's on the SPX should would...
It would scare the sheep into giving up all their last freedoms to be saved from the severe poverty state that Satan's minions would put them into with a stock market wipeout like that! Naturally I don't want to see that happen, but I can't control it... I can only warn people that it is possible. It's possible from not only a charting point of view using technical analysis, but also from an "end times" model that we appear to be in right now... or at least those that rule the world think we are in.
Moving back to the short term I think we'll have a low in the market in the first week of October of this year. It should be a lower low then the recent 1867 SPX low on August 24th, but I'm not expecting something crazy like 1700 or so... like many others are forecasting due to the Shemitah September 28th date and the Blood Moon that happens too. I'm thinking in the low 1800 area for that bottom into early October.
Then we rally into mid to late October, topping out early November and dropping again the rest of that month with some bottom near the end of it and then the December Santa Claus rally starts until the first of 2016.
How low we go in November is not known yet?
Since Primary Wave 5 up should take 2-6 months I'd think we don't take out the expected Primary Wave 4 low around the low 1800's, but some massive squeeze up to 2100 SPX in October could change my mind? I'd rather see some steady 3 wave (ABC) pattern up to 2100 by the end of this year instead, because that would line up more inside the 2-6 months window for Primary Wave 5 up.
Doing the entire move in one month (October) would be very unusual and should then lead to a drop in November well below 1800 with the 1700's being the target zone. I personally don't think that will happen though, but I did want to point it out as "possible". Just visit this blog post daily to see new updated comments to stay up to date.
What would make more sense to happen is some low in the 1800 area early October or late September. Then start the A wave up for Primary Wave 5 up, that should top out mid to late October. Then down early in November for the B wave down inside Primary Wave 5 up, which should of course make a "higher low" then the start of the A wave up. Follow that by some C wave up in December to end the Primary Wave 5 up in early January, 2016 (or late December, 2015) that I think will hit 2100 area making a lower high then the Primary Wave 3 up all time high of 2135 in May of 2015.
While it's possible to make a new "higher high" for Primary Wave 5 up I just don't see it in the charts... from a technical point of view of course. The only thing that would make me believe we could see a "higher high" for Primary Wave 5 up is for the month of September to close above 2000 SPX, and I just don't think that will happen with the next 2 weeks being so bearish as seen in this chart below.

We just had the Fed's big September FOMC meeting where everyone expected them to raise interest rates and they announced that they wouldn't be doing that just yet. We sold off from that positive news, and that's not a good sign. If there was anything that should have been used to rally the market up to above 2100 by the end of September it would have been that good news.
Instead they did the announcement in the middle of September knowing very ware that the market would sell off after the news and drop lower into the end of the month. If they planned to extend this stock market higher into next year they would have made sure to give out some positive news near the end of this month to close it above it's 20 Month Moving Average... which is currently at 2000 SPX.
Here's a post done by Amateur Investor showing what happened in the past when the market makes 2 closes below the 20 Month MA.
Weekend Analysis
(9/5/15)
As I talked about last weekend there have only be "5" times since 1900 when the following conditions have been met.
1. Dow or S&P Composite dropped 10% in 5 Days or less.
2. Dow and S&P Composite were within 4 months of an "All Time High"
3. Shiller PE was 20 or above
4. The 20 Month Moving Average was tested.Prior to the most recent event these conditions were met in January of 2008, April of 2000, August of 1998 and October of 1929. This month will be pivotal for the S&P 500 depending on whether it closes a 2nd Month in a row below its 20 Month Moving Average or not.
Let's see what happened with the prior "4" events and the 20 Month Moving Average. Starting with the last event in late 2007/early 2008 there were "2" monthly closes below the 20 Month MA in January and February of 2008. In this case the S&P 500 rallied back to its 20 Month MA which was then followed by another significant drop (points A to B).
The next case was in 2000 as the S&P 500 closed below its 20 Month MA "2" months in a row in November and December. Once again notice the S&P 500 rebounded back to its 20 Month MA before selling off again (points C to D).
Meanwhile in the Fall of 1998 notice the S&P 500 failed to close below its 20 Month MA in September and October although it did briefly drop below it two months in a row (point E). This was then followed by another significant rally through the Spring of 1999 (points E to F).
Finally the last event was in the Fall of 1929 as the S&P closed below its 20 Month MA in October and November. In this case the S&P rallied back to its 20 Month MA before another sharp sell off occurred (points F to G).
Currently the 20 Month MA in the S&P 500 is at 1999 sp this value won't change much over the next three weeks. Thus this will be a key level to watch by the end of the month and may have significant implications for the market in the future depending on whether the S&P 500 closes above or below it.
(Source: http://www.amateur-investor.net/AII_Weekend_AnalysisSep_5_15.htm)
Clearly you can see that odds are very low that we'll make a higher high with Primary Wave 5 up when you have 2 monthly closes below the 20 Month MA... which I think we'll see by the end of this month.
To summarize, I'm looking for this week and next week to go down to make a lower low (then the 1867 SPX August 24th low) to complete Primary Wave 4 down. Then a rally into mid-late October for the first wave A up of Primary Wave 5... which should be somewhere in the 1950-2000 range I suspect. After that we should see a B wave down (inside Primary Wave 5 up) to lure in some more bears and scare the bulls out. This should NOT break the low of Primary Wave 4 down. Possible targets are 1850-1900 area. This should end in mid-late November. Finally we should have a C wave up (inside Primary Wave 5 up) that I suspect will reach around 2100 by the end of this year.
Red


ES Futures Monday Morning Update September 21st, 2015: http://screencast.com/t/n6LKQjmnW
VIX Monday Morning Update September 21st, 2015: http://screencast.com/t/cO42Ihk1
Too Funny: http://vigilantcitizen.com/latestnews/bill-burr-talks-illuminati-on-conan-video/
ES Futures Tuesday Morning Update September 22nd, 2015: http://screencast.com/t/EGXQLLP8o
ES Futures Midday Tuesday Update September 22nd, 2015: http://screencast.com/t/gdFpf7g7
More movies foretelling the future? https://www.youtube.com/watch?v=vgqG3ITMv1Q
ES Futures Morning Update: September 23rd, 2015: http://screencast.com/t/QXhEwpFwe
ES Futures (and SPX) Midday Wednesday Update September 23rd, 2015:http://screencast.com/t/VDjBDrDixC
By the way guys, I’m NOT suggesting a long here. This is more speculation on the move up to 1980 SPX. If wrong then we could barely move up and/or drop again tomorrow.
Again, I don’t like to play wave 2’s, 4’s, and B’s. I just look for the sure thing C wave and 3 wave. Right now we completing some wave down that could be a 2, 4 or B… nothing I want to gamble on. Elliottwave is best used “after the fact” and not for predicting the next big move.
Always use Technical Analysis first and fit the wave count into it… then you can see when a BIG move up or down is lining up. Right now I don’t see any BIG move up or down that is a “sure thing”. The only “sure thing” move was DOWN from last Thursday’s FOMC meeting. That was a 99%’er in my view. Now we are chopping around waiting for the next 90%’er plus to appear.
Right now they are desperate to save yesterdays low at 1929. So far the low has been 1932. If they can’t hold us over 1930, we will indeed be visiting 1913.
I should have said “The 200 MA” that 60 minute chart of the SPX, which is around 1980 today, but falling. So tomorrow it could be 1970-1975 SPX. That’s the actual level I’m looking to be hit. But after it’s hit (or close to being hit) I do expect the market to roll back down and continue down into Friday. So yes, I’m still bearish for this weeks’ close.
For me it’s more about the time of day, the TA setup, falling and rising trendlines, etc… and less about that actual price level. Level’s rise and fall as time passes, so calling an exact level is tough. I’ll just say that “if” we gap up tomorrow and hit one of my many trendlines (and the other TA agrees… like overbought MACD’s, Sto’s, etc…) I’d look to short it regardless of what level it’s at.
For example, I see another falling trendline the SPY right now that’s coming in around 195.50 but could be around 195 even by the open tomorrow. That’s only about 1950-1955 SPX, and if we gap up to that level and the other TA stuff shows overbought I’d short from that area.
Meaning… I’m not waiting on some hit of the 200 MA tomorrow. The TA’s will tell me to short when they line up, and I’ll short no matter what the level is at.
Is anyone reading my blog anymore? Post a comment to let me know you are alive out there people. Thanks.
copy.
I took NUGT for a quick trade. I have the feeling before end of Oct she will be trading at ~15-20.
sold for quick lunch money.
Those gold stocks are certainly going to explode once we see the stock market crash big time next year.
sure. I sold since Gold can’t exceed 1165. Will reenter again.
Every day
ES Futures Morning Update: September 24th, 2015: http://screencast.com/t/2c1cvkWCL
9/23/15 turn date was a few days late…stable through October and collapse November is how I’m reading it. Not sure they could hold it together for a month, but will see. As stated in prior posts. Long Gold, Oil and playing Fear(VIX) positions. By the way, I think the Janet’s speech last night was a significant sign we are in a “Clear and Present Danger” stage of the financial game. Unfortunately, I believe she has suffered from a nervous breakdown from the stress..BE VERY CAREFUL.
Could be? Mid-November is certainly bearish. But so is next week. So it’s hard too say right now on when we’ll retest the 1867 low.
http://screencast.com/t/wHMZ5wbjKZNX – ES Futures Morning Update September 25th, 2015
I think we are heading up toward the 197 SPY gap fill area between now and Monday.
ES Futures Late Day Update September 25th, 2015 – http://screencast.com/t/RIlpraNn
We have the whole blood moon thing Tomorrow night, but closing near the lows like yesterday usually leads to bounces. A big ripper monday would destroy bears
There are no more bulls left, an indication of a big bounce to last until wed. The S&p may see 1970
ES Futures Morning Update September 28th, 2015 – http://screencast.com/t/a0olKps1F
SPX Morning Update September 28th, 2015 – http://screencast.com/t/iDCzwkVQKx5
looking at 1970 this week.
That’s one big rally Scott. I don’t see that right now but if we double bottom first then possibly we have a big squeeze up? However, I do expect a lower low… but it might not come until the end of next week where my “turn point” is at (October 9th).
It feels like it wants to flush out today. But right now it’s in between an 1870 SPX double bottom level to go long at for a decent multi-day rally, and a small 20-30 rally up then a drop to 1870 area. Either one is possible, but flushing out first… down to the 1870 area would probably hurt the most traders, and SkyNet loves to do that you know.
From Richard Russell when the SPX was 2100 something?
Theory #1 is in play and I really think everyone should be looking down in stead of up.( You haven’t seen TRUE FEAR yet)
I have only two theories; first, the market will decline in a jagged
see-saw pattern, a pattern that creates no fear. The market drops ten
percent and analysts declare that this is the long awaited and long
expected ten percent correction.
But the general market continues to
decline, and investors remain in the market waiting for the inevitable
rally that will conclude the correction. No rally comes, and stocks
continue to decline, suddenly there is a realization that this is no
correction but a bear market, and down goes the bear, taking billion of
shares with him.
The other scenario that I envision is
one day, with no previous warning, the market drops and a huge gap, over
a thousand points in the Dow opens. The authorities close the exchange
for three days and when the market opens, it gaps down again. When the
market finally opens again, thousands of stocks open well below their
previous closes and a bear market is on.
The 3rd scenario seems to be in play… but mixed with some shake out rallies along the way. So part is the 1st scenario with the jagged see-saw pattern, but the other part is the 3rd one as I do see a big gap down crash in the future coming.
WEB BOT info.
https://www.youtube.com/watch?v=BJvYrm_EBm0
SPX Morning Update September 28th, 2015 – http://screencast.com/t/e8JGTxNmvYl
There’s a falling trendline on the SPX that’s around 1925 today and will probably be around 1920 tomorrow. That would be the first level of resistance I’d think it will pause at. Maybe that will be an A wave up? Then a B wave down to come close to retesting the lows but actually it should put in a higher low. That would setup the C wave up to squeeze out the bears shorting at the bottom of the B wave down. Just speculation there of course.
Russell 2000 was down 6.66 pts today.
Anyway, ideally I am expecting for the SP to test its 8-24 lows tomorrow and then finish mildly down then bounce hard the following day. Or it could bounce hard tomorrow….really a reflexive bounce play off the lower BB…..or it could crash into 10-2 but I think that is the least likely scenario.
My Nikkei 1990 scenario could still be in play though the current market has deviated from it somewhat. That spike off the double bottom low would see a fierce bounce to the 1960 area. But that is just one scenario.
They’re also making it look like the 2011 scenario is playing out but we should have seen one more bounce up to the 50 day average before heading to the final lows ala Oct 2011.
Then there is the South Sea Bubble scenario which would see one whopper of a rally tomorrow.
ES/SPX Morning Update September 30th, 2015 – http://screencast.com/t/tk1vee9oh
Consider how high we have rallied so far I’m only looking for a small pullback. Probably in the 1990 SPX area, or as low as 1890 SPX… but not much lower I don’t think. Either way, it’s likely a B wave down with the gap up being the A wave up. So we should see the C wave up into later today and tomorrow.
ES Morning Update October 1st, 2015 – http://screencast.com/t/K3ap68ts1YXn
ES Midday Update October 1st, 2015 – http://screencast.com/t/ZV6G9Wym
Ok… from the looks of the charts right now we need the Non-Farm Payroll report (released tomorrow morning before the open at 8:30 am EST) to be view positive and cause a squeeze up to above the high this morning on the ES Futures, which was 1930.
Since this event is about the only “market mover” news (nothing the rest of Friday to move it much), it must take out 1930 to force a rally from bears shorting today. Failure to do so mean the top of the rally was the 1930 level and there’s not likely going to be any move higher to 1940-1950 anytime soon.
There is another falling trendline around 1925 ES right now, that will probably be around 1920 tomorrow morning. If it breaks that with the NFP report news then possibly the rally continues. If it doesn’t break it then again, the top of this rally was likely in today at the 1930 ES high (1927 SPX).
I’m NOT looking for any longs as the upside is limited in my opinion. I’m only looking for the right shorting spot, which could be at the open tomorrow if we don’t breakthrough the falling trendline of resistance (again, about 1925 now and should be 1920 tomorrow).
So we look to short tomorrow’s open if they can’t get a bear squeeze going and take out today’s premarket ES Futures high of 1930 (which should then push up to 1940-1950). If they get the squeeze then we look for that higher level to short. I’d just say that we are 90-95% done with the rally up and should be looking for short entries into a low that I think we’ll see next Thursday or Friday.
ES Morning Update October 2nd, 2015 – http://screencast.com/t/hdiJzs18NE
SPX End of Day Update October 2nd, 2015 -http://screencast.com/t/ggAjK2g0Hk
ES Morning Update (with SPY target) October 5th, 2015 – http://screencast.com/t/7U6eitk9eK
SPY FP: http://screencast.com/t/y3QJCikqJ
This sell off has been tracking the 2011 correction very closely. Back then around this same period the market made it’s final drop to make a lower low of 1074 SPX before the 4 year rally. This time around I don’t think they will repeat it. I think we are going down into this Thursday/Friday to make a higher low (1890-1920?) and then start one more powerful rally up into mid-November before topping again.
SPX Update http://screencast.com/t/r8OxN6umzNB
ES Morning Update October 6th, 2015 – http://screencast.com/t/SsAR8fyDa
SPX End Of Day Update: http://screencast.com/t/aYYC4HbJQ
ES Morning Update October 7th, 2015 – http://screencast.com/t/cxK97uH0l
Quick 5 minute video on the ES Futures: http://screencast.com/t/xRF57kP67
ES Morning Update October 8th, 2015 – http://screencast.com/t/gWwwniuQr
wow, no downside today. Will we see a drop tomorrow?
I think we top tomorrow. Not sure if it’s a gap up and drop, or a gap down, retrace, and then down into the close… but odds favor tomorrow ending this first large wave up.
Congrats on the Cubs. It looks like they are going to fulfill the Back to the Future 2 prophecy of the Cubs playing in the 2015 World Series.
The Pope visited Philly a couple of weeks ago after giving his speech to the UN to exorcise the Curse of Tebow from the Silver Lining Playbook Eagles who have been floundering under the 1987 born new QB #7. It managed to produce a win the following day for those Eagles but they resorted to their losing ways last week.
Interestingly, I saw the then pope back in September 1987, the last time he visited my neck of the woods.
Tomorrow is 10-9 or 26 Tishrei or something close to that number which generally isn’t a good day for the stock market during swoons but it looks it has a date with destiny with another historical date. But tomorrow the Sun is doing a Tsquare with Pluto and Sirius and then a square with Uranus on Monday.
SP is retesting the Sept Fed high and might make a divergent high tomorrow ala lower RSI on the 60 min and smaller time frames. The Dow has already exceeded that high and formed a classic Bwave topping pattern although we could see some dojis or shooting stars tomorrow.
It looks like, as expected, that Carl Icahn’s uber bearish video presentation last week, was just a setup for nice short squeeze launch.
Same old song and dance… trick the sheep into shorting when they should be going long.
ES Morning Update October 9th, 2015 -http://screencast.com/t/xjB81P91jTR
VIX Morning Update October 9th, 2015 – http://screencast.com/t/u036BOMi
ES Morning Update October 12th, 2015 – http://screencast.com/t/IL00jpxn
I’d love to see the VIX fill the gap from August 19th at 15.25, and then I’m a big bear again.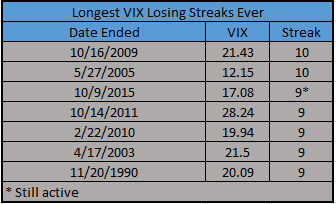
ES Morning Update October 13th, 2015 – http://screencast.com/t/zJEjjh5HkxiH
ES Morning Update October 14th, 2015 – http://screencast.com/t/LS12O8IBN
SPX Midday Update October 14th, 2015 – http://screencast.com/t/5Ko42cWGk
SPX Morning Update October 15th, 2015 – http://screencast.com/t/zYPt2t0jdXR
Hi Leo, back to trading…and more market studying.
CFTC report last Friday showing Commercials medium on The LONG side on S&P, DOW, slightly SHORT on NASDAQ & VIX.
Another info site you may want to add to watch http://www.armstrongeconomics.com/armstrong_economics_blog
Seems to have good input on cycle factors.
Good to be back trading!
$Doug Out!
Hey Doug… slow market right now. But I’ll look at that link when I can. Thanks
high on my Swing trade hit list:
ACI BTU CLNE RIG
small cap hit list:
ICLD ABEO
past along you come across!
SPX Midday Update October 15th, 2015 – http://screencast.com/t/IMnm66jfmI
Gold resistance levels http://niftychartsandpatterns.blogspot.in/2015/10/gold-resistance-levels.html
Hey San… how you doing old friend?
safe and well here. visiting RED after a long GAP.
Red, remember we still have this fake print on VXX to contend with…. I believe soon. Also take a look at the SKEW index….Highest as of yesterday for the year, Another Black Monday is around the corner.
Thanks… it’s coming, but I don’t see it this month, or this year.
Skew
Here’s one better….The weekly chart for Skew Index.
ES Futures Update October 16th, 2015 – http://screencast.com/t/wzWFoE3DkH
Cubs made it to the next step in their quest to appear in the 2015 World Series as foretold in Back to the Future 2 as they beat the 100 win STL Cards in the first round of the NL Playoffs.
October 21st, 2015 isn’t too far away now, and that’s the date they traveled to in the 2nd Back to the Future movie.
Great post.
this guy is rediculosuly accurate with his market calls, and said to watch the high yeild charts at the moment => http://www.bit.ly/1jLMmPk
What we do have to remember is that every time those margin call charts keep getting posted on zerohedge, as in the SHORT INTEREST ones, we rally really hard two weeks later.
Janet yellen, is smelling and reaking of 3 day old booze people. So the games will continue. When QE4 and QE5 comes, then what will people say?? That will be funny.
Thanks Jesterx… informative article for sure.
Bradley turn 17th, lets see a downturn tomorrow…
I’m looking for a pullback early this week… not sure how much though? When’s then next Bradley turn date?
nov. 10th
Perfect… Legatus meeting the 6th-9th too. Should be an important top around there.
or bottom of c wave
Doubt it… I think we’ll pullback small this week and then grind up more into that date area. The weekly chart is still too buried to have a bottom around that date. Should be a top.
ES Futures Morning Update October 19th, 2015 – http://screencast.com/t/nI8mXRzMz
SPX Morning Update October 20th, 2015 – http://screencast.com/t/voyhvpJLhlt