
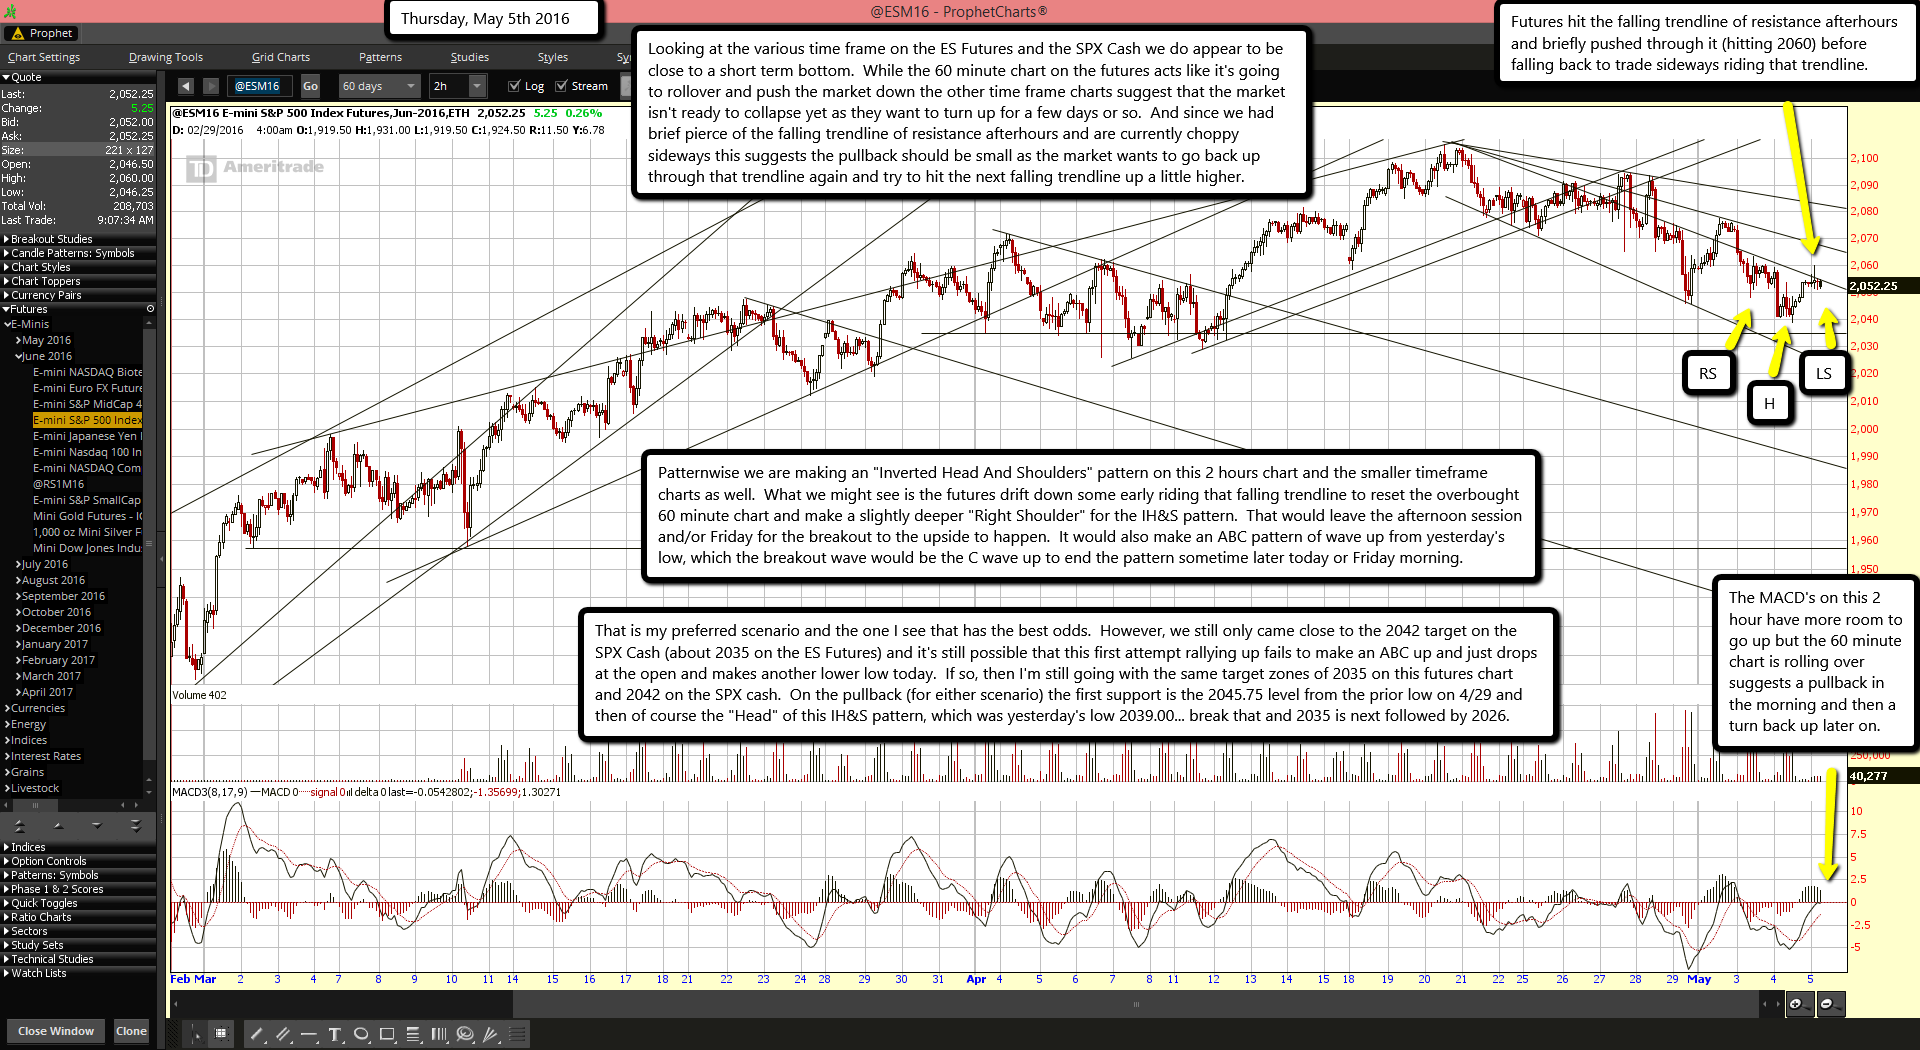
Futures hit the falling trendline of resistance afterhours and briefly pushed through it (hitting 2060) before falling back to trade sideways riding that trendline.
The MACD's on this 2 hour have more room to go up but the 60 minute chart is rolling over suggests a pullback in the morning and then a turn back up later on.
Looking at the various time frame on the ES Futures and the SPX Cash we do appear to be close to a short term bottom. While the 60 minute chart on the futures acts like it's going to rollover and push the market down the other time frame charts suggest that the market isn't ready to collapse yet as they want to turn up for a few days or so. And since we had brief pierce of the falling trendline of resistance afterhours and are currently choppy sideways this suggests the pullback should be small as the market wants to go back up through that trendline again and try to hit the next falling trendline up a little higher.
Patternwise we are making an "Inverted Head And Shoulders" pattern on this 2 hours chart and the smaller timeframe charts as well. What we might see is the futures drift down some early riding that falling trendline to reset the overbought 60 minute chart and make a slightly deeper "Right Shoulder" for the IH&S pattern. That would leave the afternoon session and/or Friday for the breakout to the upside to happen. It would also make an ABC pattern of wave up from yesterday's low, which the breakout wave would be the C wave up to end the pattern sometime later today or Friday morning.
That is my preferred scenario and the one I see that has the best odds. However, we still only came close to the 2042 target on the SPX Cash (about 2035 on the ES Futures) and it's still possible that this first attempt rallying up fails to make an ABC up and just drops at the open and makes another lower low today. If so, then I'm still going with the same target zones of 2035 on this futures chart and 2042 on the SPX cash. On the pullback (for either scenario) the first support is the 2045.75 level from the prior low on 4/29 and then of course the "Head" of this IH&S pattern, which was yesterday's low 2039.00... break that and 2035 is next followed by 2026.

