
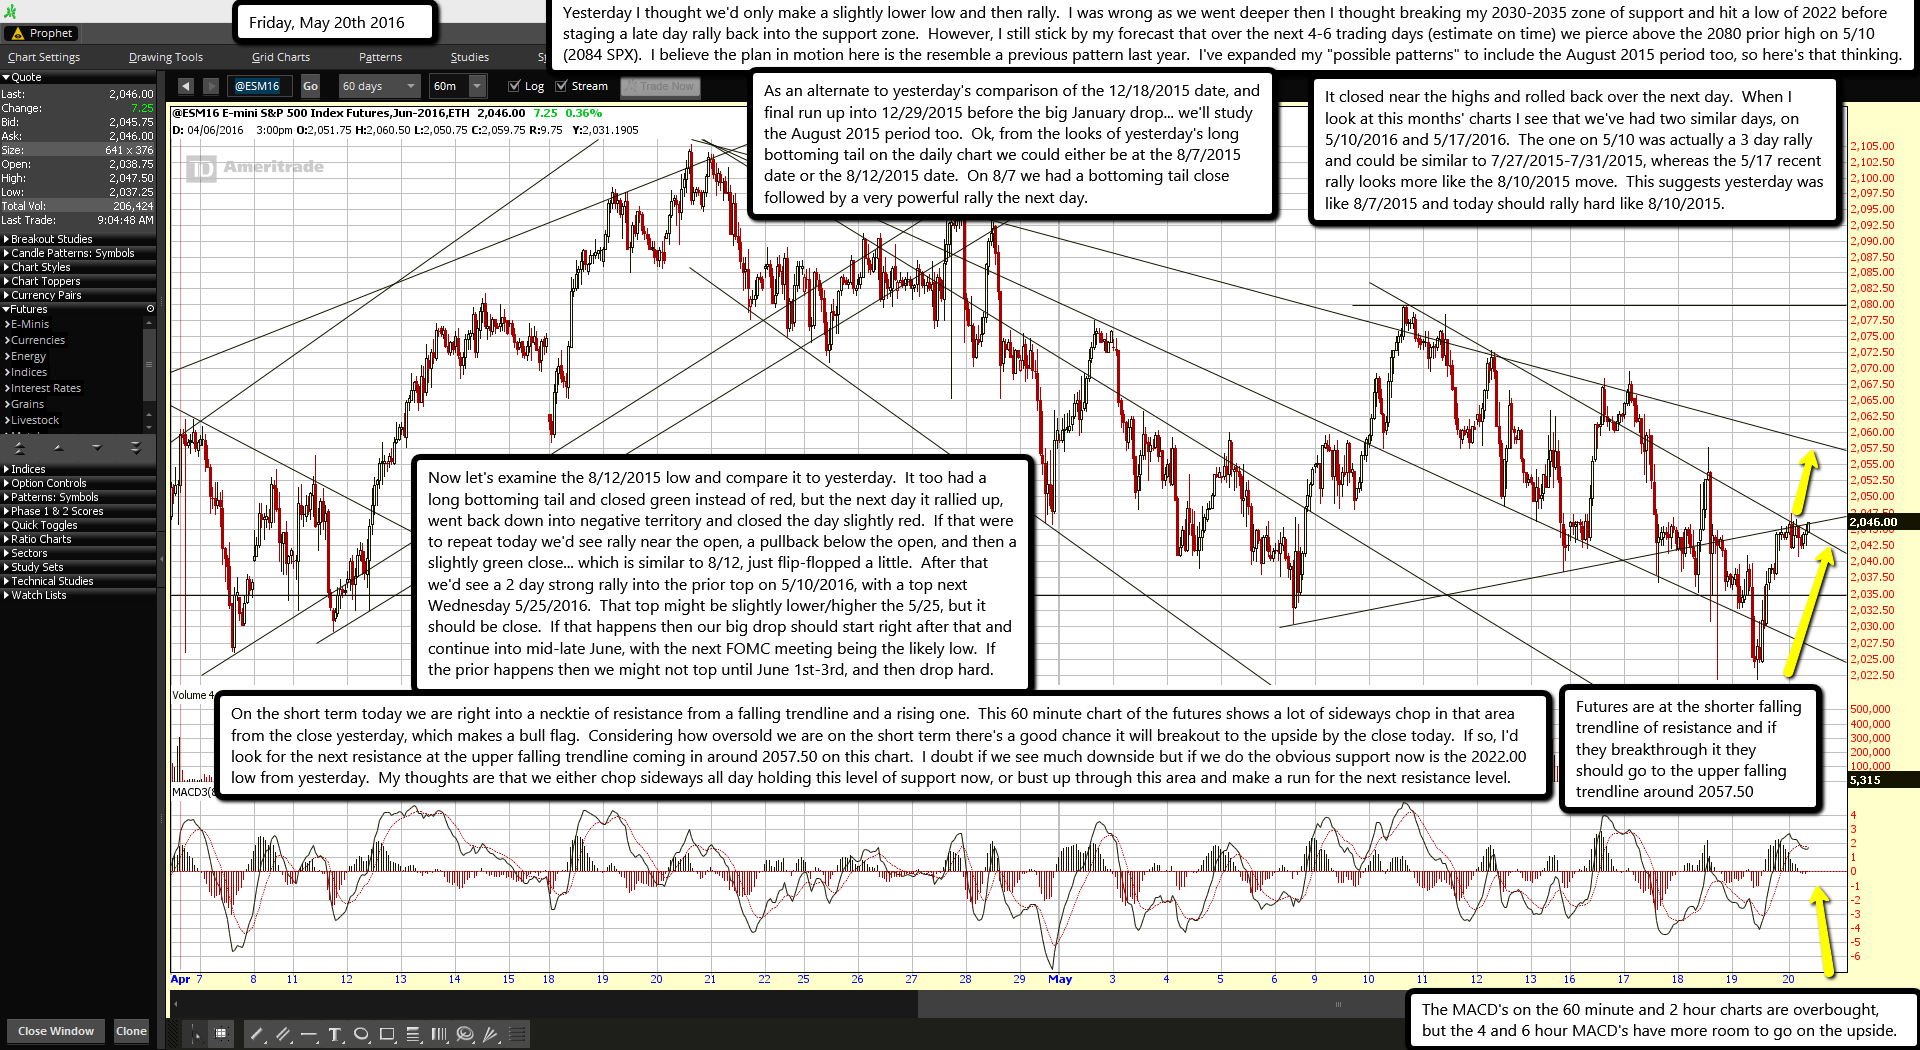
Futures are at the shorter falling trendline of resistance and if they breakthrough it they should go to the upper falling trendline around 2057.50
The MACD's on the 60 minute and 2 hour charts are overbought, but the 4 and 6 hour MACD's have more room to go on the upside.
Yesterday I thought we'd only make a slightly lower low and then rally. I was wrong as we went deeper then I thought breaking my 2030-2035 zone of support and hit a low of 2022 before staging a late day rally back into the support zone. However, I still stick by my forecast that over the next 4-6 trading days (estimate on time) we pierce above the 2080 prior high on 5/10 (2084 SPX). I believe the plan in motion here is the resemble a previous pattern last year. I've expanded my "possible patterns" to include the August 2015 period too, so here's that thinking.
As an alternate to yesterday's comparison of the 12/18/2015 date, and final run up into 12/29/2015 before the big January drop... we'll study the August 2015 period too. Ok, from the looks of yesterday's long bottoming tail on the daily chart we could either be at the 8/7/2015 date or the 8/12/2015 date. On 8/7 we had a bottoming tail close followed by a very powerful rally the next day. It closed near the highs and rolled back over the next day. When I look at this months' charts I see that we've had two similar days, on 5/10/2016 and 5/17/2016. The one on 5/10 was actually a 3 day rally and could be similar to 7/27/2015-7/31/2015, whereas the 5/17 recent rally looks more like the 8/10/2015 move. This suggests yesterday was like 8/7/2015 and today should rally hard like 8/10/2015.
Now let's examine the 8/12/2015 low and compare it to yesterday. It too had a long bottoming tail and closed green instead of red, but the next day it rallied up, went back down into negative territory and closed the day slightly red. If that were to repeat today we'd see rally near the open, a pullback below the open, and then a slightly green close... which is similar to 8/12, just flip-flopped a little. After that we'd see a 2 day strong rally into the prior top on 5/10/2016, with a top next Wednesday 5/25/2016. That top might be slightly lower/higher the 5/25, but it should be close. If that happens then our big drop should start right after that and continue into mid-late June, with the next FOMC meeting being the likely low. If the prior happens then we might not top until June 1st-3rd, and then drop hard.
On the short term today we are right into a necktie of resistance from a falling trendline and a rising one. This 60 minute chart of the futures shows a lot of sideways chop in that area from the close yesterday, which makes a bull flag. Considering how oversold we are on the short term there's a good chance it will breakout to the upside by the close today. If so, I'd look for the next resistance at the upper falling trendline coming in around 2057.50 on this chart. I doubt if we see much downside but if we do the obvious support now is the 2022.00 low from yesterday. My thoughts are that we either chop sideways all day holding this level of support now, or bust up through this area and make a run for the next resistance level.

