
Everything looks bullish still short term. The MACD's on the daily chart of the SPX are curling up nicely adding support for yesterdays move up to continue. But the 60 minute chart, 2 hour chart and even the 6 hour chart have exhausted half of their energy as they've come up from oversold to about neutral right now. Some are in positive territory now on their MACD's, so I don't see too many more days of up without another pullback to reset overbought short term charts. Possibly today they pullback on the 60 minute chart to reset it but the 6 hour chart tells me we just a few more days of up left.
So if the bulls want to make this a longer lasting rally they should pullback today and Monday to reset the charts. If not, and instead they decide to continue the grind up, they will be overbought by the middle of next week or sooner. But for today they have the ball in their court and can run with it if they choose. I will add this, there's a new FP on the SPY at 8:23 pm from last night that shows a high of 275.66, which could be a signal for where they plan to take the market to today or into Monday.
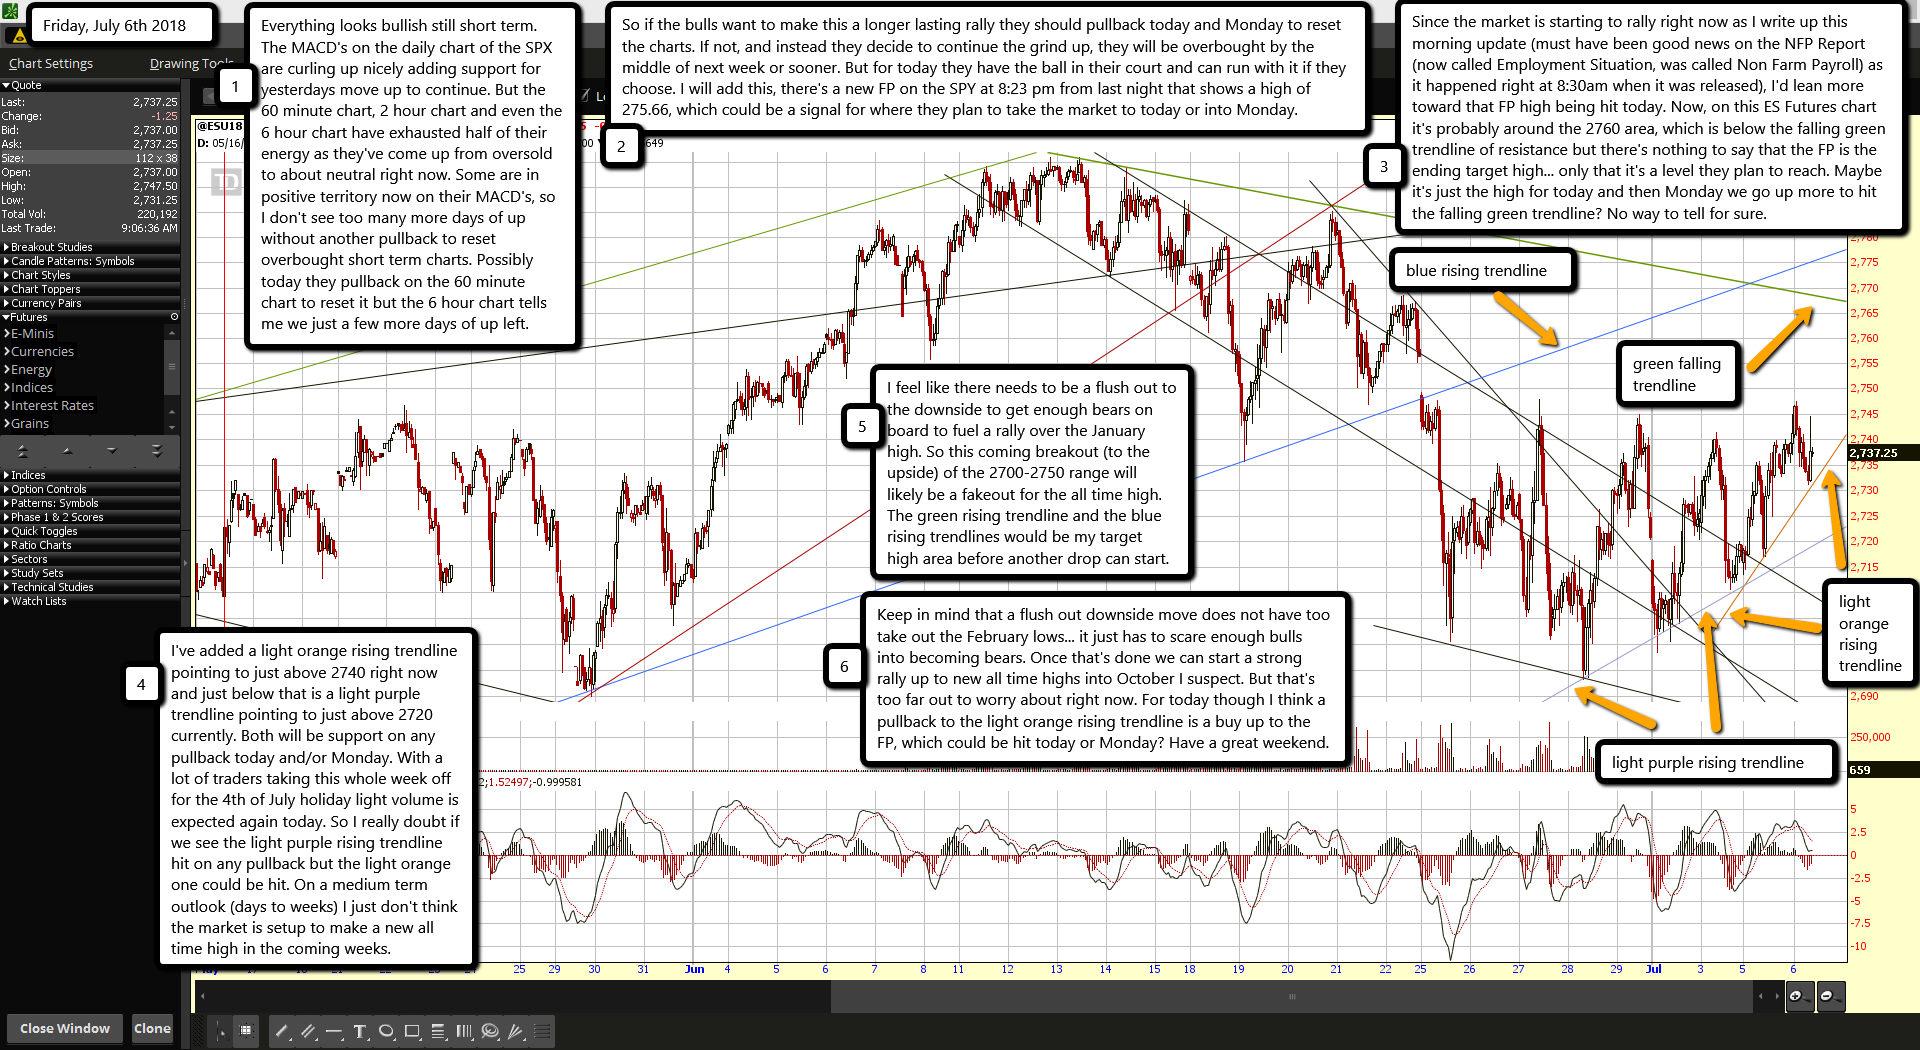
Since the market is starting to rally right now as I write up this morning update (must have been good news on the NFP Report (now called Employment Situation, was called Non Farm Payroll) as it happened right at 8:30am when it was released), I'd lean more toward that FP high being hit today. Now, on this ES Futures chart it's probably around the 2760 area, which is below the falling green trendline of resistance but there's nothing to say that the FP is the ending target high... only that it's a level they plan to reach. Maybe it's just the high for today and then Monday we go up more to hit the falling green trendline? No way to tell for sure.
I've added a light orange rising trendline pointing to just above 2740 right now and just below that is a light purple trendline pointing to just above 2720 currently. Both will be support on any pullback today and/or Monday. With a lot of traders taking this whole week off for the 4th of July holiday light volume is expected again today. So I really doubt if we see the light purple rising trendline hit on any pullback but the light orange one could be hit. On a medium term outlook (days to weeks) I just don't think the market is setup to make a new all time high in the coming weeks.
I feel like there needs to be a flush out to the downside to get enough bears on board to fuel a rally over the January high. So this coming breakout (to the upside) of the 2700-2750 range will likely be a fakeout for the all time high. The green rising trendline and the blue rising trendlines would be my target high area before another drop can start.
Keep in mind that a flush out downside move does not have too take out the February lows... it just has to scare enough bulls into becoming bears. Once that's done we can start a strong rally up to new all time highs into October I suspect. But that's too far out to worry about right now. For today though I think a pullback to the light orange rising trendline is a buy up to the FP, which could be hit today or Monday? Have a great weekend.

