Wall Street and most buy-side analysts expected regional banks to benefit from higher interest rates as soon as the Federal Reserve began to raise interest rates. The Fed raised the federal funds rate on Dec. 16 but regional bank stocks did not rally; instead, they declined into correction territory more than 10% below multiyear or all-time highs set in July 2015.
From a technical standpoint, higher interest rates have not been positive for regional banks, based on data from the Federal Deposit Insurance Corporation and comments from the FDIC Chairman, Martin Gruenberg. That's why I said it was time to take profits on regional banks. This was based on continued FDIC concerns about credit risks as banks extend out the yield curve to pick up net interest margins.
Here's a scorecard for the five key regional banks.
Let's focus is on the daily charts as these stocks cascade below their Fibonacci retracements from their all-time or multiyear highs set in July to their "flash crash" lows of Aug. 24 or lower later in 2015.
The daily chart for BB&T shows the stock ended 2015 below its 50% Fibonacci retracement of $38.07. The horizontal lines are the retracements from the multiyear high of $41.90 set on July 23 to the 2015 low of $34.24 set on Oct. 2.
As 2016 began the stock plunged below its 38.2% retracement of $37.17. Then, on Jan. 7, the stock gapped below its 23.6% retracement of $36.05. The stock closed Tuesday at $34.90 in correction territory 16.7% below the July 23 high. The stock is just 1.9% above the low set on Oct. 2.
Note in a "sell on strength" strategy investors could have reduced holdings at its 61.8% retracement of $38.98 between Nov. 6 and Dec. 7.
Investors looking to buy BB&T should place a good till canceled limit order to buy the stock if it drops to $32.71, which is a key level on technical charts until the end of 2016.
BB&T is scheduled to report quarterly earnings before the opening bell on Jan. 21 and analysts expect the bank to earn 70 cents a share.
Here's the daily chart for M&T Bank Corp.
Courtesy of MetaStock Xenith
The daily chart for M&T shows the stock ended 2015 below its 50% Fibonacci retracement of $122.74. The horizontal lines are the retracements from the multiyear high of $134 set on July 23 to the 2015 low of $111.50 set on Oct. 2.
As 2016 began the stock plunged below its 38.2% retracement of $120.08. Then, on Jan. 6, the stock crashed below its 23.6% retracement of $116.79. The stock closed Tuesday at $110.49 in correction territory 19.2% below the July 23 high. The stock set a lower low of $108.32 on Jan. 11.
In a sell on strength strategy investors could have reduced holdings at its 61.8% retracement of $125.40 between Oct. 28 and Dec. 17.
Investors looking to buy M&T should place a good till canceled limit order to buy the stock if it drops to $95.68, which is the April 2013 low.
M&T is scheduled to report quarterly earnings on Jan. 19 and analysts expect the bank to earn $1.95 a share.
The prospect of four straight quarters of earnings declines is staring investors in the face on top of the worst multiweek selloff for stocks in years, and the worst start of the year ever.
For the year, the Dow Jones Industrial Average DJIA, -2.39% and the S&P 500 index SPX, -2.16% are down at least 8%, and the Nasdaq Composite Index COMP, -2.74% shed more than 10%.
Stocks also rang up a third week of losses for their largest multiweek percentage drop since the four weeks ended Aug. 19, 2011, according to FactSet data. Over the past three weeks, both the S&P 500 and the Dow industrials have declined 8.9%, and the Nasdaq has fallen 11.1%. For the four weeks ended Aug. 19, 2011, the S&P 500 has fallen 16.5%, the Dow is down 14.7%, and the Nasdaq dropped 18.1%.
Those hefty losses come as earnings season ramps up during the holiday-shortened week. Several companies on the S&P 500, along with seven Dow components, report quarterly results. And earnings season isn’t looking promising.
Total earnings for the S&P 500 in the fourth quarter are expected to decline from the previous year, even factoring that Wall Street forecasts’ have been lowered.
Over the past four years, estimates for S&P 500 earnings at the end of a given quarter have been an average three percentage points lower than the actual earnings results, according to John Butters, senior earnings analyst at FactSet.
Earnings were estimated to decline by 4.9% at the end of the fourth quarter, that would translate to a 1.9% decline if the average holds up. Currently, earnings are on pace for 5.7% drop.
Plus, current-quarter earnings estimates have taken a notable downturn in the past week.
First-quarter earnings for the S&P 500 are expected to decline from the year-ago period by 0.6%, compared with estimated growth of 0.9% at the beginning of the quarter, according to FactSet data.
Among Dow components: UnitedHealth Group Inc.UNH, -1.35% and International Business Machines Corp.IBM, -2.17% report Tuesday; Goldman Sachs Group Inc.GS, -3.58% reports Wednesday; Verizon Communications Inc.VZ, -0.98%American Express Co.AXP, -0.60% and Travelers Cos.TRV, -1.76% report Thursday; and General Electric Co.GE, -1.96% reports Friday.
Tenable Network Security, a Columbia-based cybersecurity firm co-founded by Ron Gula (pictured), raised $250 million in venture capital last year. (Tim Teeling/Courtesy of Tenable Network Security)
Washington-area businesses raised more venture capital in the fourth quarter than they had in any quarter since 2001 — largely due to a few large deals.
The surge is not likely to be repeated soon given the recent stock market turmoil. Indeed, venture funding nationally declined during the period.
In all, though, 29 area companies received $556.22 million in venture capital last quarter, a 53 percent increase from a year earlier, according to a report released Friday by PricewaterhouseCoopers and the National Venture Capital Association, with data by Thomson Reuters.
For the full year, the region’s companies secured 169 deals totaling $1.41 billion, up from 197 deals totaling $1.09 billion in 2014. On average, the region’s firms received $8.4 million in venture capital in 2015, up from $5.5 million a year earlier.
“The average deal size was up, and it was up significantly,” said Brad Phillips, a director at PwC.
The flow of deals is likely to slow this year. Nationally, U.S. companies raised $11.34 billion in venture capital during the fourth quarter, a 28 percent decrease from the year before, as a wobbly stock market gave investors pause.
During the fourth quarter, “it appears the volatility in the financial markets affected [venture capital] funding,” Phillips said. “Equity market declines were broad-based.”
In Washington, however, fourth-quarter funding remained robust.
Tenable Network Security, a Columbia, Md.-based cybersecurity firm, led the way with a nearly $250 million investment from Accel Partners and Insight Venture Partners. It was the region’s second-largest deal in the report’s 20-year history. (The largest was for XM Satellite Radio Holdings in 1999 for $250 million, $100 more than the Tenable deal.)
“It’s a record-setting deal,” said Ron Gula, chief executive of Tenable. “Not only is this good for our company, it’s generally a really, really good message for the industry and our approach to doing cybersecurity.”
Tenable has plans to open six international offices this year, including in Ireland and the United Arab Emirates, Gula said. The company hired roughly 200 new employees last year, and plans to add even more workers in 2016.
“An investment of this size allows us to accelerate even faster,” he said.
Throughout the region, software and biotechnology companies continued to receive the largest share of venture capital, or about 84 percent of total dollars awarded during the fourth quarter.
The recipients of the largest deals included Precision for Medicine, a Bethesda, Md.-based biotechnology firm (which received $75 million); IronNet Cybersecurity, a Fulton, Md.-based software company ($25 million); and ZeroFox, a Baltimore software company ($22.04 million).
“It’s a pretty good quarter when the two traditionally strong industries went up and we still saw other industries land funding as well,” Phillips said.
Businesses in Maryland received 81.3 percent of fourth-quarter funding in the Washington area, which the report defines as Maryland, Virginia, West Virginia and the District.
Abha Bhattarai is a business reporter for The Washington Post. She has previously written for The New York Times, The Wall Street Journal, Reuters and the St. Petersburg Times.
This story has been amended to add Elevate Credit’s statement in its prospectus that it seeks to comply with applicable laws and regulations. Also, the story now states that the company appears to do less than traditional lenders to ensure consumers can pay off their loans. Earlier, the story stated the company does little to ensure this.
Elevate
Elevate filed to go public with a price range of $20 to $22. Final pricing is expected Jan. 21.
As the payday loan industry faces a crackdown in the United States, an online service that also offers small loans with high interest rates to people with poor credit is preparing to take Wall Street’s biggest stage, even though it admits that its practices could lead to its own doom.
is set to be the first venture-backed initial public offering of 2016, with plans to sell shares this month in a deal that could bring in almost $80 million. The online lender uses its own proprietary technology to offer “approval in seconds” to consumers for two installment loan products and one line of credit.
But those automated approvals and the high interest rates that follow come with a slew of regulatory issues and questionable tactics. Despite the focus on its technology, Elevate appears to be nothing more than an online version of an industry that preys on the poor with loans they can’t obtain from banks, at interest rates banks could never charge.
“I think they’re the new face of payday lending,” said Lauren Saunders, associate director at the National Consumer Law Center.
Elevate — which declined to comment for this article, citing its pre-IPO “quiet period” — takes pains to separate itself from the controversial, and potentially illegal, payday lenders. The company says those lenders have an average annual percentage return of close to 400% and typically require one large payment due at the end of the loan term, while Elevate mandates customers pay off their loans throughout the loan period.
Saunders said Elevate is just expanding the loan length and definition of payday lenders, and the rates Elevate charges its customers are much higher than other types of loans. The average weighted annual percentage rate for its three products are 176% for Rise, 255% for United Kingdom-focused Sunny, and 88% for Elastic, the line of credit.
And while Elevate calls its customers the “New Middle Class,” it appears to do less than traditional lenders to ensure that consumers can afford to pay off the loans they receive, a similar issue to what the Consumer Financial Protection Bureau is investigating with payday lenders. Elevate automates more than 90% of its loan applications, with humans reviewing the other 10%.
Elevate doesn’t detail the exact metrics it uses to assess consumers, but says it uses data from the National Consumer Reporting Association for “prime-ish” customers and data from Clarity and Teletrak, non-prime credit bureaus for the second tier. For those with no credit history, Elevate uses data including how long the consumer has used the same phone number or email address.
The company says using more documentation to evaluate creditworthiness would just slow them down.
“If Elevate products were required to receive and review additional documentation from consumers such as bank statements, photo identification or pay stubs, this added inconvenience may result in lower consumer applications and loans, which would adversely affect our growth,” the company says in its prospectus.
The company also stated in its filing, “Where applicable, we seek to comply with” laws and regulations.
Beyond establishing creditworthiness, Elevate and its affiliates are subject to several federal and state regulations, including the Truth in Lending Act, a section of the Dodd-Frank Act and the Fair Debt Collection Practices, most of which concern deceptive lending practices and reporting. But Elevate discloses in its prospectus that it may not always follow these laws.
“We may not always have been, and may not always be, in compliance with these laws. Compliance with these laws is also costly, time-consuming and limits our operational flexibility,” the company said in its prospectus.
Elevate has tried to fight those laws through lobbyists. Crossroads Strategies LLC lobbied against CFPB regulations and other laws for the firm, according to disclosure filings, and Polaris Government Relations LLC worked against the implementation of Dodd-Frank on the company’s behalf in 2014 and 2015.
Those lobbyists should expect more paychecks. Regulators have been cracking down on the consumer lending business, particularly those targeting sub-prime consumers and with high interest rates, and Elevate lists several upcoming regulations and laws as risks in the prospectus.
For example, Elevate’s loans use the Automated Clearing House system to take funds owed directly out of the consumer’s bank account, with customer authorization. The U.S. Department of Justice and other regulators, particularly in New York, have taken steps to discourage banks from working with online and short-term loan providers, Elevate says in its prospectus. The Rise product is currently available in 15 states — not New York — and it doesn’t make loans directly in Texas and Ohio.
Its product in the United Kingdom, Sunny, is operating on an interim permission, while the UK increases regulation on the “short-term, high-cost credit industry with the stated expectation that some firms will exit the market.” Due to previous regulation, Elevate had to change Sunny to an installment loan, instead of a line of credit, and it awaits the UK’s decision on the loans by April 1.
“There is no guarantee that we will receive full authorization to continue offering consumer loans in the UK,” the company said in the prospectus.
Because of the possible new regulations, as well as other factors, Lynn Turner, managing director of consulting firm Litinomics and formerly chief accountant at the Securities and Exchange Commission, said investors would be taking a serious gamble.
Beyond regulation, the company’s financial structure scares some analysts. Formed in 2014 as a spin-off of Think Finance Inc., a technology licensing platform as well as a lender to consumers with less-than-stellar credit, Elevate reported $2.6 billion in loan originations from 2002 to 2015, involving 1.3 million customers.
The funding for many of those loans, through the Rise and Sunny offerings, comes from one source, Victory Park Management LLC. Elevate owed Venture Park Capital $247.3 million as of Sept. 30, and had an outstanding balance of $50 million in debt to Elastic SPV. Elevate said it plans to use “all or a portion” of its proceeds from the IPO to pay off the Venture Park debt.
Elastic lines of credit are originated through third-party lender Republic Bank, which uses Elevate’s software for loan approval. Elastic SPV, a special purpose vehicle Cayman Island entity that receives its funding from Victory Park Capital, then can buy a 90% participation interest, but Elevate takes on the loan-loss risk.
And those risks are substantial. The company reported net charge-offs, or debt owed to a company that likely won’t be recovered, as a percentage of revenues at 51% for 2014, 43% for 2013 and 48% so far this year, the company said in its prospectus.
Because of the risks and the spin-off from Think Finance, Max Wolff, chief economist at Manhattan Venture Partners, said he’s suspicious of the offering.
“It looks like a cash-out spin-off, not a traditional IPO,” Wolff wrote in an email. “The deal has the full set of caution flags and this model remains to be tested by a coming rise in interest rates and also a recession.”
Elevate can point to its growing revenues, from $72 million in 2013 to $274 million in 2014, with net losses of $45 million and $55 million. It also has well-known venture backers in Sequoia Capital and Technology Crossover Ventures, and company executives, Venture Park Management and Technology Ventures have all indicated intent to buy shares of common stock in the offering at the initial public offering price.
Kathleen Smith, principal at Renaissance Capital, a manager of IPO-focused ETFs, cited those as positives for the company’s IPO, along with ownership of proprietary technology and a customer base in an “under-served market. But the way it assesses creditworthiness, as evidenced by the net charge-offs, causes concern.
“It’s a financial company where you don’t know the [consumer’s] credit history,” Smith said. “The model is still unproven when it comes to their track record.”
- Francine McKenna contributed to this article.
[ad_2]
The American economy is underperforming where it could and should be, said John Snow, former secretary of the Treasury.
"The participation rate in the workforce is way down, it's the lowest we've seen in decades," said Snow. "So while our labor markets are improving, they are not where they should be, and while we have reasonable growth it's not where it should be."
Snow currently manages JWS Associates, a consulting firm he founded in 2006. From February 2003 until June 2006, Snow served as United States Treasury Secretary under President George W. Bush. Prior to that post, Snow held the positions of chairman and CEO of CSX(CSX - Get Report) , a global transportation company, between 1989 and 2003. Between 1994 and 1996, Snow served as chairman of the Business Roundtable, a business policy group comprised of 250 chief executive officers of the nation's largest companies.
Despite his worries about the economy, Snow said he approved of the Federal Reserve's interest rate hike last month, saying it was about time the central bank moved on from emergency measures instituted during the credit crisis. Still, he said he would be "surprised if we see more than one or two" more rate increases this year.
Regarding China's recent stock market swoon, which is dragging down U.S. stocks in 2016, Snow said the country is in for a hard road after years of debt-fueled spending on construction projects and housing that is now likely vacant or abandoned.
"I think their leadership recognizes that they have to keep their eye on the short term and not allow this to become a cascading problem, but also keep their eye on the long term in getting that economy working in the right way," said Snow.
He said the reduction in oil prices has been a double-edged sword as consumers have benefited at the pump, but investment in the energy sector has plummeted. As for the drop in coal prices, Snow said it has weighed heavily on the railroad industry including his former company CSX.
"We are not building any new coal-fired plants and that's a big hit to the railroads," said Snow. "It's going to be a test of railroad management to cope with that situation and still produce pretty good earnings and they will have to do that through tight cost management."
Walmart abruptly announced Friday that it was abandoning a promise to build stores in Washington’s poorest neighborhoods, an agreement that had been key to the deal allowing the retailer to begin operating in the nation’s capital.
The giant retailer cited increasing costs for the new projects and disappointing performance at the three D.C. stores it opened over the past several years. But news that Walmart would pull out of two supercenters planned for east of the Anacostia River, where its wares and jobs are wanted most, shocked D.C. leaders. In one case, the city had already committed $90 million to make a development surrounding one of the stores viable.
“I’m blood mad,” said D.C. Mayor Muriel E. Bowser (D) at a Friday news conference.
“It’s an outrage,” said former mayor Vincent C. Gray (D), who in 2013 completed the handshake deal for the stores. “This is devastating and disrespectful to the residents of the East End of the District of Columbia.”
The decision to withdraw from the planned D.C. locations came as part of a broader strategic move by the nation’s largest retailer to shutter 269 of its stores around the world — but not the existing D.C. stores, the company confirmed — a plan Walmart hopes will allow it to focus on becoming a more serious player in online shopping and to improve its remaining fleet of supercenters and grocery stores.
People walk past a Walmart Express store in Richfield, N.C. District officials are upset over the company’s cancellation of planned supercenters east of the Anacostia River. (Jason E. Miczek/Bloomberg)
But in the nation’s capital, the two stores were more than statistics. For D.C. leaders, they amounted to Walmart breaking a promise that had allowed it to win a public relations coup at a critical point for the company.
After saturating the nation’s rural landscape with big-box stores at the turn of the decade, Walmart had been blocked by liberal politicians and unions in New York and Boston from its next frontier, remaking retail in the nation’s urban core. But in the District, Walmart won the right to open stores surrounding the U.S. Capitol — and a symbolic victory for its belief that low-price goods help its poor customers more than low-wage jobs hurt its workers.
Under the initial deal, Walmart could build stores almost anywhere in the District, as long as it opened two stores in its poorest wards and areas of the city sometimes referred to as food deserts, with few — if any — options for fresh produce and groceries. One was planned for Skyland Town Center in Southeast Washington and the other at Capitol Gateway Marketplace in Northeast Washington.
The deal came at significant cost, however. Pushed by labor unions, a majority of the D.C. Council at first pushed back against welcoming Walmart to the city. Opponents cited Walmart’s large profits and refusal to let workers unionize, as well as its reputation for low wages.
But as recently as last week, all of that seemed like a distant memory. In her list of first-year accomplishments, Bowser had included a ribbon-cutting ceremony at the city’s latest Walmart, at Fort Totten, in a video montage and listed a technical deal signed in the fall that cleared a final roadblock for construction at Skyland.
Then on Friday, the deal was off. Walmart officials entered the mayor’s office early in the morning and apologized, saying plans and economics had changed. Large urban Walmarts were more expensive to build and less profitable to operate than expected — especially, it turned out, in the District.
Mike Moore, Walmart’s executive vice president of supercenters, said in an interview that the decision to pull out of the projects at Skyland and Capital Gateway was based on fresh assumptions the company was making about the potential profitability of those stores. The officials said that they did not feel confident that the planned stores would generate healthy sales volume. Their latest math suggested that construction and operating expenses were going to be higher than they had originally budgeted for.
So far, Moore added, the three stores Walmart has opened — one blocks from Union Station in the trendy NoMa neighborhood and two in gentrifying areas along Georgia Avenue and at Fort Totten — were underperforming and “just not anywhere close to your expectation.”
Council member Jack Evans (D-Ward 2) head of the council’s finance committee, sat in on the meeting Friday morning with Walmart officials and Brian Kenner, Bowser’s deputy mayor for planning and economic development.
Evans said that, behind closed doors, Walmart officials were more frank about the reasons the company was downsizing. He said the company cited the District’s rising minimum wage, now at $11.50 an hour and possibly going to $15 an hour if a proposed ballot measure is successful in November. He also said a proposal for legislation requiring D.C. employers to pay into a fund for family and medical leave for employees, and another effort to require minimum work weeks for hourly workers were compounding costs and concerns for the retailer.
“They were saying, ‘How are we going to run the three stores we have, let alone build two more?’ ” Evans said.
“The optics of this are horrible; they are not going to build the stores east of the river, in largely African American neighborhoods? That’s horrible; you can’t do that,” Evans said. “A deal’s a deal.”
It was immediately clear that Walmart’s announcement could also reverberate in a city election year. Gray, who is considering an effort to resurrect his political career after prosecutors dropped an investigation into his first mayoral run, said he was outraged.
Gray cast blame on Bowser’s team, saying he had met with the project’s developers two weeks before he left office last year, and “everything was on track.”
“What did the administration do to stay on top of this? There is no bigger project going on than this one, maybe in all of the East End,” he said of Skyland.
Gray could run against Ward 7 Council member Yvette M. Alexander (D), or in an at-large race. But on Friday, he sounded more like a mayoral candidate.
“If I were mayor, I’d get on a plane and go Bentonville,” to Walmart’s global headquarters in Arkansas, Gray said. “They should be held accountable.”
Speaking to reporters, Bowser was more muted. She said she was disappointed but stressed that the District’s three existing Walmarts were not on the closure list.
Michael Czin, her communications director, said that Walmart had signed a lease at Skyland, but attorneys for the administration and the developer were still analyzing if either could be entitled to liquidated damages.
“We’re assessing options and looking at everything,” he said. “We continue to talk to legal counsel. It’s still somewhat early; folks are looking into how everything was written.”
Staff writer Fenit Nirappil contributed to this report.
Aaron Davis covers D.C. government and politics for The Post and wants to hear your story about how D.C. works — or how it doesn’t.
Sarah Halzack is The Washington Post's national retail reporter. She has previously covered the local job market and the business of talent and hiring. She has also served as a Web producer for business and economic news.
WASHINGTON — When 2010 began, the United States economy seemed to be on the mend and leaders of the Federal Reserve discussed how they would unwind their extraordinary rescue efforts from the crisis that erupted in 2008. The term “exit strategy” was mentioned 37 times in their first two policy meetings of the year.
By the time the year ended, the Fed was pumping a further $75 billion a month into the financial system by buying bonds, aiming to keep the young expansion from falling apart. And though they did not know it at the time, Fed officials were on the path toward another half-decade of zero interest rates and creating trillions of dollars from thin air.
Transcripts of the Fed’s 2010 policy meetings, released Friday after the customary five-year lag, show how it got from Point A to Point B. The central bank’s officials forged a halting, unsure path toward greater activism as they realized that the global financial crisis, which had seemed over when the year started, had really just entered a new stage — a sovereign debt crisis in Europe and the threat of economic stagnation in the United States.
How the Bernanke Fed Decided to Pump Billions Into the Economy
Transcripts from Federal Reserve meetings in 2010 show, in real time, how the central bank under chairman Ben S. Bernanke came to the conclusion that the economy was in greater peril than it had initially seemed.
During the eight meetings of the Federal Open Market Committee that year, plus two unscheduled emergency conference calls, Chairman Ben S. Bernanke and his colleagues concluded that the economy was in greater peril than it had seemed at the start of the year. They agreed upon fresh actions intended to guard against a new recession or falling into a deflationary trap.
Janet L. Yellen, the current chairwoman who served in two senior roles in 2010, emerged as a major ally of Mr. Bernanke and an early voice in favor of more activism.
“Given the tenuous state of business and consumer confidence, I consider it critical at this juncture that this committee not be perceived as falling behind the curve, being unwilling to act, or being out of touch with the mounting concerns we see in the markets and on Main Street,” Ms. Yellen, then the president of the San Francisco Fed, said at the Aug. 10 policy meeting. “The data show a considerable slowing of the economy during the summer, and the near-term outlook has been marked down appreciably.”
At that meeting, she also urged her Fed colleagues to consider options to ease monetary policy further, even though “our quiver has fewer arrows than I’d like.” It would take three more months before the committee as a whole agreed with her and undertook a $600 billion effort at “quantitative easing,” or bond buying, frequently referred to as “QE2” because it was the second such move by the Fed.
The start of QE2 — Mr. Bernanke hated that term, he made clear in one meeting, as he unsuccessfully urged his colleagues to refer to the program by what as he viewed as the more technically precise “large-scale asset purchases” — was a controversial move inside and outside the Fed.
After the decision, which coincided with an election that swept a Republican Congress skeptical of government intervention into power, the Fed faced sharp criticism from conservative lawmakers and from Germany and Brazil, among other countries. Objections included the ways bond buying could distort financial markets and foreign exchange prices, and the burden the Fed was taking on itself to right an economy with problems that went deeper than insufficiently easy monetary policy.
What was less well understood at the time, but is made plain by the new transcripts, is how the internal debate at the Fed resembled the external one, with many of the objections outsiders raised to the Fed’s monetary activism also articulated behind closed doors at the central bank’s Washington headquarters.
“My views are increasingly out of step with the views of most people around this table,” Kevin M. Warsh, a Fed governor who was a close adviser to Mr. Bernanke on financial market matters, told his fellow policy makers at the November meeting.
“The path that you’re leading us to, Mr. Chairman, is not my preferred path forward,” he continued. “I think we are removing much of the burden from those that could actually help reach these objectives, particular the growth and employment objectives, and we are putting that onus strangely on ourselves rather than letting it rest where it should lie.”
He added: “The benefits strike me as small and fleeting. The risks strike me as unknown, uncertain, and potentially large.”
Mr. Warsh ultimately voted for the action, saying he would dissent if not for personal loyalty to Mr. Bernanke and because “I wouldn’t want to undermine at this important moment the chance that this program could be successful.”
The transcripts also show how Fed officials grappled with the crisis in the eurozone, especially Greece, that nearly spiraled out of control in the spring and in the fall. But the signature action of the Fed in 2010 was the decision in November to start its second round of quantitative easing.
Several other supporters of the action were also uneasy. “This is a difficult decision for me, and I think it was a difficult decision for most of you,” said Daniel K. Tarullo, another Fed governor. “The only people I worry about are the people who think that the decision was easy, whether to do nothing or to do precisely this, because I do think that, as many people have pointed out, there are nontrivial costs and nontrivial benefits.”
At the same time, the transcripts contain a couple of prescient references to the action setting the stage for “QE3,” as a round of bond buying that would commence in September 2012 was frequently called.
“Quantitative easing is like kudzu for market operators,” said Richard W. Fisher, then president of the Dallas Fed. “You’re familiar with this analogy because you’re a Southerner, Mr. Chairman. It grows, and it grows and it may be impossible to trim off once it takes root in the minds of market operators.”
After all the officials had spoken, Mr. Bernanke, who often displayed a collaborative style that aimed to unite officials, set up the final vote with this reminder: Nonaction is a type of action, too.
“Any action we take or don’t take is going to expose us to the judgment of history if we make the wrong decision,” he said. “Not taking action is a risky step, just as taking action is a risky step.”
The Obama administration declared a halt Friday to any new coal leases on federal land, saying it would conduct a sweeping review of the economic and climate impact of extracting vast amounts of taxpayer-owned coal throughout the West.
The moratorium, which could last up to three years, will probably have a modest immediate effect on the nation’s struggling coal industry. But it provided fresh ammunition for environmental activists now intent on keeping the nation’s remaining fossil fuels in the ground. And it signaled the White House’s determination to press ahead with an ambitious environmental agenda — even as conservatives become more aggressive in pushing back against the federal government’s management of public lands in the West.
The review also highlights how long it can take to shift the way government operates: The leasing program first came under fire as uncompetitive and not sufficiently profitable for taxpayers in 1983, and has come under intensifying legal and political pressure for much of the president’s time in office.
Interior Secretary Sally Jewell said in a conference call with reporters that the last time rules were put in place, “that was a time, 30 years ago, when our nation had very different priorities and needs. The result was a federal coal program designed to get as much coal out of the ground as possible. And in many ways, that’s the program that we’ve been operating ever since.”
Coal production on federal lands accounts for roughly 41 percent of the nation’s total coal production. The vast majority of that mining — 86 percent — takes place in the Powder River Basin, which spans northeastern Wyoming and southeastern Montana.
Unlike offshore oil and gas drilling, in which the federal government identifies areas that should be put up for leasing and others that should be off-limits, companies in the Powder River Basin propose lease sites to the Bureau of Land Management, which is then obligated to consider them. The companies also pay a much lower royalty rate to the government — between 8 and 12.5 percent — than do offshore leasing firms, which pay an 18.75 percent rate.
Over the past decade, according to a 2014 Government Accountability Office report, roughly 90 percent of the competitive lease sales held in the region had just one bidder, and the government accepted 83 percent of the firms’ initial bids. Sen. Edward J. Markey (D-Mass.), who commissioned the report, estimated that taxpayers have lost hundreds of millions of dollars in royalties in recent lease sales.
Now, Markey said, the combination of concerns over coal’s impact on the climate and the fact that taxpayers were “getting shortchanged” tipped the scale in favor of reform.
The administration’s move is part of a broader effort to “modernize” the nation’s energy system, said BLM Director Neil Kornze, a push that has led to rapid growth of solar and wind energy. As the coal industry has shrunk, employment has grown in the renewable sector, which is now cost-competitive with coal and other fossil fuels in some parts of the country.
The Powder River Basin produces 400 million tons of coal annually; analysts had projected that production would increase slightly through 2030. Tom Sanzillo, director of finance for the Institute for Energy Economics and Financial Analysis, said he would now project a decline in coal production of 1 percent a year through 2030, cutting the amount extracted from the region over the next 15 years by almost 1 billion tons.
There are “almost 20 years of supply in industry hands” already, Kornze said, noting that the moratorium includes exemptions for small modifications to existing leases and emergency leases if companies face less than a three-year coal reserve. He estimated that out of roughly 50 pending lease applications, 18 might qualify for an exemption and move forward.
Industry officials said that they did not think the pause during the review process would deliver a serious blow, but called it misguided.
Peabody Energy spokeswoman Kelley Wright said in an email that the firm has “more than 20 years of production through our superior Powder River Basin coal reserve position, representing long-term security of supply and a competitive strength. Nonetheless, the administration’s actions represent poor policy and a flawed way to accomplish carbon goals.”
Several top Republican lawmakers decried the administration’s action. House Speaker Paul D. Ryan (R-Wis.) said in a statement the effect would be “immediate and severe: lost growth, lost jobs and lost revenue that would have gone to schools, bridges and roads.”
Several environmental groups, such as Friends of the Earth, Defenders of Wildlife and WildEarth Guardians, have sued the government in recent years for not factoring into its leasing decisions how extracting coal affects the climate. David Hayes, who served as deputy secretary of Interior from January 2009 until June 2013, said he and others discussed reflecting climate impacts into the royalty rate shortly before he left the administration, “You can’t move a policy battleship in a short time frame. Generally, it takes a lot of thoughtful analysis.”
Many environmentalists — and some politicians, including Democratic 2016 hopefuls Sen. Bernie Sanders (I-Vt.) and former Maryland governor Martin O’Malley — have expressed support for the “keep it in the ground” movement, arguing that the vast amount of remaining fossil fuels will have to remain untapped to avert dangerous levels of warming.
“For years we’ve been arguing we need to combine action on our tailpipes and smokestacks with a supply-side strategy to keep dirty fuels in the ground, and in the last few months, we’ve made tremendous progress,” said Sierra Club Executive Director Michael Brune, whose group also sued over the coal leases.
While states such as Montana and Wyoming have come to rely on revenues from federal coal sales, — they get 50 percent — some people who live near massive strip mines say that the region’s assets are being given without regard to the costs to local communities. Local concerns deepened earlier this week after Arch Coal, one of the largest U.S. coal producers, declared bankruptcy, sparking fears that some of the region’s moonscape-like strip mines will be abandoned without a proper cleanup.
Montana rancher Steve Charter, whose cattle grazes on lands above a large underground mine, said the coal program has long been skewed to benefit a few wealthy companies. “Public lands and public resources should be managed for the public good,” he said, “not for the bottom lines of private corporations.”
At a time when hostility toward the federal government is running high in some rural areas — as shown by the armed occupation of a federal building in southeast Oregon’s Malheur National Wildlife Refuge — administration officials have emphasized their support for communities transitioning away from coal. Obama pledged in his State of the Union address Tuesday to fund transportation projects in these areas.
In the year ahead, Kornze said, the BLM will ensure “were not a remote entity working on this, we’re at the table with people impacted in a whole series of ways.”
Ultimately, the next administration will decide when and where coal leasing takes place, and it appears likely that a Republican president would probably revive the old system.
“But this is an important conversation that needs to happen, and it needs to start now,” Jewell said, even as she noted her successor would make the final decision.
Juliet Eilperin is The Washington Post's White House bureau chief, covering domestic and foreign policy as well as the culture of 1600 Pennsylvania Avenue. She is the author of two books—one on sharks, and another on Congress, not to be confused with each other—and has worked for the Post since 1998.
Joby Warrick joined the Post’s national staff in 1996. He has covered national security, intelligence and the Middle East, and currently writes about the environment.
The futures couldn't hold the rally yesterday as you can see they tanked again this morning. I was thinking that because it was option expiration day that they would hold the market up today and save this move down for Monday. But the bulls just can't seem to hold anything right now.
Chartwise we were overbought on the 60 minute MACD's yesterday and getting there on the 2 hour chart. The 4 hour and 6 hour still had room to go on the upside at that point.
My thoughts were one of two scenario's... one, that we'd see the 60 minute chart rollover today and reset for another move up later in the day if it pullbacked small at the open. Or two, I thought they extend it up into even more overbought territory and start the rollover later in the day.
Neither happened as obviously they have different plans. Rollover afterhours and premarket and wiping out every bulls that went long yesterday seems to be the plan. They squeezed the bears with the rally yesterday and now the bulls.
What's next? Odds are there wasn't many bears taking a short yesterday after the squeeze, so that means we could continue falling all day if they want. Not saying we are going to crash today but it's pretty ugly right now before the open.
At this point I don't have a clear direction. I was expecting the rally yesterday as the charts suggested that, but this morning we are mixed. I certainly can't see another huge rally again like from yesterday, but it's possible they retrace some of this early move down. But let's face it... huge gap downs like this catch the bears off guard and bounces are usually weak because the bears want to short them and the trapped bulls want out.
So I don't expect much of a rally "if" we have any at all? Best to just sit today out I think as I have no edge to see where we are going. Markets closed Monday for Martin Luther King Jr. holiday, so have a good weekend.
Yesterday I thought we would rollover either that day or today (Thursday) for a B wave down. I thought it would be 20-30 points instead of the 5-10 points from prior pullbacks last year as I see us in a bear market now with more downward pressure on the market then in the past.
I thought we might hit the falling trendline of resistance before rolling over but it couldn't make it and rolled over at the open.
This 60 minute chart got massively oversold yesterday and is now pointing up strongly. The 2hr, 4hr, and 6hr are also pointing up, and should support the 60, allowing it to go up past the zero level on this move up today.
My thoughts are that we'll rally today as I do think the move down yesterday wiped out all the bulls looking for the same ABC rally that I was. Resistance will be at yesterday's high around the 1940 area, and that will probably meet that falling trendline at the same time. I doubt if it gets through it today. That would be your exit for anyone going long. But at the open we could "should" see some pullback as trapped bulls from yesterday bail from this small move up. We could see a retest of the premarket lows, but I wouldn't bet on it. Considering that the wiped out all the bulls yesterday the market is fully loaded with bears now and the best moves up from oversold conditions don't do a backtest, and instead just squeeze the bears all day long. On another note, while I think one should exit at that resistance zone around 1940 I wouldn't flip to short again as we could chop sideways at that area and continue the bear squeeze up tomorrow.
Possible point to hit and then rollover is this falling trendline around 1960.
This 4 hour chart shows the MACD's up near the zero level, so we could see another pullback soon.
Maybe not today, but by Thursday I think this will rollover as the 6 hour chart hits the zero area (it's at -7.5 to .15 now). The 2 hour chart is at +3.5 to +5 right now and running out of momentum. The 60 minute MACD is already extended reaching +5 area, rolling over, and trying to go back up now.
My thoughts are that eventhough we are oversold on many timeframes there isn't likely to be another straight up bear squeeze with few pullbacks like in the past. The short term time frames are going to be overbought between the open today and sometime Thursday (that's from the 60 minute up to the 6 hour).
This suggests that we'll see some good pullbacks each time the short term gets overbought as the daily and weekly charts still put a lot of downward pressure on the market. So when a resistance level is hit and the market rolls the moves down should be deeper then the ones in the past where we only saw 5-10 point pullbacks.
I'm not sure if we are really to break the low from Monday on any pullback this week, as I think we'll just put in a "higher low" and then turn back up early next week for another rally attempt. So from a wave count the move up so far is likely some kind of A wave up with another scary B wave down to start either today or Thursday... followed by a C wave up next week.
But again, this market is very likely in a bear market now and even if that C wave up next week looks strong and powerful, like it's going to breakout to a new high, odds are very good that it will only put in lower high and then take an even bigger move down into the end of January. We could see 2000-2020 by the end of the C wave next week I guess.
Should roll back down at some point today and make a "higher low" while the market makes a "lower low" or a double bottom retest.
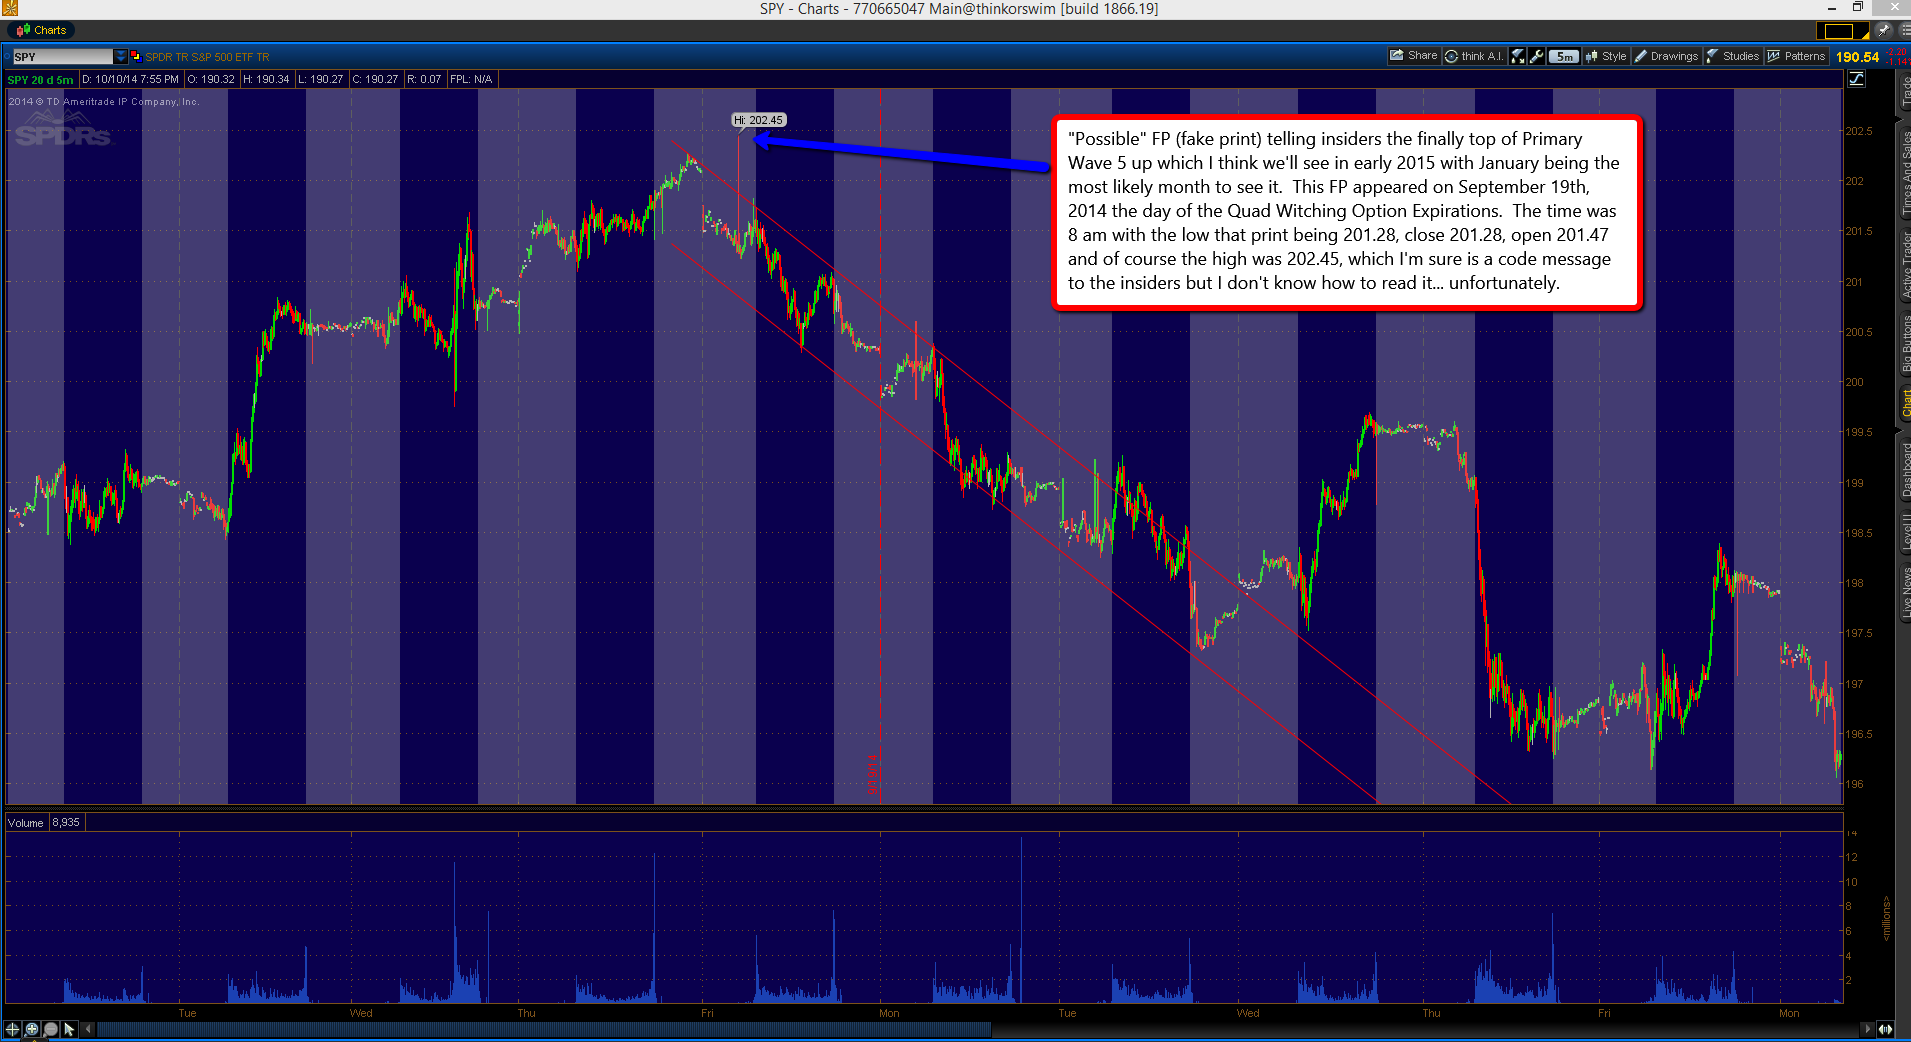
The Futures gapped down Sunday night to break 1900 and are now rebounding this Monday morning. This first rally should NOT hold and will likely be sold. We are still looking for the FP on the SPY to be hit and until it is I don't see any big rallies. I'm not sure when it will be hit of course but today would be ideal... of course we sheep don't always get want we want, but odds are good for the futures to retest the overnight lows at some point during normal market hours. If they did so, then it should come close enough to the FP to fulfill it.
This 60 minute chart of the ES Futures is already up at the zero line, using most of it's energy overnight to rally the market up. The 2 hour, 4 hour and 6 hour at -5, -13, and -18 so they will add support for this 60 minute chart should it rollover today.
My thoughts are that we'll hold the rally up today and NOT go back down to make a lower low. However, there's been a lot of technical damage for the bulls as the daily and weekly charts are still bearish and will add downward pressure again next week. We could easily see another down move on Monday, that could take us to the FP level on the SPY.
I guess it depends on how high this rally goes? It's trying to break the first level of resistance from the falling trendline, and did pierce it earlier this morning. Odds say it will get through it today but we could see some early selling at the open from trapped bulls first. But I don't think the early selling will make any lower low... it probably won't even go red.
Then I think we could see it rally back up later in the day to recapture the premarket high, and maybe more. I think we are heading toward that other falling trendline that's coming in around 1995 in this chart, but we might not see it until Monday morning, and it will be lower then.
If you look back at January 19th, 2010 to the low on February 5th, 2010 I think we could follow a similar pattern. Meaning we stop short of the the FP low yesterday (comparable to 01/29/2010) then rally for a few days before dropping again for the final low. Of course it won't follow exactly but the point is that the low is very likely NOT in yet.
So, let's look for some early morning selling that doesn't break yesterday's low. Then after a few hours in the morning the selling pressure should dry up and then we might see the late day "Friday rally" happen.... maybe around noon? Not sure? But we should close up today.
Not much to say here. Markets continue down without much of any bounce. At this point we just need to wait until the FP on the SPY is hit as that should be the bottom. If we continue down at this rate of speed we could hit the FP on Friday or Monday at the latest. My turn date of the 9th (+/- a day or so) is obviously going to be a bottom now and not at top as I previously thought might happen.
This also means that the low I was expecting toward the end of February could flip to a high instead. Not positive on that, but it's looking likely right now. That would then flip February from a rally month to a selloff month.
The recent mini-crash we had on August 24th, 2015, as forecasted in the movie Lucy on Scarlett Johansson's passport expiration date, and told here in the previous post 2 months before the event will be just a blip when compared to what is coming in 2016.
While I'm not positive on whether we have already topped already this year in 2015, or if we have one more slightly higher high coming in 2016, I will say with 100% confidence that we are in for another crash next year.
This coming week we have the Evil Reptilian Pope coming to visit the White House on September 22, 2015 (http://www.popefrancisvisit.com/schedule/arrival-in-washington-d-c/)... which I can't see as anything positive. This satan worshiping snake is surely making some kind of evil deal with our gangster run government leaders. What it is, I don't know? But it's clear to me that we are nearing the ending period for this stock market as when these people meet it's never good for us sheep. I'm not saying we are going to crash right after he meets but it's coming soon thereafter... like within a few months.
Over in China we have their government banning shorting their stock market back in July of this year (http://www.theguardian.com/world/2015/jul/09/china-bans-major-shareholders-from-selling-their-stakes-for-next-six-months), which spells disaster in my mind. When you don't let traders short the market you don't have any bears to squeeze, and that means you don't have any way to rally a market up from a sell off except for tricking the sheep into buying, and that's probably not possible after you scare them with a big drop.
Next to the sheep buying you have the big institutions buying the sell off, but they aren't dumb either and won't buy it without seeing some trapped shorts to squeeze... which of course gets the market going up big time as they all have to cover at a loss. This is exactly how over here in America our government has keep they market up as high as it's at now. Without shorts in the market to squeeze you will go "no bid" and just crash... and that is precisely what's been happening in China. And I don't think it's over with yet. When America crashes next year China will go down again.
There's your clues in the news that tell you the stage is set to crash in 2016!
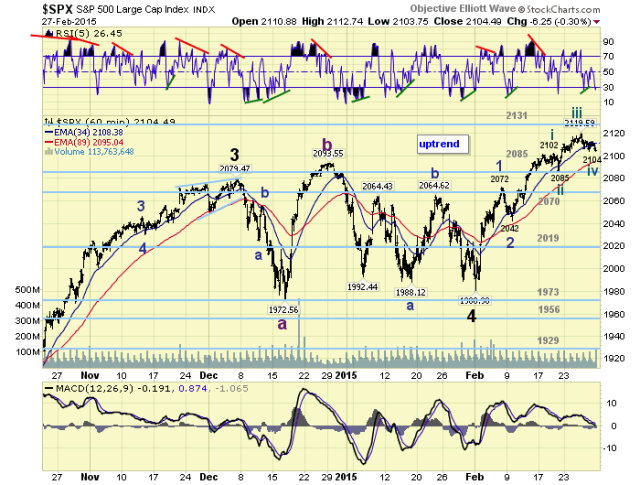
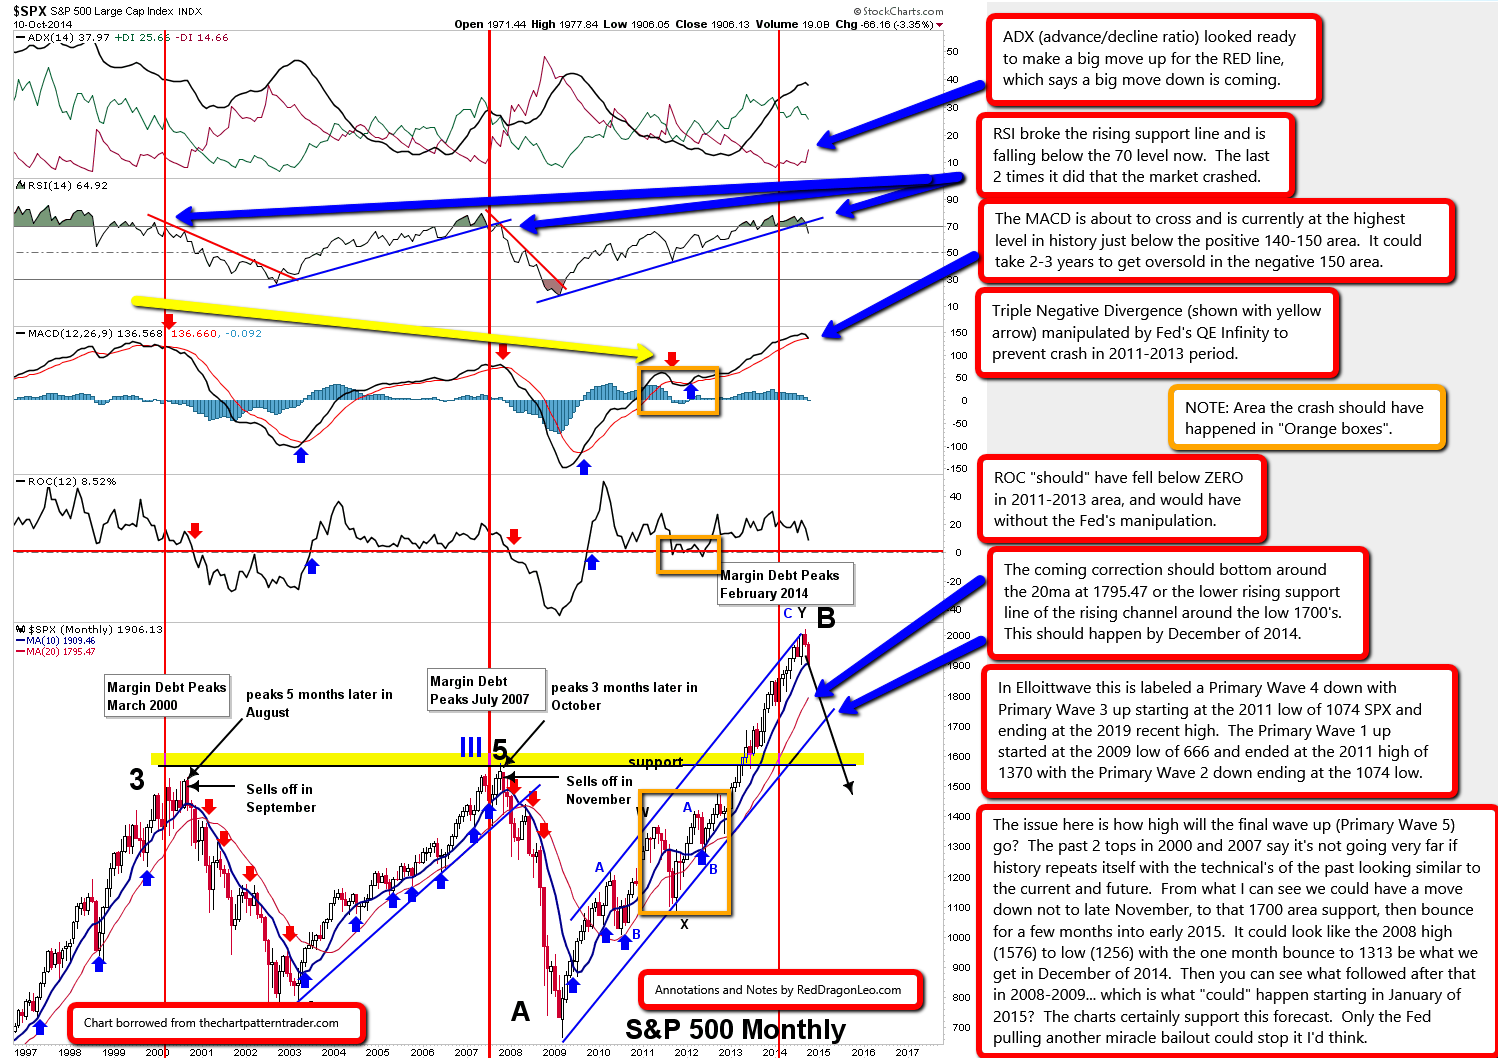
Looking at the technical picture we have the monthly chart now looking a lot like it did in 2000 and 2007 before it crashed the following year. The rising channel lines drawn on that chart point to about the 1820 area for the lower rising blue trendline to be support if this month of September were to go down further. So, we should expect that level to hold on a monthly close on it's first hit of that trendline.
With the current down trendline being labeled Primary Wave 4 down by Tony Caldaro I'll continue to refer to it that way as well since his Elliotwave count seems to be the most accurate I've found. Not that I trade off of it on a day to day basis as I find it mostly helpful in seeing what's behind us and not too predictive for the futures due to it's many alternative wave counts.
However, on the bigger picture it's pretty good and looking forward. Basically we started Primary Wave 1 up from the 666 SPX low in March of 2009 and ended that wave in May, 2011 at 1370 SPX. Then Primary Wave 2 down happened into the 1074 low in October of 2011. Following that we had the super long Primary Wave 3 up that ended in May of 2015 at 2135 SPX. Currently we are in Primary Wave 4 down that should end around the first week of October, 2015.
Once it ends we will be starting Primary Wave 5 up, which should last 2-6 months, and may or may not make a new all time high. If it does make a new high then I'd expect it to last closer to 6 months and top out just above 2200 SPX. If it doesn't make a new high then I'd expect it to last closer to 2 months and would then be called a "truncated" Primary Wave 5... which is common and what I expect to happen.
Since I focus mostly on the technical analysis side of charting and not so much on the Elliotwave side I will say that from a TA side I don't see any new high coming and instead think we'll make a lower high on this Primary Wave 5 rally. In fact, I would not be surprised if they don't have some tricky big squeeze up for the month of October, peaking in early November for this final wave up.
That would then end the entire 5 wave series since the 2009 low and start the next cycle of waves down, that should erase 50%-80% of the entire market over the next couple of years. Should it only be 50% or so then we will likely stop and hold around the 1050-1100 SPX area where a rising trendline of support comes in at. It started at the 1974 low of 62, then the 1982 low of 101 SPX and connects to the 2009 low of 666 SPX. If that fails then we will find ourselves falling to another rising trendline from the 1929-1932 Stock Market crash low that connects to the 1942 low. That rising trendline is pointing to the low 400's on the SPX right now. Yeah, that's one scary low!
Of course we'll find support a the 2009 low of 666 first before it finally breaks and drops to the low 400's on the SPX, but that's too far out to predict right now. We only know that the evil gangsters who run the world want to create their insane New World Order where we sheep are even bigger slaves (and much poorer) then we already all. They want full control of every aspect of our lives, and crashing to the 1050-1100 SPX area doesn't seem too me to be deep enough to get the sheep into putting chips in their head or hands for the "Mark of the Beast" as foretold in the Bible.
But crashing to the low 400's on the SPX should would...
It would scare the sheep into giving up all their last freedoms to be saved from the severe poverty state that Satan's minions would put them into with a stock market wipeout like that! Naturally I don't want to see that happen, but I can't control it... I can only warn people that it is possible. It's possible from not only a charting point of view using technical analysis, but also from an "end times" model that we appear to be in right now... or at least those that rule the world think we are in.
Moving back to the short term I think we'll have a low in the market in the first week of October of this year. It should be a lower low then the recent 1867 SPX low on August 24th, but I'm not expecting something crazy like 1700 or so... like many others are forecasting due to the Shemitah September 28th date and the Blood Moon that happens too. I'm thinking in the low 1800 area for that bottom into early October.
Then we rally into mid to late October, topping out early November and dropping again the rest of that month with some bottom near the end of it and then the December Santa Claus rally starts until the first of 2016.
How low we go in November is not known yet?
Since Primary Wave 5 up should take 2-6 months I'd think we don't take out the expected Primary Wave 4 low around the low 1800's, but some massive squeeze up to 2100 SPX in October could change my mind? I'd rather see some steady 3 wave (ABC) pattern up to 2100 by the end of this year instead, because that would line up more inside the 2-6 months window for Primary Wave 5 up.
Doing the entire move in one month (October) would be very unusual and should then lead to a drop in November well below 1800 with the 1700's being the target zone. I personally don't think that will happen though, but I did want to point it out as "possible". Just visit this blog post daily to see new updated comments to stay up to date.
What would make more sense to happen is some low in the 1800 area early October or late September. Then start the A wave up for Primary Wave 5 up, that should top out mid to late October. Then down early in November for the B wave down inside Primary Wave 5 up, which should of course make a "higher low" then the start of the A wave up. Follow that by some C wave up in December to end the Primary Wave 5 up in early January, 2016 (or late December, 2015) that I think will hit 2100 area making a lower high then the Primary Wave 3 up all time high of 2135 in May of 2015.
While it's possible to make a new "higher high" for Primary Wave 5 up I just don't see it in the charts... from a technical point of view of course. The only thing that would make me believe we could see a "higher high" for Primary Wave 5 up is for the month of September to close above 2000 SPX, and I just don't think that will happen with the next 2 weeks being so bearish as seen in this chart below.
We just had the Fed's big September FOMC meeting where everyone expected them to raise interest rates and they announced that they wouldn't be doing that just yet. We sold off from that positive news, and that's not a good sign. If there was anything that should have been used to rally the market up to above 2100 by the end of September it would have been that good news.
Instead they did the announcement in the middle of September knowing very ware that the market would sell off after the news and drop lower into the end of the month. If they planned to extend this stock market higher into next year they would have made sure to give out some positive news near the end of this month to close it above it's 20 Month Moving Average... which is currently at 2000 SPX.
Here's a post done by Amateur Investor showing what happened in the past when the market makes 2 closes below the 20 Month MA.
Weekend Analysis
(9/5/15)
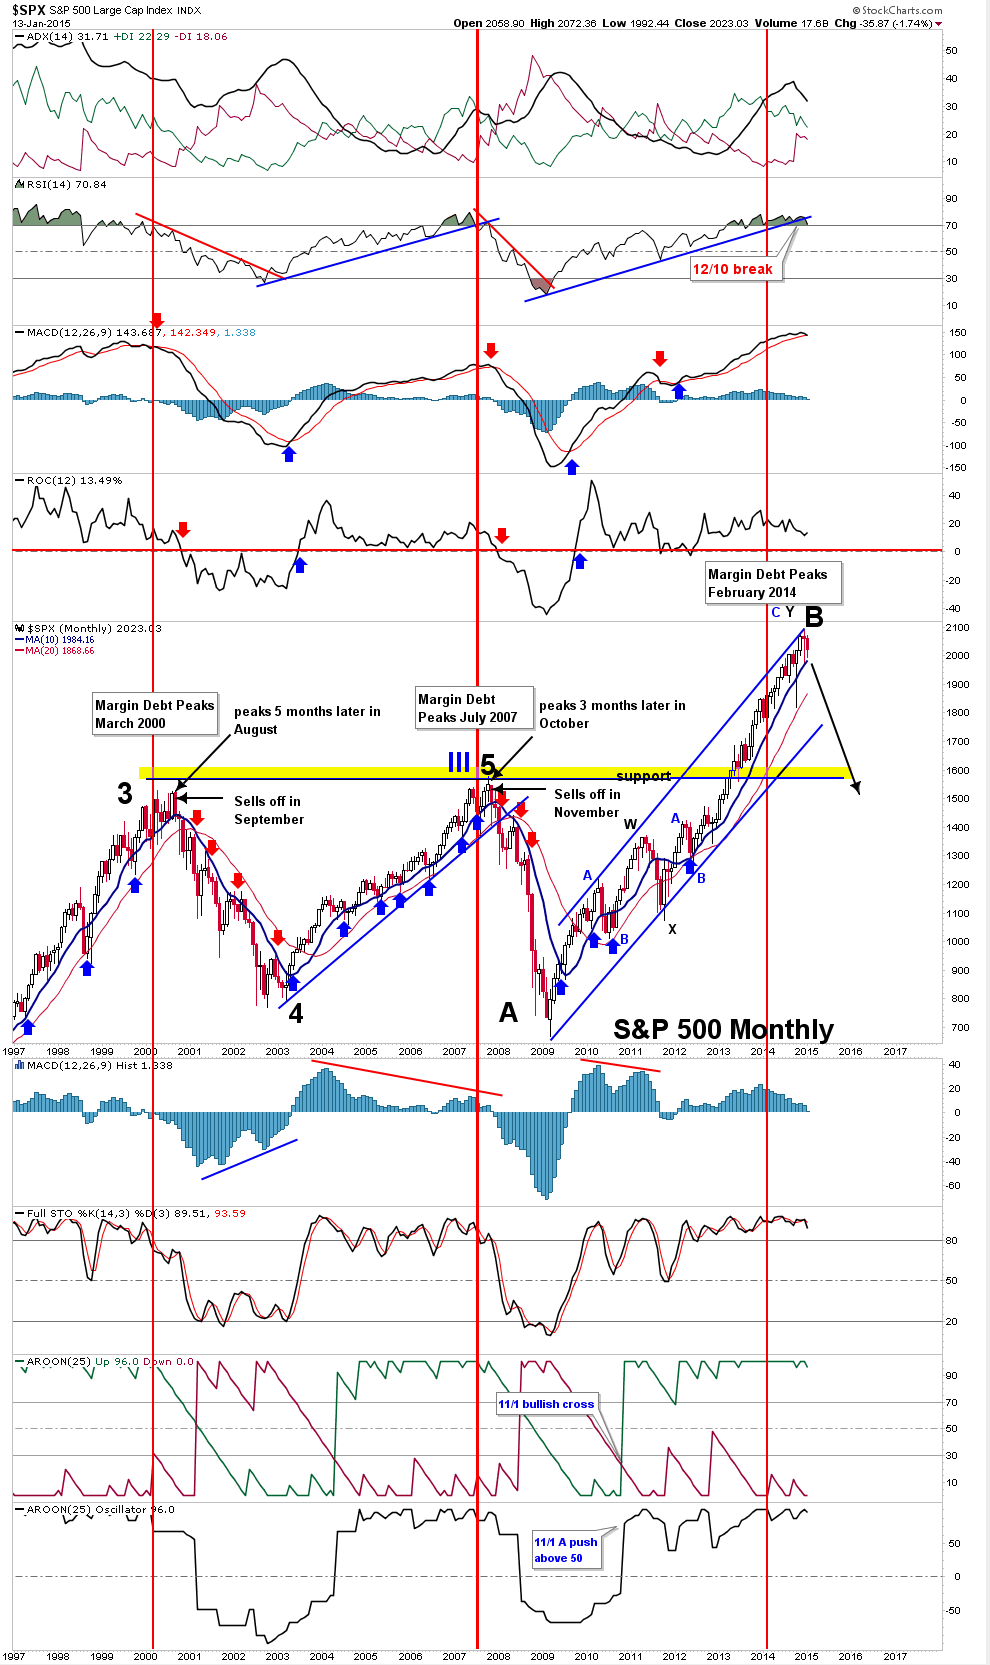
As I talked about last weekend there have only be "5" times since 1900 when the following conditions have been met.
1. Dow or S&P Composite dropped 10% in 5 Days or less.
2. Dow and S&P Composite were within 4 months of an "All Time High"
3. Shiller PE was 20 or above
4. The 20 Month Moving Average was tested.
Prior to the most recent event these conditions were met in January of 2008, April of 2000, August of 1998 and October of 1929. This month will be pivotal for the S&P 500 depending on whether it closes a 2nd Month in a row below its 20 Month Moving Average or not.
Let's see what happened with the prior "4" events and the 20 Month Moving Average. Starting with the last event in late 2007/early 2008 there were "2" monthly closes below the 20 Month MA in January and February of 2008. In this case the S&P 500 rallied back to its 20 Month MA which was then followed by another significant drop (points A to B).
The next case was in 2000 as the S&P 500 closed below its 20 Month MA "2" months in a row in November and December. Once again notice the S&P 500 rebounded back to its 20 Month MA before selling off again (points C to D).
Meanwhile in the Fall of 1998 notice the S&P 500 failed to close below its 20 Month MA in September and October although it did briefly drop below it two months in a row (point E). This was then followed by another significant rally through the Spring of 1999 (points E to F).
Finally the last event was in the Fall of 1929 as the S&P closed below its 20 Month MA in October and November. In this case the S&P rallied back to its 20 Month MA before another sharp sell off occurred (points F to G).
Currently the 20 Month MA in the S&P 500 is at 1999 sp this value won't change much over the next three weeks. Thus this will be a key level to watch by the end of the month and may have significant implications for the market in the future depending on whether the S&P 500 closes above or below it.
Clearly you can see that odds are very low that we'll make a higher high with Primary Wave 5 up when you have 2 monthly closes below the 20 Month MA... which I think we'll see by the end of this month.
To summarize, I'm looking for this week and next week to go down to make a lower low (then the 1867 SPX August 24th low) to complete Primary Wave 4 down. Then a rally into mid-late October for the first wave A up of Primary Wave 5... which should be somewhere in the 1950-2000 range I suspect. After that we should see a B wave down (inside Primary Wave 5 up) to lure in some more bears and scare the bulls out. This should NOT break the low of Primary Wave 4 down. Possible targets are 1850-1900 area. This should end in mid-late November. Finally we should have a C wave up (inside Primary Wave 5 up) that I suspect will reach around 2100 by the end of this year.
I'm losing my bearishness right now as the weekly chart is getting into oversold area where "turns" usually occur. Bears beware, we could see a new high coming soon.
July 29th, 2015 ... after the FOMC meeting Update
Well, the Fed's said nothing about a rate hike at today's FOMC meeting. So that rumor last week of a .35 rate increase in September was NOT confirmed yet. I suspect the retail traders will view this as positive and buy the market now. That tells me we will top out tomorrow or Friday instead.
I posted on the blog (in the comment section) the following after I did this newest video update...
"While I think we are "close" to having a breakout to a new high soon I just can't get excited about going long with the VIX so low and all those bulls still onboard from the 2040 SPX area over the last several months. If SkyNet would just flush them out with some drop to 2000-2020 I'd become a bull again.
They never filled the VIX gap at 16.60 and that leaves some hope that they might just be planing another drop to get the Weekly chart oversold and then allow for a bottom to form. All the bears would pile on below 2040 and once SkyNet gets the bus full it should be plenty of fuel to squeeze them up hard like the rip from the 1820 SPX low last year in October."
... and then this
"With the news from the FOMC today of them NOT announcing a scheduled rate hike in September as the rumor last week told us it would be .35% I have too think traders will get bullish now... and that should mean the opposite will happen and we'll drop again."
Finally I posted this...
"Do "NOTE" that even though the weekly chart is turning back up slightly this move up needs to happen fast... like before breaking that rising trendline on the weekly chart. If for some reason we break that support (that goes back to the 1074 SPX low in 2011) we could fall off a cliff and bury the MACD's, Histogram Bars, and Stochastic's on both the daily and weekly chart."
My thoughts are simple... we are at a critical conjunction where the weekly chart can take us up to new highs with 2200 area being a real target zone, OR we can break the rising trendline of support from the 1074 SPX low in 2011 and drop like a rock. I just don't know which one yet?
However, with the VIX still very low and near the long time support zone of 12 or so I don't see the bulls having the strength to power on up through the current overhead resistance right now. That leads me to believe we are still in this choppy zone until either the downside 2040 SPX support zone breaks (and breaks the weekly support trendline) or takes out the 2135 all time high.
With that support trendline rising in price level every week now (it looks to be around 2080 now) this "zone" we are in will likely break one direction or the other this week or next week. If we close below that 2080 area this week then next week could be an "all down week" as mutual funds and hedge funds hit the "SELL" button due to the long time weekly support line breaking. Remember, "computer trading" looks for certain levels to hold or break and once one occurs BIG moves in one direction or the other just happens automatically. Humans aren't doing but about 30-40% of trading now as "algo's" make up 60-70% of all trading according to many estimates.
As we all know the Elite that run the world 100% control the "Main Stream Media" (MSM) and constantly mislead the sheep that watch TV, read the newspaper or listen to the radio. But what about the Internet? Do they control it fully too? NO is the answer as we sheep have the opportunity to publish our own thoughts on blogs like this or various social media outlets. However don't just assume that "they" are still busy spreading their "dis-information" stories throughout the Internet to dis-credit true and factual information as I'm 100% positive they are do that every day.
Remember, their entire "motto" of life is to do everything in their power to steal from you, poison you, lie to you, use you, and kill you off when you are no longer a profitable debt slave. So you should NEVER assume that even though they are bound to tell in advance of the things they plan to do to you that they will do it in a timely manner where you can profit from it... as the opposite is true.
While I think Lindsey Williams is probably a very good man and truly wants to help people I also think his elite source gives him information that is timed to benefit the elite by "suggesting" though his leaked messages that us sheep go long gold near the top, short the dollar near the bottom and of course miss the entire move down recently in oil.
Without a doubt if you traded from his information you would go broke!
Of course he clearly doesn't tell you to trade from what he tells you but we all know that people will still listen to his stories and base their trading around the trend that they expect to happen from his information. This would again result in losing you money as every thing he's told us over the last 5+ years hasn't been correct. The dollar hasn't crashed, gold hasn't went up strongly and oil... well he claims his elite contacts never caused the sharp move down as that was apparently all done by Obama trying to push Russia president Putin.
Well, regardless of whether or not the elite crashed oil or Obama we sheep never seen it coming and didn't profit from it... so the facts are still the same, "You can't trade off Lindsey's information (unless you do the opposite?)", as it's clearly been wrong since I've started to follow him. That's been 5-7 years now I guess.
Since I wasn't following him when he claims to have successfully told everyone in advance of the 2004-2008 big move up in oil and the fall back down hard into the 2009 low I can't know if that was timed out where the sheep could have profited from his information or not? I only know that since I've known about him his information has been wrong.
So how do you use this information if it's timed to get the sheep into the stock market on the wrong side when the prediction is expected to happen?
Simple really... you assume we'll be bottoming when this September, 2015 Stock Market Crash is forecasted and looking for a shorting opportunity several months in advance of it. When I look back at the 2011 mini-crash I notice that we had the most powerful crash wave (the wave 3 down) in August and then we had 1-2 months of a wild and crazy wave 4 up before the final wave 5 down to 1074 SPX early October low.
Clearly it was very tough to make any money on the wave 5 down as you would have be shaken out many times as the wave 4 up had so many ups and downs in it that most bears would have be puking their guts out from week to week waiting on that final leg down. The big money (and safer wave to ride) was being short from late July, 2011 into the early August low for the wave 3 down. This is the wave I personally want to catch (if possible?) and just pass on the expected wild ups and downs in September and October of 2015.
Past evidence on prior moves down is clearly shown in these charts of the DOW as explained in this video about "The Shemitah"...
I've looked a several other video's about The Shemitah and how it points to September 13th, 2015 as being the "Elul 29" and just like this one the best. It's done by someone named James Trivette, a preacher I guess? Anyway, I think it's well worth your time to watch.
Eclipses in 2015 March 20: Total solar eclipse April 4: Total lunar eclipse
September 13: Partial solar eclipse
September 28: Total lunar eclipse
Eclipses in 2016
March 9: Total solar eclipse
March 23: Penumbral lunar eclipse
September 1: Annular solar eclipse
September 16: penumbral lunar eclipse
My thoughts on this forecast again of something bad happening (like a stock market crash) in or around September 13th, 2015 are that it will be a bottoming period, so we should be looking to get short much sooner. When you ask? We'll as most of you long time follows of this site know all about Legatus I'll point out that we have a meeting this coming June 15th-17th, 2015 and coincidentally an FOMC meeting June 16th-17th as well.
That meeting is the one that many people are expecting the Fed's to tell the market that they will be raising interest rates in September of this year. While I don't know if they will state that news in that meeting I do believe that if they do say it we'll see a top in the market as traders will start bailing out long before the actual rate hike happens 3 months later. So by the time September comes the bulk of the panic should be over with... which again leads me to believe it will be a bottoming period.
This also tells me that we should have another big "Wave 3" down (the crash wave) somewhere before that September 13th "Shemitah"date and/or September "Interest Rate Hike". Past history tells us that August is a bad month for the market and if you look at 2011 you'll see that the biggest move down was indeed in August, not September.
Quite possibly we will top in mid-June and start the first waves 1 down and 2 up from there until late July where another big crash wave happens into August? Of course it shouldn't follow the 2011 pattern exactly as that would be too easy for us sheep to figure out... and you know "they" won't make it easy for us to profit from. If fact they will do everything in their power to make us lose all our money so they can take it from us as they profit wildly from the crash they created.
What about Legatus?
In that Legatus meeting I'm sure they will make the final decision on whether or not the "Stock Market Crash" is still on for 2015 or if they are going to push it out one more year into 2016. I don't know the answer of course but I do believe without a doubt that it will happen before Obama leaves office as they want to blame this whole crash on him. He will be the "scapegoat" for the coming collapse even though it was planned many decades ago.
These elite are just a bunch of crust old white vampires that will get a kick out of setting up the first black gay American president... which is why they put him in office in the first place I'm sure. I kind of feel sorry for him in some ways as it's not his fault for what's coming. But they seem to have NO Feeling at all of compassion for other humans and will do whatever it takes to fulfill their sick agenda.
I can't tell you the exact date of the top or the bottom (assuming the crash still happens) as I'm sure that any date I put out there will (could?) be off simply because I said it would happen. I'm just saying that if too many people (sheep only, as the elite know the date) discover the exact day the market will top then they will be forced to change it.
I remember back in 2013 when I did several posts saying that we'd top on May 22nd, 2013 because it was right in the middle of a Legatus meeting and a ritual "33" day (http://reddragonleo.com/2013/05/06/we-are-just-weeks-away-from-the-start-of-a-200-or-more-point-drop-in-the-spx). I told everyone about it for 2-3 months prior to it happening. I thought it would be the top for the year, and we'd crash from there into a low later that year. While it did top out and drop from 1687 SPX to 1560 by June 24th it wasn't the high of the year, nor was it a crash.
I don't know if they plans were changed or not (due to the fact that there could have been too many sheep aware of the date after I posted it?), but I've changed a lot since then in my charting analysis and simply post what I think is possible, but give NO promises of "it will be the top" or "we must crash"... as I now know how quickly "they" can change the plans to make us blog writers and stock market forecasters look like fools.
Therefore I'll just point out "possibilities" with some supporting evidence that whatever date or time frame I might a forecast for "could" be accurate. My personal trading method today is "day trading", and I've do very well with this method over the last year or so... much more profitable then trying to forecast which direction the market will be going at a week or two from now.
This is one of the main reasons I don't post as much anymore. The other reasons are that the better I get at day trading the less information I can find out there to post on that will be correct in the near future. There just isn't enough "darkside information" available that is accurate. Ritual numbers and ritual dates are too abundant to call everyone of them and expect a turn in the market.
So I just do my best to post comments on whatever the current blog post is, which are there to inform everyone of what I see short term for the market. Then I re-post via my twitter account. Sometimes (if I remember?) I post it on my facebook account too.
Why is Walmart closing stores around the county claims plumbing problems and then NOT filing for a plumbing permit?
There's a lot of posts around the internet talking about the mysterious closings of all these Walmart stores for some plumbing problems and then blacking out all their store windows and hiring police officers (not security guards as most stores would) to guard the place. Then on top of that are all these military vehicles being spotted going to these stores. Are they planning on marshall law in the near future to put the sheep in? If so, what event would cause this?
Walmart Closing Five Stores For 'Plumbing Problems'
I know we've seen of a lot this stuff before in the past and nothing ever became of it (at least in the "stock market crash" forecasting), but it's still worth knowing about as at some point in the future I'm sure they will do something bad to us sheep so they can put these Walmart stores to use locking up certain people that go crazy when the economy collapses and they have no job, no home, and no food to eat.
Whether all this happens in late 2015 or they push it out until 2016 is unknown, but I firmly believe it will start before Obama leaves office. If the Fed's decide to announce the future interest rate hike in September, 2015 during this coming June 16th-17th FOMC meeting then we should all expect it to start this year. If not, then possibly they decide to push it out one more year?
However, I certainly get the feeling that it will start this year... bottom in Sept/Oct and rally up into 2016 before they pull the rug out completely and slaughter this fat pig of a market. Let's face it... the monthly chart of the SPX looks eerily similar to the 2011 period before a nasty mini-crash happened.
What about any FP's? (fake prints)
I don't have any new ones (on the large scale) but I'm still thinking this old one from January 2014 "could" still be in play. It's one showing the NYA at 11334.65 high.
There's also the old TVIX FP showing 35.9599 from 11/14/2013...
So not much to say on that subject. Those prints could both be nothing as they are old and plans could have changed from then to now. But I wanted to include them should the market put in a top in mid-June and start crashing into September as they could be targets?
I'm still not sure all the pieces are in place for the total collapse though as the ECB is still supporting their markets in Europe with their version of Quantitative Easing and isn't scheduled to end until September of 2016 (https://www.ecb.europa.eu/press/pr/date/2015/html/pr150122_1.en.html). But, that doesn't mean we can't get started this year here in America and have the first larger "Wave 1" down, followed by a mufti-month "Wave 2" up into mid-2016. Then the "Super Crash Wave 3" down into the end of 2016 and probably some of 2017 could happen.
In both the 2000 and 2007 tops and crashes that followed we had a month chart that produced a wave 1 down and wave 2 up before their wave 3 "crash wave" down happen... therefore we should expect something similar to happen this time around as well. That gives us a strong possibility that it will indeed start in 2015 but get worse in 2016. So let's keep our minds sharp and open to the fact that we do have some very good odds of a major turn down this year.
Final Clues: Has the elite already warned us of "The Crash Date"?
As we go back to September of 2001 we remember the both the movie called "The Matrix", TV show called "The Lone Gunmen" and the famous episode of "The Simpsons" where we were told in advance of something BIG happening on 9/11. In the matrix it was shown on Neo's expiration date that said 9/11/2001. On the lone gunmen episode it was a hijacked plane that was on a collision course for the twin towers, and finally on the Simpsons it was the cover of a flyer that showed the twin towers in the background with a big $9 to the left of it for the cost of the pamphlet.
No one but the insiders knew what that all meant as I seriously doubt it if there was one "red pill taker" sheep that seen all three (or just one or two) of those messages and figured out the meaning before it happened. If so, he or she certainly didn't post it on the internet for all to see (not that many would have seen it anyway as youtube wasn't around back then).
So I'm not going to tell you what I've seen that points to another date of something really bad happening but instead tell you to think like the matrix and go watch a movie called "Lucy" with Scarlett Johansson and you'll see the date I think we're going to crash. Enough said...
Red
P.S. Interesting how VERY BEARISH the week after the June 15th-17th is, which is based on prior history.
Just more evidence of a very important week starting June 15th and ending on "Triple Witching" Friday the 19th...
But if so the next move up should be a huge one...
The market looks a lot like the pattern from November 26th to December 5th, 2014. It first sold off for a couple of day and then ran back up to make a higher high on the 5th right before a drop of about a 100 SPX points. This suggests we'll end the down move Monday/Tuesday (the 2085 area is good support) and go back up into the end of next week topping in the 2130-2140 area.
This pattern also happened on September 4th, 2014 to the real high in that area on the 19th. It topped on the 4th, sold off for a week and then back up to make a final higher high on the 19th before the real move down started. That one was around 200 SPX before bottoming.
We find a similar pattern (with a small twist) back on the July 7th high to the real high on the 24th. This time the market dropped again for 4 days first, then rallied back up to make "almost" a double top, but failed and had a big "one day" drop on the 17th before it then ran up again into the 24th for the real "higher high" just before the 87 point drop followed.
Looking back even further in time I can see this pattern showing up many times with slight twists to it. Sometimes it did it's first drop for 2-3 days, then back up to a new high and other times it took over a week for the first drop to end. And some of the times there were 2 short drops before the final higher high with the real big drop that followed.
However, there were a few "fake outs" where it appeared that pattern was going to happen but it didn't. The October 30th, 2013 to November 7th was one such fake out. It did another fake out shortly afterwards on November 29th to December 9th, 2013 where each time the expected "big" down move to follow never happened.
The November 7th high was followed by a big bear squeeze for several weeks. The December 9th high did produce a few days of selling but it never dropped big like all the other periods where 80-120 points down usually followed. That drop from the 9th barely took out the first low that hit on the 4th of December.
After the move up first I'd look for about 2060-2070 area to be retested as that was a triple top area before the breakout...
It should last about 2 weeks I'd guess and then back up to start a huge wave 3 rally of some kind. Looking back again at the weekly chart and that rising trendline from the 2011 low of 1074 SPX I would expect it to hold again should they break through that triple top zone. The 20MA on it is at 2042 right now and the 40MA is at 2003... which is resting just about on that rising trendline.
If I had to guess I'd say that 3 weeks from now the trendline should be around 2030-2040, but with February having such a strong rally I'm not sure how far down they will allow the market to drop in March, but if they drop that far it should be over with by the 3rd week and allow a rally to start in the last week to recover most of the down move.
This was a twitter comment I read last week and if it's a "factual" statement then any early down move in March has high odds of being erased by the end of March.
"Since 1950 the SPX has gained >5% in February only 5 times (1970, 1975, 1986, 1991, 1998). Added to gains in March all 5 times."
On an "elliottwave" count I think we are in some type of smaller wave 4 down now, that should complete on Monday or Tuesday. Then a final smaller wave 5 up to about 2130 area to end a larger wave 3 up (that started at the 2042 low). This would then complete a 5 wave pattern up from that 2042 low to an estimated 2130 area high.
Assuming this larger wave 3 up ends up being around 90 points in length it the following larger wave 4 down should be some Fibonacci level of 38.2% or even 50% in depth. If that count is right then it doesn't look too good for the 80-120 points move happening that I'm thinking will occur. So for that reason I do think that this chart from Tony Caldaro will be relabeled should my technical analysis be correct by seeing a back test of the triple top area in the 2060-2070 area (or Tony says it's an "acceptable" pullback to still qualify as a wave 4?)
While I like to read what others have as wave counts using EW I just don't find it very accurate on the short term. The gangsters that run this market don't play by EW rules as we all should know by now. Try to make sense of that straight up rally from the 1972 low in December 2014 to the 2093 high and give me your EW count there? Can't be done in my opinion.
Don't get me wrong, I like Tony and find his posts helpful a lot. But SkyNet (what I call the super computer that manipulates the market) is programmed to steal your money. So it's well aware of bloggers (and traders) that use technical analysis, elliottwave, fib. levels, astrology, T cycles, etc... to predict the future direction.
Which of course mean...
It's going to fool you by letting these charting methods work for awhile and just when you think you've figured it all out SkyNet just pulls a 180 on your wave count (and/or TA's, Fib. Level's, etc...) and has some crazy move out of the blue that no one can see coming. The move up from the 1820 SPX low to the 2079 high is a perfect example.
I read many tweets about it and hear people say that they'd never seen such a move in their 40 years of trading! And other stating that it had never happened before in the past! This should tell you that the more us sheep have access to various charting methods that used too work before the internet the more likely we are to see "Crazy Ivan" type moves happen as SkyNet has to adapt to us sheep figuring out the next move and being on the right side of the trade for once.
Since SkyNet can't steal the sheep's money and give it to the bankster gangsters that programed it the computer is forced to go hard in one direction or the other to hit all the buy and/or sell stops put in place by the sheep. What I'm saying here is that a typical wave 4 down should be around the same length as the wave 2 was (2072 down to 2041 on 2/9), and some smaller Fibonacci level like 23.6% or 38.2% as opposed to 50%-61.8% that I'd need for my thoughts of dropping back to that triple top area.
Regardless of the EW count I'm still leaning toward my forecast of a dip to 2085 area Monday/Tuesday, up to 2130 area and then down to 2060-2070 zone to retest the breakout point that has taken us up to the current new highs. That's my forecast for now and I'm sticking too it! LOL.
Red
P.S. I installed a new commenting system so now you can use Disqus, WordPress, Facebook, or Google Plus to leave your thoughts on the market. I'll set it to default to show the Disqus comments as that's what I've had on the blog since I started it in late 2009. Unfortunately you'll have to click on each of the 4 icons to read (or leave) comments using each of them as it does not combine them all together. There could be some comments under each one so click on all of them to see what's going on... Thanks.
I guess if the correction is fast enough you might call it a mini-crash, but the next BIG Crash is still a couple of years off I believe. I'm looking for an early pullback in January/February and then a push back up into mid-summer, with July being the most likely month to top out in. What I'm looking for is a move similar to the 2011 drop that bottomed at 1101.54 SPX on August 8th, then bounced and made another lower low on October 3rd of 1074.77 which most elliottwave chartists call "Primary Wave 2" down with the current rally up since then being one very long Primary Wave 3 up.
So we are looking for a Primary Wave 4 down this year and it should be 20%+ if it's going to be similar to P2 down. This monthly chart tells us a lot from a technical point of view. We can clearly see the MACD's losing momentum and looking ready to go negative soon. How long it takes is just a guess but I think we'll have at least one month close down (probably this January) and then a few positive months into mid-summer before losing the zero line on that MACD chart. Possibly we tread along it for the first half of 2015 staying between zero and maybe +5 or so?
Looking at the rising channel we can see that lower blue line is coming in around 1750 which I believe we could very well see hit later this year. While it's possible that it breaks and we go down and hit the horizontal support level just under 1600 from the two prior tops in 2000 and 2007 I suspect they won't let it drop that far. Remember, there is very likely one more very larger "blow off top" rally coming (Primary Wave 5) that should top out in 2017 sometime... so I don't think they'll let the market collapse too far this year.
Medium Term Outlook
Clearly we have already started selling off this January as I write this post so that's no big surprise. Looking at the weekly chart we the MACD's going negative and price level still inside the rising wedge. Back in October of 2014 we seen the market breakdown through that lower trendline of support but rally back above it before the week closed out... saving the market once again from a much bigger collapse.
We notice now that the MA 40 is around 1974 on the SPX in this chart and that's just slightly above that lower support line on the rising wedge. So, if they plan on rallying up to new higher highs into mid-summer they need to hold that zone on a weekly close to avoid a bigger drop. However, the monthly chart looks much weaker this time around then back in October when they pierced it once, which leads me to speculate that the support line won't hold this time if it's broken. My guess is that we'll hold it on the first hit, then lose it later this month or early February after riding the support for a few weeks.
By letting the trendline break with a deeper correction they can then have a more sustainable up move afterwards. It would create a new channel and level of support for the bulls and give them the opportunity to rally into mid-summer to backtest the broken trendline on the current rising wedge, which would of course be at a much higher level by then.
This is the best scenario for the bulls I think as without a decent correction I just don't think they will be able to rally up to 2100-2200 like they want to do. Trying to stay inside that rising wedge all the way out to mid-summer (where I suspect we'll top at) will be a tough feat for the bulls... especially with the threat that Janet Yellen will speak of a future interest rate rising happening in the near future. While I don't know if they will actually raise it this year just the hint of it will be enough to scare the bulls and excite the bears.
As we all know the market rallies and sells off in front of any planned events and not when they actually happen. It's the old "sell the rumor, buy the news" saying that keeps the market always doing something today in anticipation of something in the future. This is why the market is always on edge every time the FED's release the minutes of the latest FOMC meetings.
So from a technical point of view, combined with the fear of some future interest rate hike, it won't be likely that the market can continue rising until mid-summer while staying inside that wedge. It's getting too bearish on the monthly chart now to support the weekly holding that lower support trendline. This is why I think it will break this time around and then rally back up later this year for the possible backtest.
The monthly chart has support from the MA 20 at 1868 area, which "could" be the zone that we'll see this January, February, or March before turning back up to rally hard looking for that higher high into mid-summer. If they don't allow the market to correct that far and instead manipulate it to stay inside the rising wedge on the weekly chart then I don't think we'll see much of a higher high into mid-summer. At that point I'll lower the odds of seeing 2200+ and forecast that we'll end somewhere in the 2100 area with a lot of sideways range bound trading between now and that top.
On the flip side if they allow the deeper correction then I'd expect to see 2200+ in mid-summer with a more steady rally happening along the way as opposed to the range bound wild swings up and down we've been having over the last several months. While this range is over a 100 points wide right now I think it will end if they just allow a bigger correction to happen... as therefore a more powerful rally can start. Failure to allow the correction means we'll likely see more of these wild and crazy moves up and down until summer while they try to stay inside that rising wedge.
Short Term
While it's been a very steady and controlled move down this week the daily chart is getting oversold and due for a bigger rally here soon then the one day (or intraday) moves we've recently had. The short term support is at the 200 day moving average around 1965, which could be hit this week if they are going to do a "flush out" move before bouncing. It lines up nicely with a double bottom area of 1972 from December 16th, 2014 which should add to the support as well. It's an obvious level that everyone see's and is currently acting like a magnet for the market, drawing it closer every day it seems.
However, we all know that when something it very well seen by the masses SkyNet will usually do the opposite so the sheep lose money again. So that "flush out" move to that zone should be tricky and fool the sheep so they get shaken out of their positions at a lost. How will SkyNet do it? That's a great question and one that I can't answer unfortunately.
It could gap down to that zone Thursday morning and reverse back up all day squeezing the bears that are expecting a crash, and continue that squeeze into Friday recovering a large amount of the move down, while making all those bears holding January 16th puts expire worthless and futures traders start buying back their shorts at a lost (which is how the bulls get these huge rallies in the first place).
Or they could just rally it up from the current level staying above that obvious target zone and pushing that thrust move down until next week or the week after. I'm thinking (guessing... speculating) that a nasty solid (or almost solid) red candle bar close on the weekly chart for this week isn't something they want to happen as it will then increase the odds of the following week tanking even deeper and breaking the 40 MA around 1974 on the weekly chart. Some how I get the feeling they will start a squeeze from the current levels (falling short of hitting the 200 DMA of 1965 and/or the double bottom of 1972) and save the move down lower for next week and/or the week after.
I think the 200 DMA will not be the short term bottom before a bigger bounce. It doesn't line up to me. I see SkyNet fooling the sheep with a break of that zone to a lower level. While I'm sure there will be a bounce from it as the big boys buy it I don't think it will hold as the low for them to rally up to new all time highs from. I think that we'll see a short lived bounce and then another push lower into the end of this month.
I'm guessing will bottom around the next Legatus meeting January 29th-31st, 2015... which also is the same time frame of another FOMC meeting (http://www.federalreserve.gov/monetarypolicy/fomccalendars.htm). Too much coincidence for me to think a big turn in the market won't happen during that time period. Therefore I think we'll bounce this week and hold the 40 MA on the weekly and the lower rising trendline on that rising wedge, and then over the next 2 weeks into the end of January we'll see a break of that line with a target zone of 1750, 1820, or 1868 being hit.
The 1750 estimate is from the monthly chart as that's where the lower trendline is on the rising channel. I give it low odds of hitting but it's still possible. The 1820 area is from the October 15th, 2014 low and would be of course create a double bottom. I give it medium odds of being hit. The 1868 level is from the 20 MA on the monthly chart and it makes the most sense too me of being hit due to the expected turn date zone of being at the end of this month.
It would also fool a lot of sheep that (once at that zone level) would naturally be staying short expecting to exit and go long at the double bottom of 1820... which brings us back to the current market level today as being in a similar zone of just 20-40 points shy of another expected double bottom where the sheep would again want to exit their shorts and go long. Since SkyNet's job is to steal the money from the sheep I find it unlike to be hit this week as I previously suggested.
It's all about mis-direction as you know. Anything too obvious to happen simply won't happen... at least not when everyone is expecting it to happen. Therefore I'm looking to be fooled as that's SkyNet's only way to profit... and it does it very well. After we rally up next week to get everyone bullish again we'll be looking for the sell off to continue into the Legatus/FOMC date zone.
Here’s the previous notes that I posted back in January…
2014 will be a magic year (meaning what? will you pull a rabbit out your hat? will you steal money from the sheep without them seeing you do it?)
100th anniversary of the first world war in 1914 (strangely when I researched what happened to the DOW back then it was closed down for several months due to the first world war starting. are we expecting the same here? REFERENCE: http://www.ritholtz.com/blog/2013/02/most-long-term-charts-of-djia-are-wrong, http://measuringworth.com/DJA, https://www.globalfinancialdata.com/gfdblog/?p=1426 )
70th anniversary of the Bretton Woods Conference that gave birth to the IMF. (The delegates deliberated during 1–22 July 1944, and signed the Agreement on its final day. REFERENCE: https://www.google.com/search?q=first+bretton+woods+conference+date&ie=utf-8&oe=utf-8&aq=t&rls=org.mozilla:en-US:official&client=firefox-a&channel=fflb Not sure what the hidden message was here?)
25th anniversary of the fall of the Berlin wall (Destruction date: November 9, 1989… but what is she hinting at here? Is the “buzz word” the “25th”or the “fall”? Does the 25th mean a certain future date or does the word “fall” indicate that the market will fall hard?)
7th anniversary of the financial market jitters. (again with the focus on the number 7… meaning what? are we looking for another move down similar to 2008?)
The crisis still lingers… (clearly this means we are going down again)
It will not happen randomly… (of course not, it’s always planned)
“Global growth is still stuck in low gear” (Hmmm… just a fall guy to blame I guess? We tank and it’s the fault of slowing global growth)
It will not be without downside risks, and significant ones (referring to inflation… or was it really meant to refer to the stock market?)
We are seeing rising risks of deflation… (good for us sheep but bad for them)
Global growth slowing down as the economy cycle turns… (the “buzz word” that stands out to me there is “cycle turns”)
Risk of capital runs… (You really mean the gangsters are moving their money out the market before the collapse)
Dry run back in May of 2013… (Ah yes, the old test where Bernanke hinted at pulling money out the market last year)
There could still be some rough waters ahead of us… (another clear warning that they plan on taking the market down)
Overall, the direction is positive (meaning after the downturn the market we’ll go back up again, which should be a final Primary Wave 5 up with this coming correction next month being a nasty Primary Wave 4 down)
95% of the income growth went to the top 1% (Duh… nothing new there as that was always the plan! Steal from the sheep and give to the wolves)
Tapering will have too be very well timed… (again, she’s clearly staying that we are going to withdraw money from the market)
Central banks will have to “undo” what they’ve done… (and again, more references to cutting back the stimulus?)
Removing the threat of the debt ceiling… (meaning what? They won’t set one, or make it unlimited? I don’t know what she means with this sentence?)
A stress test will be done in 2014… (Why? You already know the banks would all fail. I guess they have to blame the correction on something)
I give the odds of a big correction at 95% and a full blown crash of about 50% for 2014...
In the past 3 years all we've seen are these small 4-6% corrections and many people think that's all we are going to have this time around too. They see the market at or near the 200dma and think it will bounce and go back up to new all time highs again. But will this time be different? I think so. Why you ask? One simple answer: "The weekly rising trendline of support final broke down last week and closed below it".
It's been having these small corrections since the 2011 low and bouncing off of that trendline every single time. It's been great support for the last 3 years but it's finally failed. This is the first signs of the end for the bull market since the 2009 low. While I'm sure there will be one more final rally to retest the current high, (which should start this December, 2014 and carry into early 2015) the current trend is down and we should not assume that this correction has ended yet.
My estimate is that we'll see the mid-1700's on SPX by the end of November before the Christmas rally begins. I suspect the Full Stochastic will be bottomed in the 20's on the chart above by that time and allow a relief rally. The MACD's should be close to the zero line as well, where other bottoms form and allow a bounce. Once that rally starts it should last all of December (of course) and carry into the early part of 2015.
It's hard too know how long the rally will last as it could be only 3-4 months or 3 years? It is called a Primary Wave 5 up in Elliottwave terms by others (Tony Caldaro) that do a lot better job of tracking wave then I do. It only has to have a higher high then the current high of 2019 SPX to be a successful Primary Wave 5 up. It could simply go to 2020 in 3-4 months or extend for 3 years to 3000 or more? There is no way to know what the government will do to try and extend the market but we can speculate based on the past.
What could cause an extend Primary Wave 5 up... QE4, QE5, and QE6?
I don't know the answer there but I'll say that "in my opinion" the QE programs have exhausted themselves and won't work to prop up the pig from here on forward. This pig of a stock market is much too heavy now with unsustainable debts world wide. It's like giving a dying patient a fourth, fifth and sixth round of chemo and radiation treatments with triple the morphine. It might have helped keep the pig alive in 2009 but this pig is dying and no amount of stimulus is likely to work this time around.
What does that leave for the government to do? I don't have a clue? You can see in the monthly chart below how we should have crashed in the last few years but were saved by QE Infinity (also known as QE3 [quantitative easing]}. Looking at the 2011 to 2013 period you'll see the market go from 1400 area to 1100 and stop, then rebound back up again creating the rising channel we see now. Now look at the ROC (rate of change) during that same period. It's hovering on the zero line for almost 2 years trying not to fall below.
When you compare it to the level the MACD's were at during that period, and then look back to the 2007 top to see the comparisons you would have thought the market would have crashed but the government intervened with the largest QE program ever... "to infinity and beyond as Buzz Bernanke would say"! It looked perfect for another HUGE "wipeout" crash at that time from a technical point of view.
You have the 2000 high with MACD's up in the 120-130's, then a lower MACD high in 2007 in the 60-70's, with the 2011-2013 zone peaking in the 50's creating a triple negative divergence on the Monthly chart. Clearly the market "should" have crashed then, but the Fed's intervened with QE Infinity. Now they have successfully manipulated the stock market up to historically levels. The MACD has never been higher in history (from what I read someone else).
What's all this mean you ask?
To me it says the likelihood of a "Full Blown Stock Market Crash" like 1929 is VERY likely to happen between 2015 and 2017. The biggest drop will likely happen in 2015 I think as I really doubt if we'll make some extended Primary Wave 5 up that last for 3 years or so with upside targets of 3000 or more. I'm more inclined to seeing a December 2014 rally that will look similar to rally May, 2008 that simply made a lower high and then crashed the rest of the year. This suggests that we'll top out in January, 2015 and then drop all year.
If the market goes down to the 1700's area where the lower trendline of support is on the monthly chart then that's the scenario I see happening... just a one month Christmas Santa Claus rally to make a lower high in January and then a crash. If however the market only goes down to the 20ma around 1795.47 on the monthly chart then there's a possibility that we'll rally back up to make a "slightly" higher high in early January to hit a "possible" FP (fake print) I spotted on the SPY back on September 19th, 2014 showing 202.45 as an intraday high. Since we never went that high that day it's "possible" that it's a FP signal to the insiders that know how to read it, which "could" indicate the final top in early January, 2015 after this correction is over with and the P5 (primary wave 5) rally starts.
It could be nothing of course... or a "real" FP telling insiders the final high for P5?
Let's talk about the rituals for minute now...
Yes, it's that time of year again when all the elite satan worshiping gangsters meet in secret (but right in front of you... if you are looking?). Of course I'm talking about Legatus, where we find every snake of importance in the world going to so they can find out the latest information on how the super elite gangsters (the true Reptilians) play to screw the sheep (that's you and me).
Their October meeting is going on now as it started on October 8th and ends this coming Friday October 17th, 2014. I've done many posts in the past about the importance of these meetings and how the gangsters like to "turn" the stock market before, during, or just after one of these meetings end (http://reddragonleo.com/2013/02/03/the-law-of-equilibrium-and-past-history-with-legatus-and-turns-in-the-stock-market). I called a very important top on May 22nd, 2013 primarily based on a Legatus meeting during that period, along with technical analysis and numerology. That date added up to a 33 when adding all the numbers in it leaving 22 as a whole since it's a master number.
Point being is that the gangsters commonly have "turns" in the market around these meetings and they use numerology to pick dates. Having this meeting going on right now and ending this coming Friday tells me it's likely to be some type of bounce back up wave to retrace possibly 50% of the entire down move from 2019 to whatever the low is... which I suspect will happen Monday around the 1900 area (+/- 10 points). So "if" we bottom at say 1890 SPX this week we could "should" retrace back up about 50% of the move down.
Speculating here but if we dropped from 2019 to 1890 then we about 129 points and half of that is about 65 points. So we should bounce to about 1955 area before we have the really big drop start. I think we'll hit that level by this coming Friday but it could go up a little more the following Monday to some other Fibonacci level like 61.8%, or 79 points from the 1890 low... meaning 1969 is possible. First of course we have to find the low to calculate from... which should happen early this week. Then we can guess on the upside target...
Usually high levels of open interest in the Puts for October 17th expiration...
Since I like to trade options I'm commonly looking at the various strike prices, open interest, levels, days to expire, etc... and one of the things I mentioned a few weeks back in a comment and tweet was the very high level of puts in the 190 and 195 strike prices. On could imply that it's insiders buying them up as they know the market is going to fall below that level. But that's not usually the case. Most of the time it's just speculators that may or may not have seen the down move coming and loaded up short. However, from my experience the "market makers" will manipulate the market back up above the highest open interest levels to make those puts expire worthless.
So will this time be different? Maybe? I just don't know? Normally I'd expect to see 50,000 to 100,000 contracts on any given even number strike price and less then that on the odd prices with the .5's on the end but having 556,194 contracts at the 190 strike price is at least 5 times the normal amount I'm used too seeing. Then the 195's have 237,554 on them, which tells me the market makers will have to do a whole of digging in their pockets to pay out those put holders if they allow it close below 195 SPY (about 1950 SPX) this coming Friday the 17th. I can tell you that these guys are similar to card dealers in Vegas and will lose their job if too many people win at their table. So you tell me what you think they will do? I think they will rally the market up to make them expire worthless. In Vegas some manager would come out and have the dealer move to another table to break up the winning streak.
Of course there's no way to know for sure if the "insiders" are actually the one's that are short and know that the market is going down below there by Friday the 17th but certainly we'd expect to see a lot of wild swing "shakeouts" for the retail sheep holding puts. Then after the market makers sure up their positions they "could" let the market collapse late Friday after most of those puts holders have giving up and sold out at a lose. Anyway, I'm looking for some kind of rally this week as everything tells me we are oversold short term and due a nice rally.
But after the rally we should expect another HUGE drop the following weeks into the end of November. I'm looking for that rising trendline of support to be the low are before a bounce, which appears to be around the low 1,700's. If it's only a shallow sell off then the 20ma on the monthly chart "could" stop the fall, which is just under 1800 SPX. I'm unsure which will happen but leaning toward the lower target just based on the charts and how many weeks we have left before the end of November when I'm expecting a bottom to happen.
After that we get a Santa Rally I guess...
Red
P.S. Let's keep an eye on the Fed's Outright Treasury Coupon Purchases too as they can add to the extreme volitalite as they try to save the market from collapse on these days.
I delayed writing this post for over a week as I just didn't think it was going to happen. Past history shows that every time we sheep hear something on the internet that is supposed to happen, and therefore we short the stock market, we end up getting screwed when the market rallies and the event date passes with nothing much happening.
But... is this time different?
I really wish I knew the answer there but I don't? The last 5 years have been a huge learning experience for me personally as I only started this blog to post my own thoughts about where the stock market was going to next. I never decided to take the "red pill" and become a conspiracy blog poster. In fact I never would have went down the rabbit hole if I hadn't seen my first FP (fake print) back on January 11th, 2010 showing a 97 point drop in the SPX that day when it really only traded in a 5 point range or so.
That lead me down the path to learning that the stock was 100% rigged... and always has been rigged since it was created many, many years ago. It's designed to steal money from the average long term investor sheep that doesn't trade the market everyday but puts in his or her savings into a 401k plan with the hopes of having a nice nest egg to retire on one day.
The gangsters the run the market (they are called the Illuminati, the Cabal, the Free Masons, but they are all the same) created this system so they could use these sheeps' money to pay for large projects they build in other countries where they find cheap labor to replace the current labor force in the current country. Meaning that they have the sheep in a country like America pay to have their jobs replaced by cheaper labor in a third world country.
Basically they crash the stock market from time to time to steal that money to pay for the building of the infrastructure of that third world country. The money they steal from the sheep from their retirement plans being cut in half goes to pay for the final outsourcing of the sheeps' jobs to that third world country. So when you hear a president come on TV and say that he is going to help "level the playing field" by creating jobs in one of those countries you now know that he simply means that he plans on replacing your high dollar job with someone cheaper.
The last stock market crash in 2008 was done to pay for the infrastructure of India...
The next stock market crash will be done to pay the infrastructure of another third world country that has even cheaper labor then America or India does. People there work for a dollar a day I'm told... which means that the gangsters that control the world can put a lot more money in their pocket by paying those people the pay YOU!
If you think they will replace you with a machine or robot you're wrong! You'll be replaced with another human that is less educated then you and will work for far less then you currently make. The biggest "outsourcing" of YOU is scheduled to be completed in 2017... which means you can expect a HUGE Stock Market Crash to start that year as it's the LARGEST project ever built, and that means it will be this biggest crash since 1929 as well.
But I'm getting off topic hear aren't I?
Sorry, but one of the things I always do is just write whatever comes to mind at the time. That means I go off topic from time to time as the thoughts just pour into my head. In fact, I never script anything or go back and change any videos. If I screw up in something I said I just keep on talking and post it anyway. Going back and editing out the "hmmm's and uh's" is a waste of time as I'm just as human as you are and make ton's of mistakes.
One of those is the penny stock newsletter. While I'm still struggling to understand this game so I can help all of you make money from it my partner and I are frustrated with alerts we've sent out. All the recent companies we've researched thoroughly and know that they all have huge potential. But it seems that they can't seem to get going to the upside even when a lot of other groups also see the potential and alert their members too.
However, that's another story. I don't have time to go into details about it now as I've got to tell you about what I see happening the stock market right now. Meaning that this Christine Lagarde video is something I must cover again. While I did a post on it back in January (http://reddragonleo.com/2014/01/20/when-will-the-stock-market-bubble-burst), and even though the date I forecasted back then was wrong the video itself is something worth revisiting.
I know that in the past 5 years I've gotten caught up in this "red pill" stuff and went short the market based on it... only to see the market rally and kill my position, some how this time "could" really be different? While I don't have a crystal ball I will say that I've never actually heard one of the gangsters (the elite... as in, Christine Lagarde) publicly say something that pointed to an "event happening" and a "date" for it. Truly this is a first... at least for me!
I'm probably 100% wrong on this call as I feel I'm the only person bearish right now...
Here's my thoughts... Lagarde is telling the truth as she is clearing saying that we are going to experience a big correction in the market this year. Why? Because it's a "magical year" as she clearly pointed out how important the number 7 is to the elite. The question is... what is the date she is talking about? And what is it that is planned to happen? Will it be a "Global Current Reset" as Lindsey Williams said will happen, or will it just be some other reason for them to tank the stock market? I don't know "what" the event is but the date does seem to be set in July of 2014 as 2+0+1+4=7 and July is the 7th month. The only thing left is the date of the month... which the 7th, 16th, and 25th all equal a 7, but which one? When combined with the month and year you'll have "magical" 777 day!
I'm speculating that it's on the 16th because of this Bradley turn date that peaks on the 16th...
Now of course I could be off and the date could be the 25th, but I must admit that "if" we some how put in high, low, open or closing price on Wednesday the 16th (a 777 day) of 1977.77 SPX or 197.77 SPY I'd be extremely excited about shorting the market as that would be a signal to the "Illuminated Ones" (which I'm not one of but trying to figure out their signals) that the top was in. Most people don't remember August 25th, 1987 other then that was the high for the year of 1987 but the crash was of course on "Black Monday" October 19th, 1987.
However, on that date the SPX put in an intraday high of 337.88... which the 88 is of course a master number meaning "11", but more importantly was the "not noticed" (except by the "Illuminated Assholes") intraday low of... [insert drum roll here] 333.33! YES, they put a clear signal that the top was in that day! Did you see it or know it? Not likely... in fact I only noticed it about a year ago after I started added numerology in my day to day chart analysis. Does it mean any? You tell me... does the March 6th, 2009 low of 666 mean anything?
Maybe I'm totally nuts and ritual numbers in the market are just random events, or maybe the market really is run by vampires called "reptilian shape-shifter"? People believed in demons centuries ago but modern man doesn't seem to think stuff like this is real... why? If they were real back then what makes you think that they some how disappeared today? If they ruled the sheep back then why shouldn't they still be ruling the sheep now? They just go underground (so to speak) and hide from the public, but they still run the show. In fact, the oldest vampires are probably in the Rothschild family and are the one's responsible for shooting down that plane in Malaysia. There was a team of 4 Chinese inventors that held a patent for 80% (20% between each of them) for something still unknown, with FreeScale Semiconductor owning the remaining 20% of the invention.
Now the interesting thing is that FreeScale is owned by the group building the new infrastructure (to eliminate YOUR job) which is called the Blackstone Group. And Blackstone is own by the Rothschild vampires... so do the math! They shot down the plane to get 100% of the patent as the legal contract stated that in the event of one of the parties dying the remaining percentage of would be split among the surviving members. Therefore, if you kill 4 people that own 80% of the patent the remaining company called FreeScale would then get all of that and own 100%, not the original 20% (nothing new here as the same vampires sunk the Titanic too, but that's another story).
Getting back on track again...
Again, I must apology as I sometimes just drift onto subjects that are off topic and I'm sure you don't care about that other stuff and just want and update on the stock market so you can make money from it. My thoughts have been simple really... a ritual number should but put in on Wednesday the 16th of 2014 to indicate that an important top is it. My "human side" tells me that they will take the market higher but recently I've been "talking to myself... LOL" for a lack of understanding and I've been told to short on Wednesday and that it would be a very important top... and that this Lagarde thing is real.
Personally I don't believe my "inter-voice" yet, as I've only recently (the last 2 weeks) been talking to it (yeah, if you didn't already think I was crazy you do now). I mean, come on now... I'll be 50 years old (although I look much, much younger... probably the blue eyes and blonde hair) this coming August 10th, 2014 (yes, I was born the year of the dragon in 1964 and the month of Leo... hence the name of this site) and I have to say that I feel like I'm only 30 years old. Crazy huh? It's probably because I never got married or had any kids to stress me out... LOL!
Anyway, this voice in my head has told me 4 correct calls in a row and I took 3 of them to make a bunch of money. I didn't take the Monday the 7th call was to get short within the first 30 minutes on the expect bounce. Needless to say I was dumb for missing out on that call and not listening to my inter-voice. I did listen and I placed a short on the 9th right at the last 30 minutes of the day. I think I tripled my money on that call (it was a put spread that expired that week... very risky). Then I went long at the bottom (missed it by a 1-2 points) on 7-10 as my inter-voice told me to sell and go long into this coming Wednesday the 16th.
However, stupid me closed out my call spread on Friday before Monday's rally up. So while I still made about 40% gain I could have made about 80% if I had listened to myself telling me what to do. This voice tells me to short the crap out of Wednesday's move with the expected high to happen by the noon time hour. I can't explain it but I've made a bunch of money on taking the 3 of 4 of these predictions with all 4 of them being correct. It's hard from me to believe that suddenly I've been in contact with my immortal soul (or directly with God himself/herself... LOL) but I've prayed about it months now. I really wanted to connect with myself through my pineal gland like all the gangsters do to connect to Satan.
But while others have been able to see visions and stuff I've seen nothing. I still see nothing. I'm probably nuts for even posting this publicly but myself tells me to do it... LOL! Well, there's nothing like pouring out your heart publicly I guess. So I'll just say again that I strongly believe tomorrow is an important day to take a short position. I don't know if there is going to be a "Global Currency Reset" like many think will happen (and Christine Lagarde hints at without saying directly) but the charts are very bearish and even without such an event we should be in a short position.
Here's the previous notes that I posted back in January...
2014 will be a magic year (meaning what? will you pull a rabbit out your hat? will you steal money from the sheep without them seeing you do it?)
100th anniversary of the first world war in 1914 (strangely when I researched what happened to the DOW back then it was closed down for several months due to the first world war starting. are we expecting the same here? REFERENCE: http://www.ritholtz.com/blog/2013/02/most-long-term-charts-of-djia-are-wrong, http://measuringworth.com/DJA, https://www.globalfinancialdata.com/gfdblog/?p=1426 )
70th anniversary of the Bretton Woods Conference that gave birth to the IMF. (The delegates deliberated during 1–22 July 1944, and signed the Agreement on its final day. REFERENCE: https://www.google.com/search?q=first+bretton+woods+conference+date&ie=utf-8&oe=utf-8&aq=t&rls=org.mozilla:en-US:official&client=firefox-a&channel=fflb Not sure what the hidden message was here?)
25th anniversary of the fall of the Berlin wall (Destruction date: November 9, 1989… but what is she hinting at here? Is the “buzz word” the “25th”or the “fall”? Does the 25th mean a certain future date or does the word “fall” indicate that the market will fall hard?)
7th anniversary of the financial market jitters. (again with the focus on the number 7… meaning what? are we looking for another move down similar to 2008?)
The crisis still lingers… (clearly this means we are going down again)
It will not happen randomly… (of course not, it’s always planned)
“Global growth is still stuck in low gear” (Hmmm… just a fall guy to blame I guess? We tank and it’s the fault of slowing global growth)
It will not be without downside risks, and significant ones (referring to inflation… or was it really meant to refer to the stock market?)
We are seeing rising risks of deflation… (good for us sheep but bad for them)
Global growth slowing down as the economy cycle turns… (the “buzz word” that stands out to me there is “cycle turns”)
Risk of capital runs… (You really mean the gangsters are moving their money out the market before the collapse)
Dry run back in May of 2013… (Ah yes, the old test where Bernanke hinted at pulling money out the market last year)
There could still be some rough waters ahead of us… (another clear warning that they plan on taking the market down)
Overall, the direction is positive (meaning after the downturn the market we’ll go back up again, which should be a final Primary Wave 5 up with this coming correction next month being a nasty Primary Wave 4 down)
95% of the income growth went to the top 1% (Duh… nothing new there as that was always the plan! Steal from the sheep and give to the wolves)
Tapering will have too be very well timed… (again, she’s clearly staying that we are going to withdraw money from the market)
Central banks will have to “undo” what they’ve done… (and again, more references to cutting back the stimulus?)
Removing the threat of the debt ceiling… (meaning what? They won’t set one, or make it unlimited? I don’t know what she means with this sentence?)
A stress test will be done in 2014… (Why? You already know the banks would all fail. I guess they have to blame the correction on something)
I'll point out that unless you are truly one of the elite it's not obvious to the date of the event or the actual event itself. It's only obvious that we are in for some rough waters in this magical year of 2014. Does that mean we tank in the stock market? Does that mean we have a global currency reset? I just don't know the answers there but I sure do think this market is ready to take a nose dive. So assuming we don't gap up 10+ points on the 16th I'll be looking for some ritual number (like 1977.77 SPX or 197.77 SPY) to be hit early on which I'll be shorting for a ride down to 1900-1920 SPX area in the coming weeks (or less?).


 Elevate


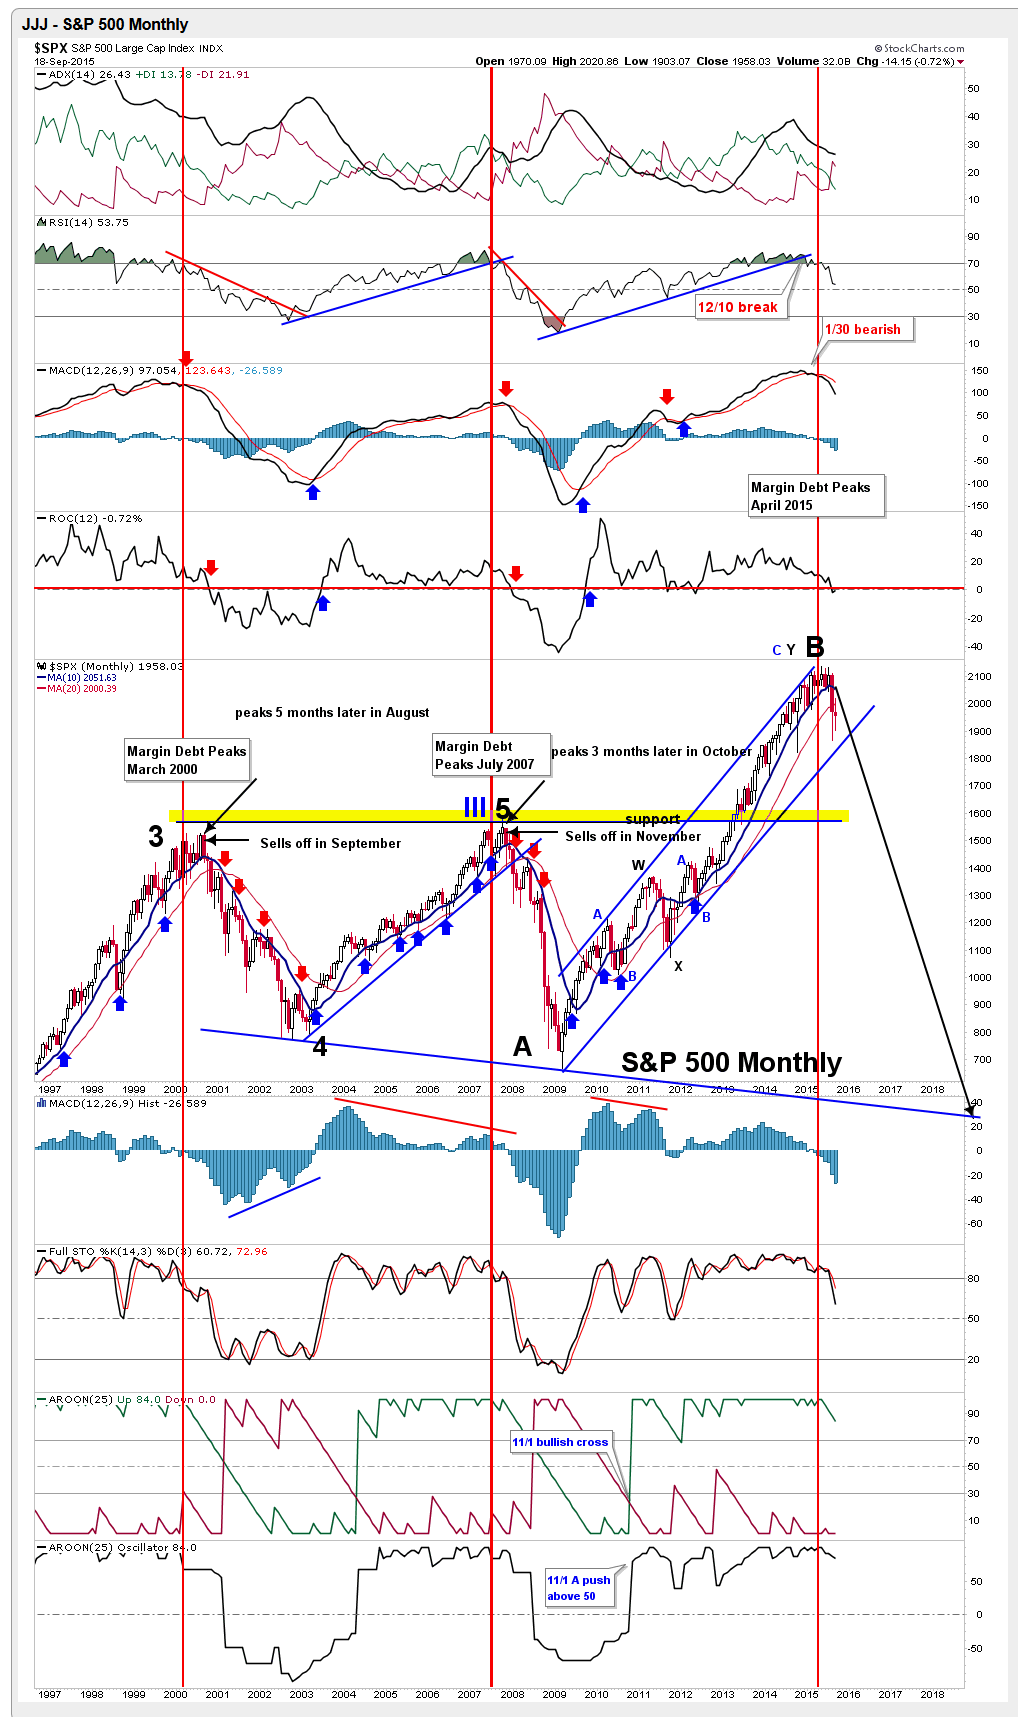


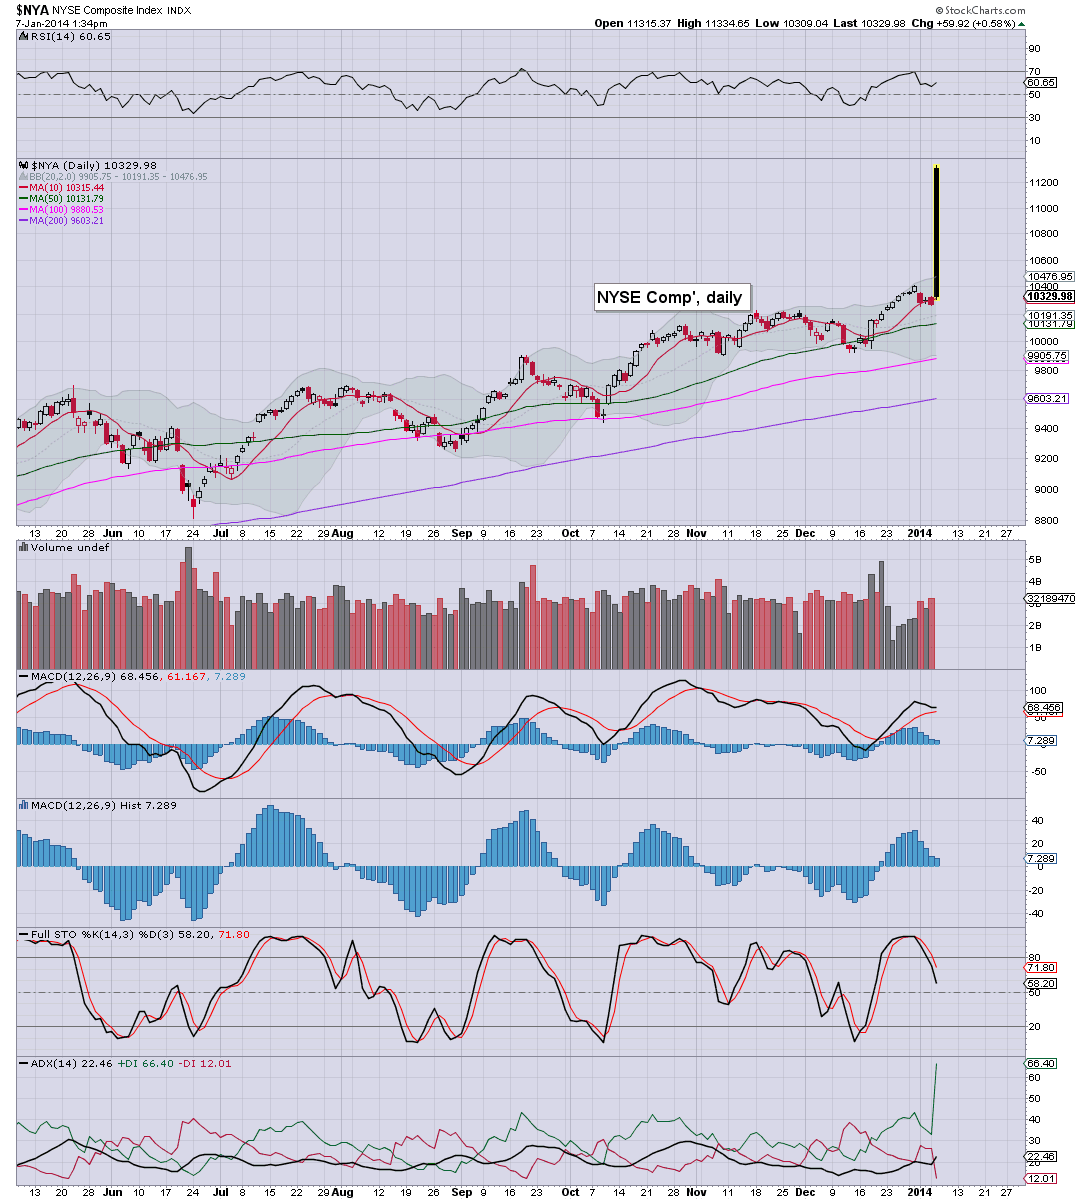
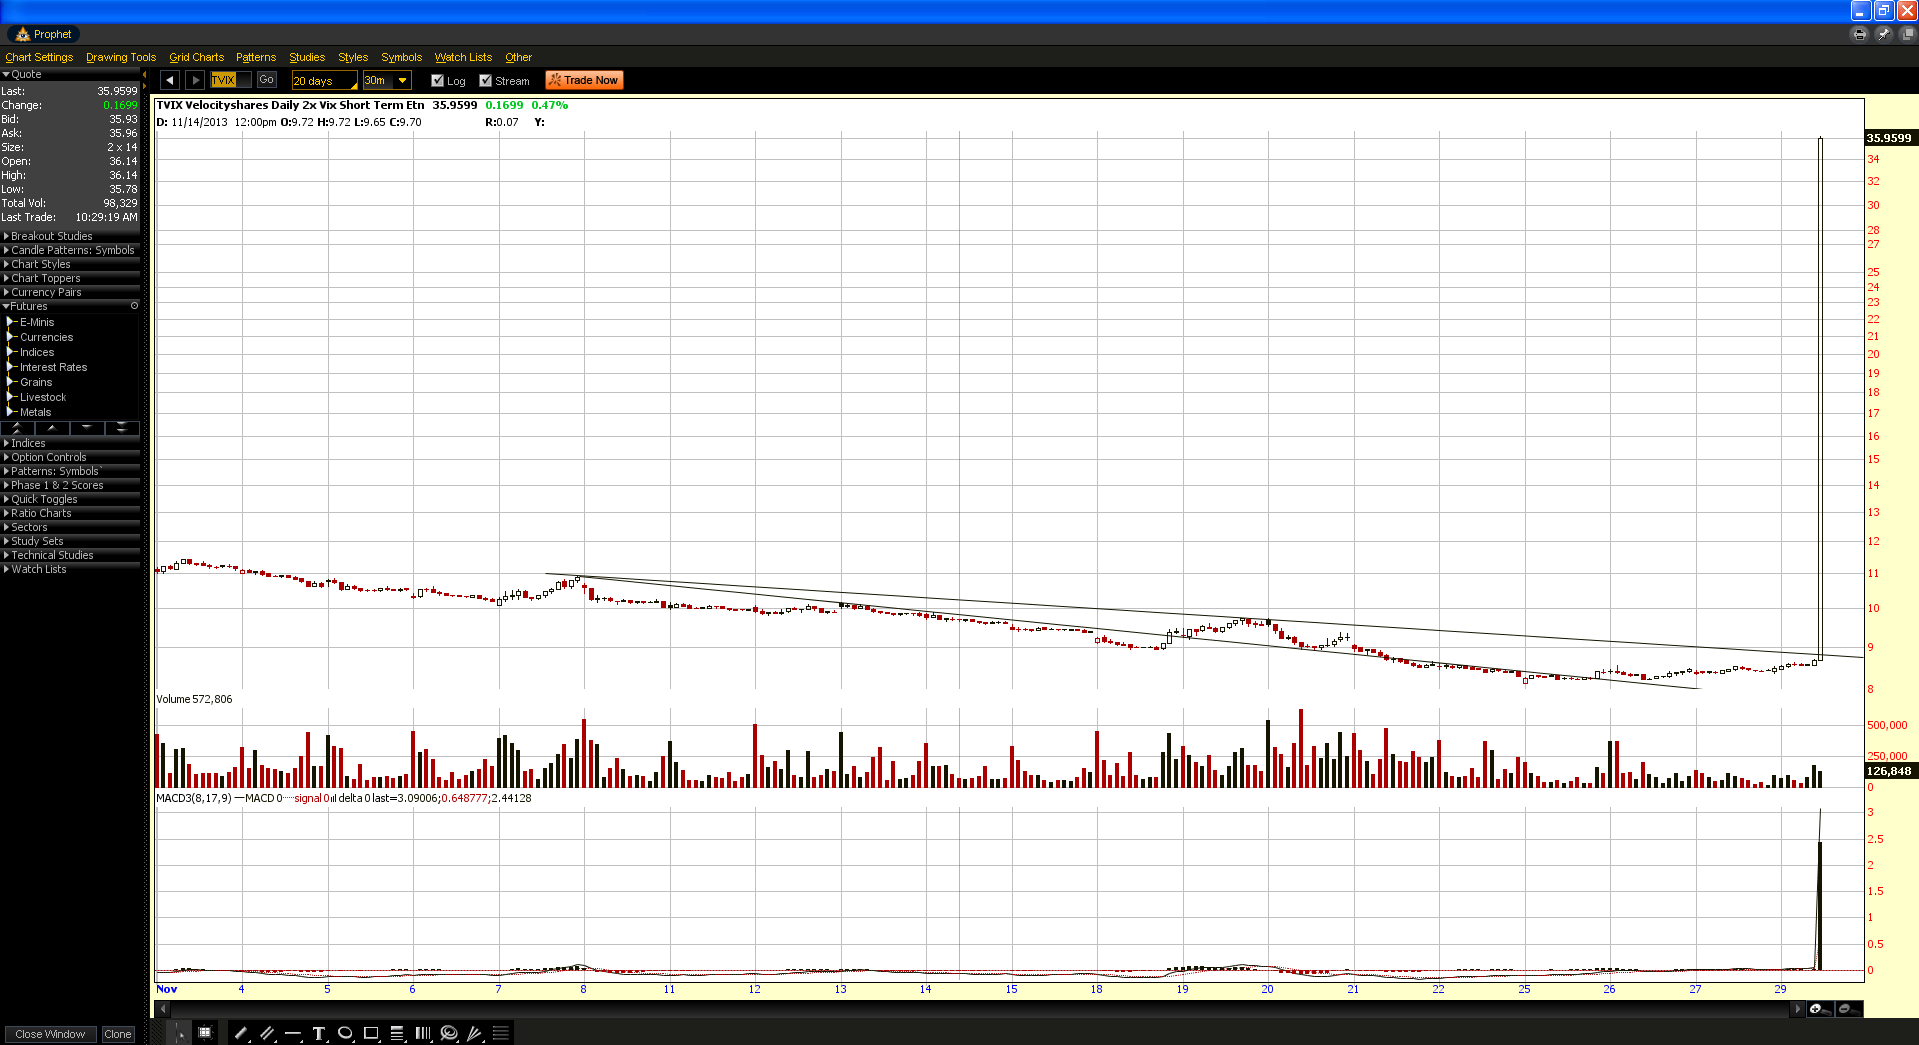
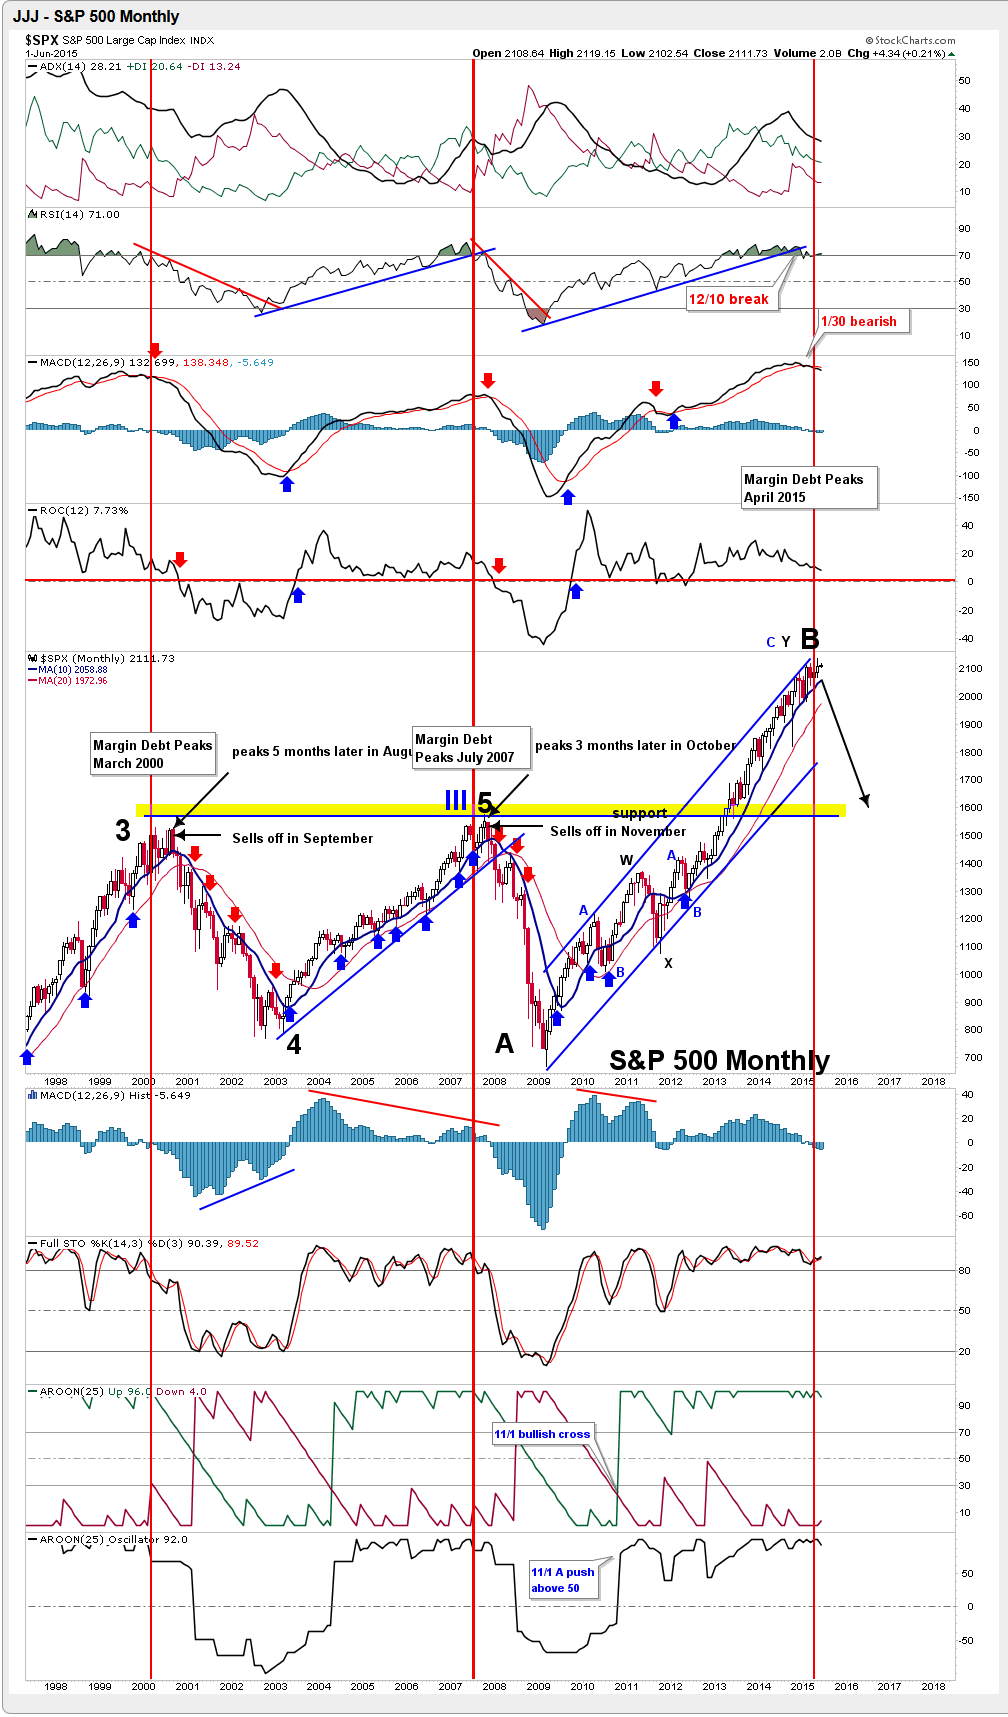
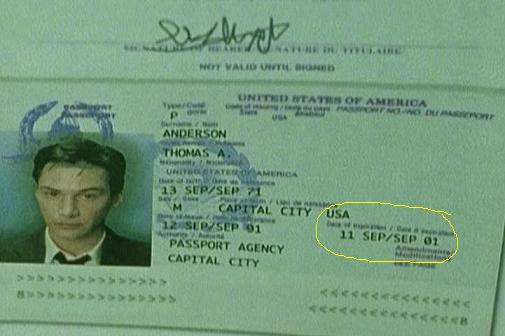
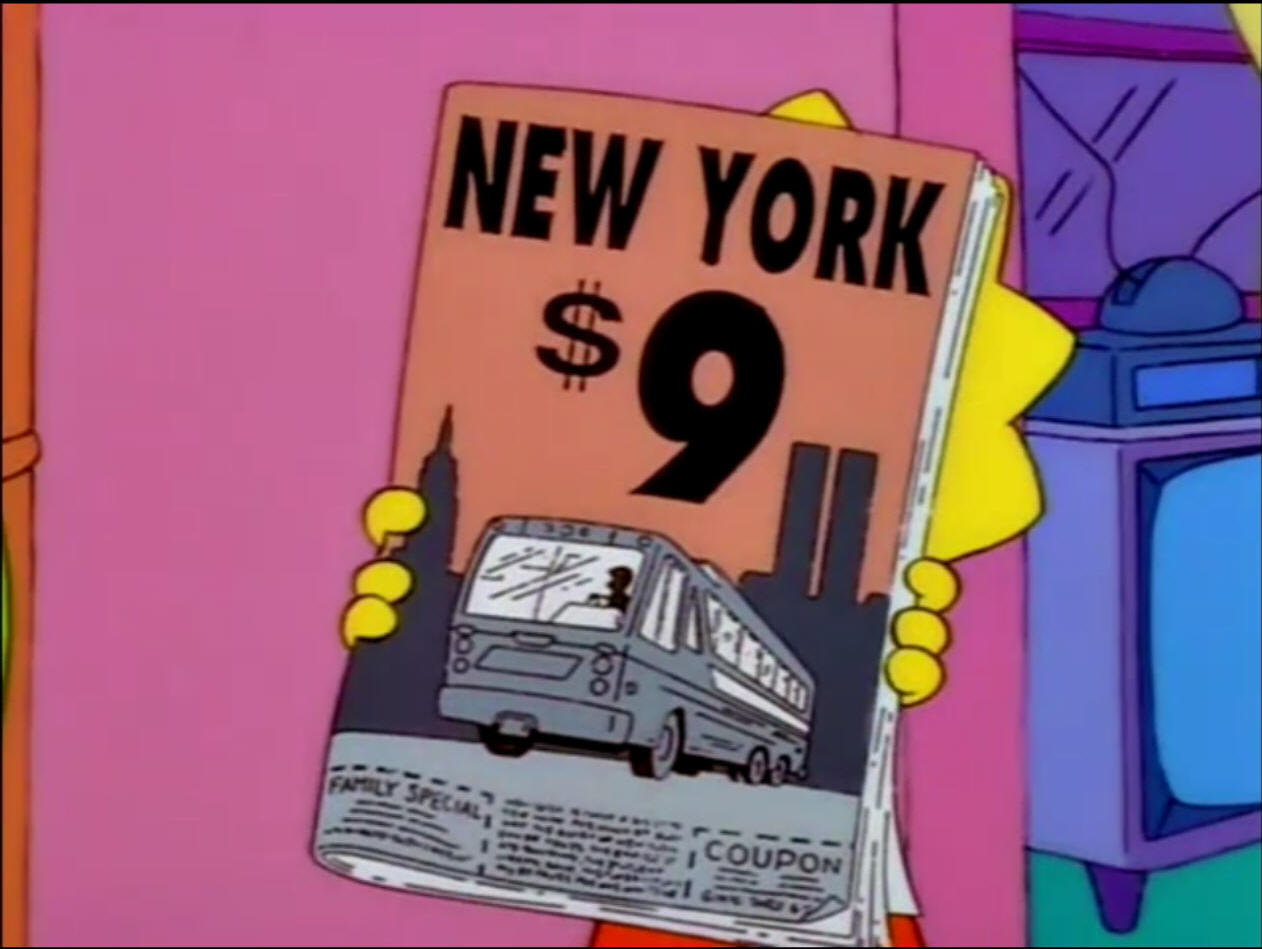
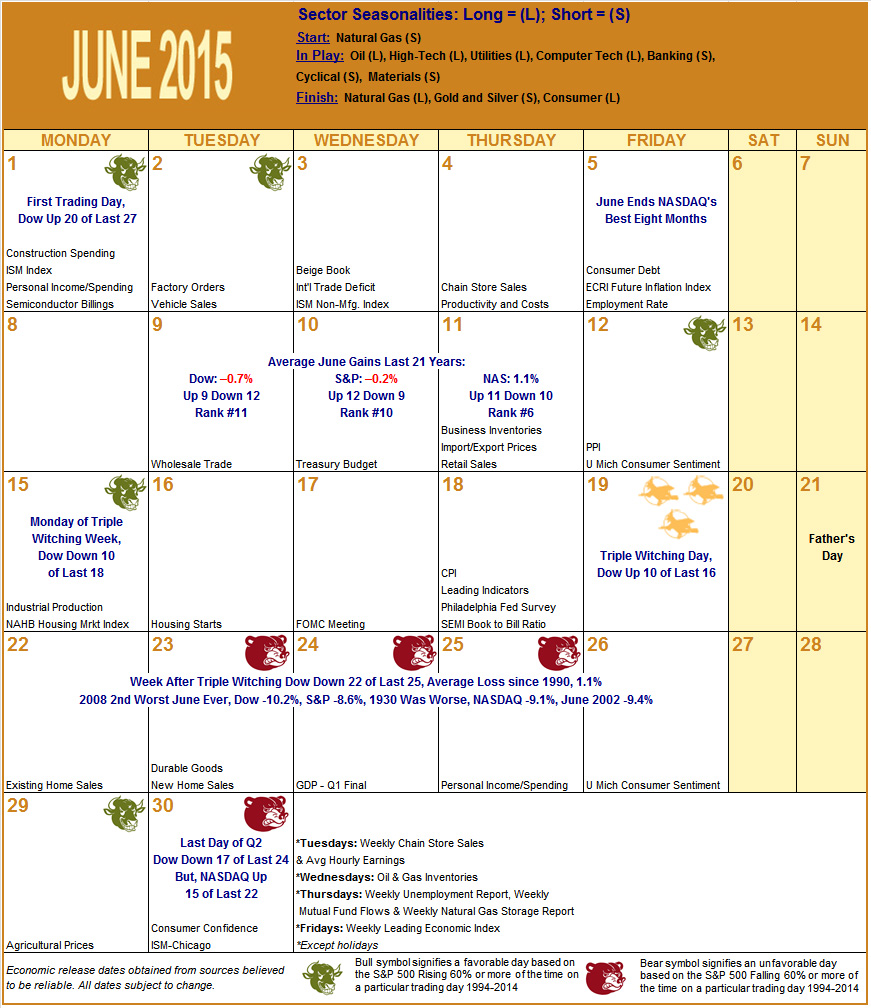

 Chad Gassaway, CMT