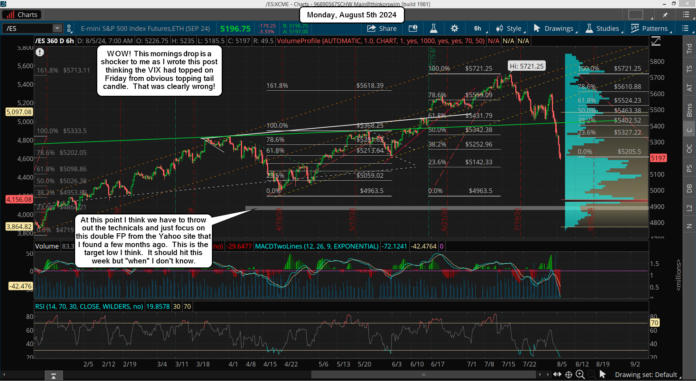
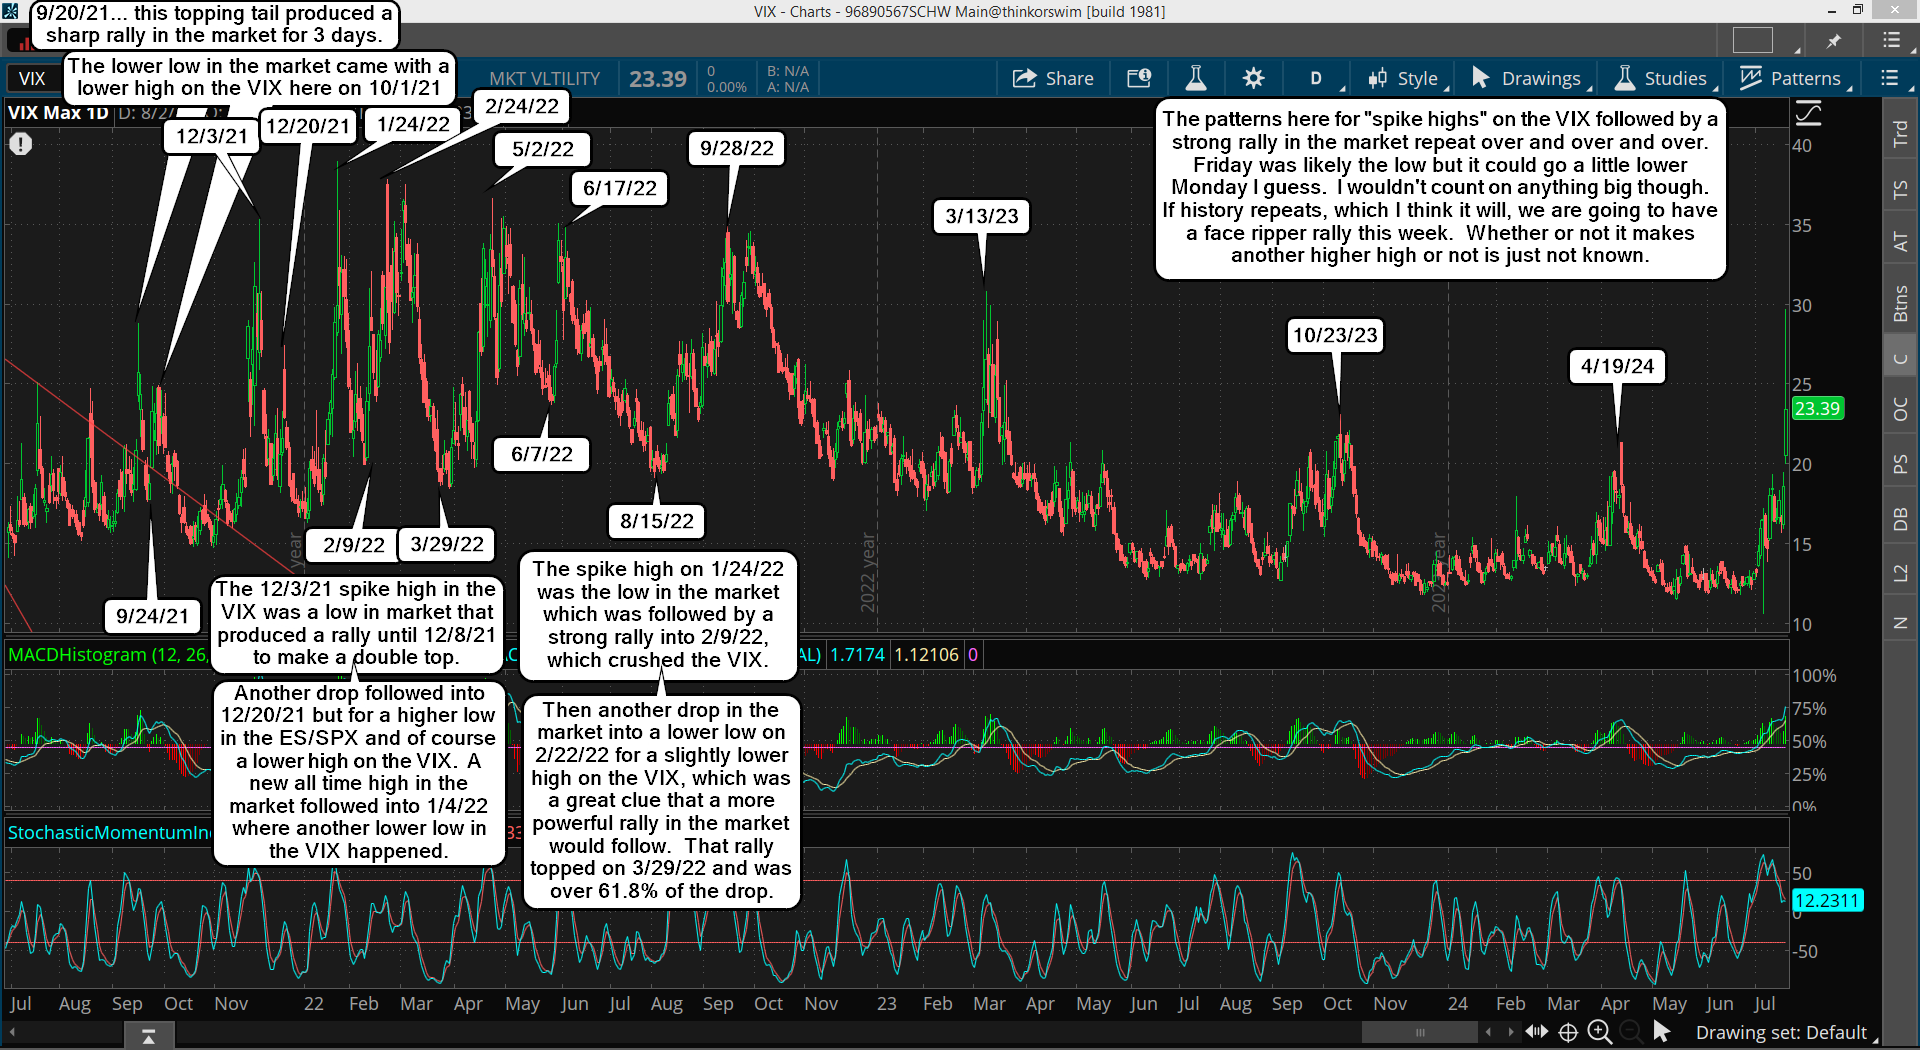
Friday's nasty drop looks and feels like a capitulation move to me. The VIX almost hit 30 but closed at 23.39, which left a nice topping tail candle on it. I doubt if there's much more to go on the downside for the market (if any) as many indicators tell me a low is near. If Monday goes a little lower it's just the last buying opportunity in my opinion. Here's that VIX chart...
As you can see on the VIX chart every time in the past that we saw a topping tail spike happen it was followed by a strong rally that lasted for many days. Do I think that means a new high is coming? Probably not as there's still a lot of bearish pressure on the market from the weekly chart, but a sharp multi-day squeeze seems likely this week.
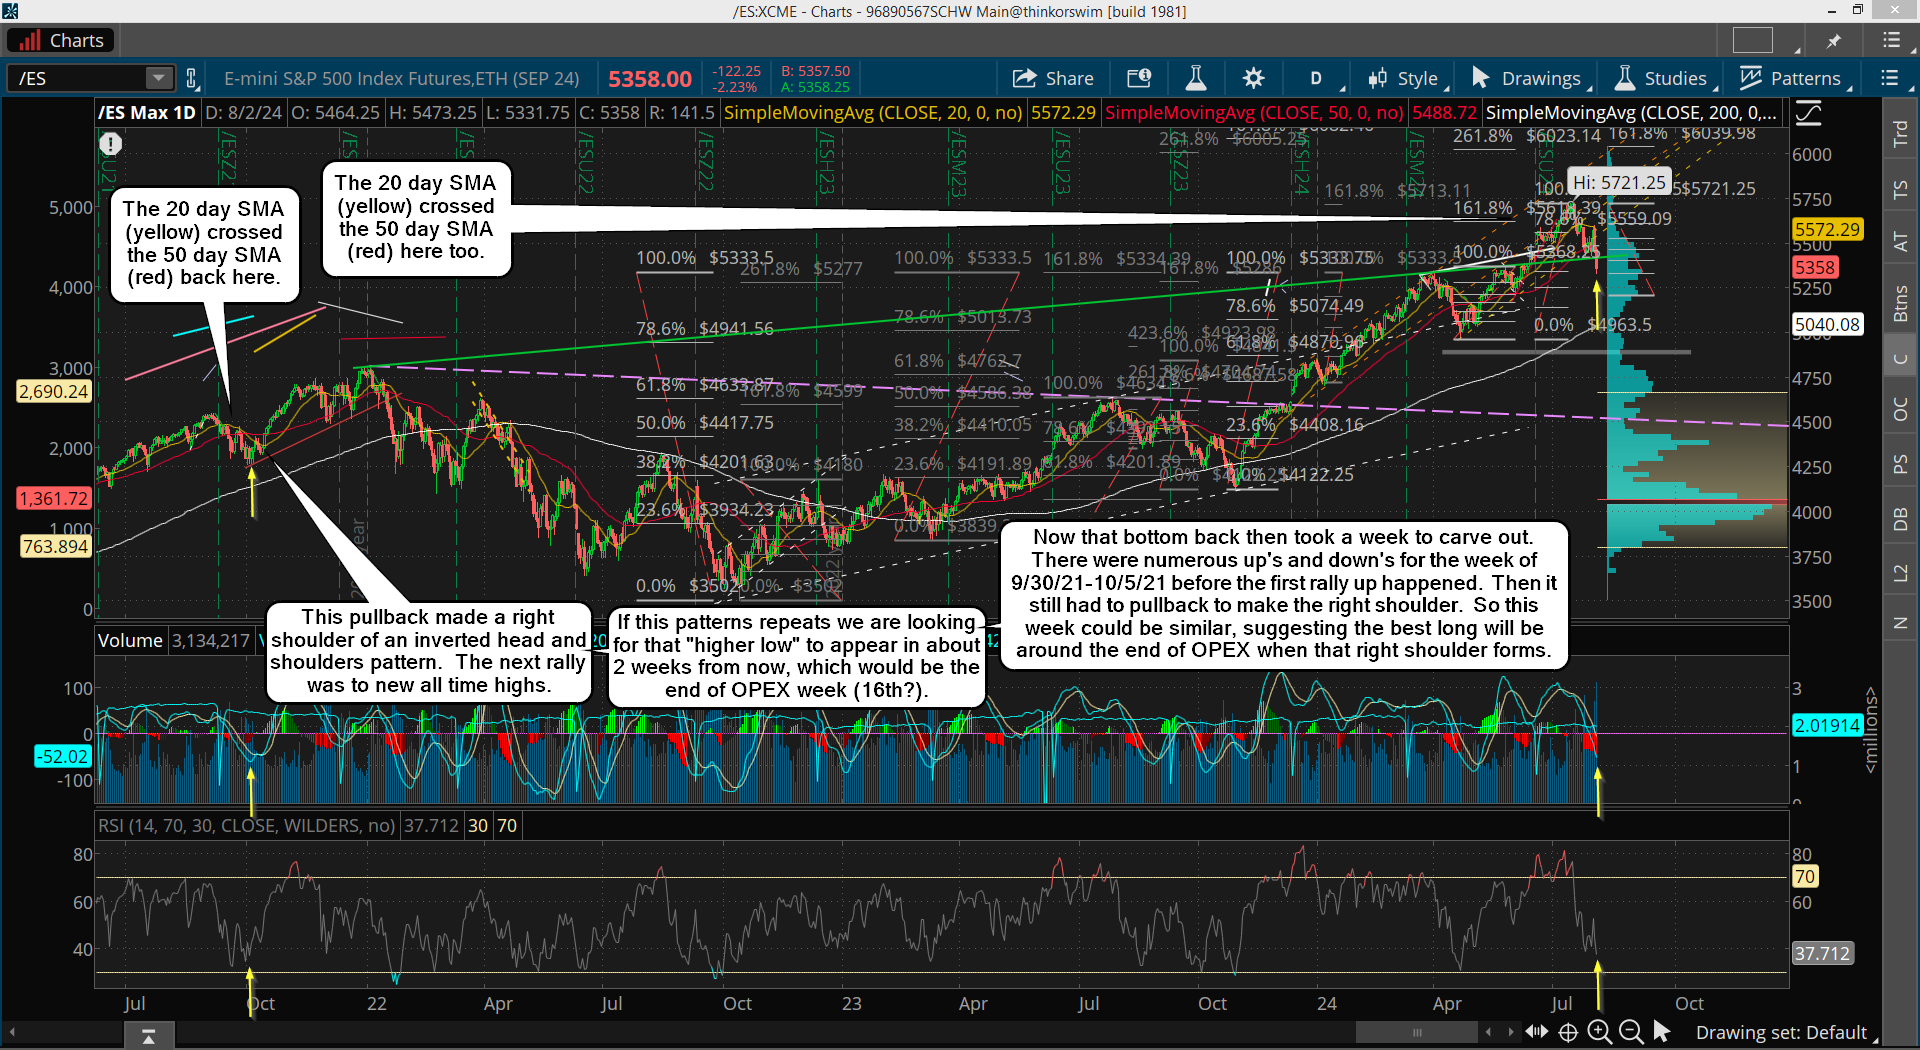
Possibly we see a "one day wonder" followed by a full reversal the next day, and then a "multi-day" wonder? When I looks for similar patterns from the past the 9/21/21 low and the 10/1/21 low looks a lot like the setup in the market now. If I had to pick which date I'd say we look the closes to the 10/1/21 low as the MACD's on the daily chart are at a similar point and so is the RSI. Even the RSI on the weekly chart looks like that 10/1/21 period.
The rally from back then produced a new all time high and topped out about 2 months later on 1/3/22. Could that pattern repeat? It's possible for sure, but there's no way to be a 100% certain of course. For now though I'm just looking for a strong rally up for several days, which should be sold as trapped bulls exit. Then "if" we repeat the prior pattern there will be one last pullback, like the 10/7/22 to 10/13/22 period, which will make a higher low and setup an "inverted head and shoulders" pattern. It's from that point forward that the market could start a big squeeze to new all time highs.
Have a blessed day.


Today should be a bottom but a short term one. I was looking for this type of a drop but it dropped farther than I expected.
The 20 day ema is about to cross the 50day average which was one sign of a bottom that I was looking for. The 13 day crossing another indicator was another sign and that is on the verge of happening.
I’m just on the verge of getting sells (probably initial ones today) so that is telling me there should be one more big pop before we get a brutal decline.
In early April 2000, there was a flash crash decline that reversed into a rally into the end of the week. The $vix got up to a crazy 65 today on this at worst 4% decline today. That’s quite some panic.
The markets are already down to near their 200 day averages with very little internal damage. (The Fang stocks are getting eviscerated) It’s scary to think what will happen when the broad indices join in. Let’s see how things play out the rest of the week.
If we get a double bottom going into the end of the week, then that would be very bullish.
I too think we bounce for a few days but I see another lower low before the real bottom is in. I still think it’s possible that we hit the prior FP’s on the Yahoo site at 483 on the SPY.