So here I sit on Sunday afternoon wondering what to write on this weekend post? It seems (or at least feels) like I keep writing the same thing every weekend. "The market is way overbought and should sell off ASAP!" I said that last week, and the week before that, and etc, etc...
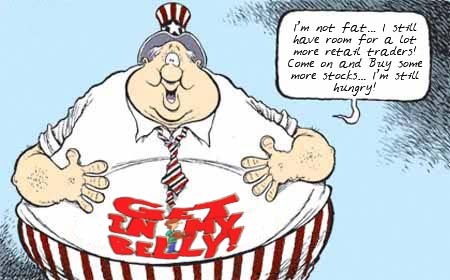
I feel like the boy who cried WOLF... for the hundredth time! Well, I'm going to cry Wolf one more time, as this FAT Bloated PIG of a market needs to shed some weight ASAP, before he explodes violently!
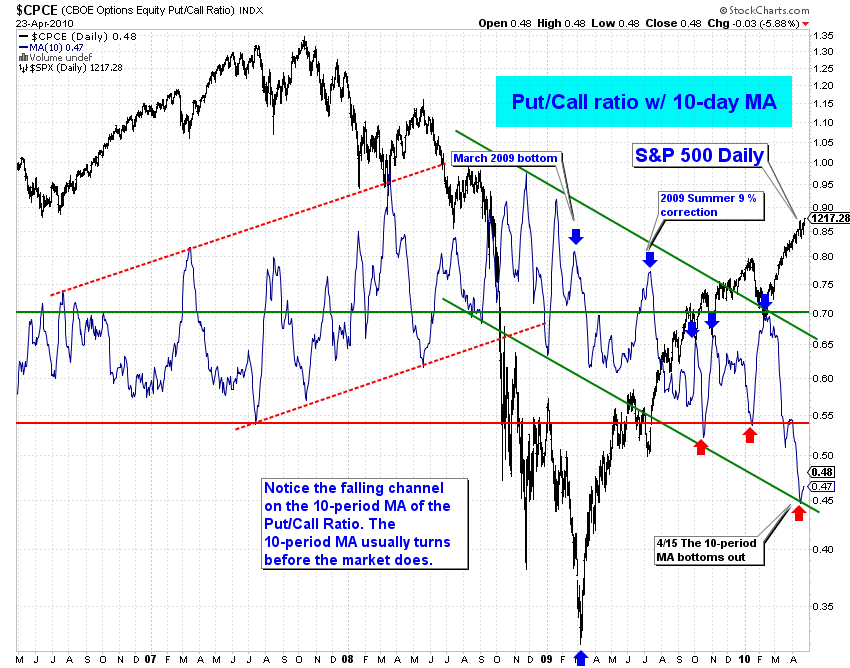
I don't have a lot of charts to show you, as it seems that "Overbought" can remain overbought for unknown time periods, so I'll just show you this chart of the Put/Call Ratio (courtesy of the chart pattern trader).
The percentage of Bears is now at a record low of 17.4%... which means that 82.6% of the people are now Bullish on the market. That's an insane number folks! And you and I both know by now that the market doesn't reward the side of the "majority", but instead it takes their money from them. When, of course is the question we all want answered?
If I could answer that question accurately I be filthy rich by now... so of course I have to guess at it, just like everyone else. Currently we are only a little over 10 points away from the magical Fibonacci retracement level of 61.8%, coming in around the 1228 spx level.
You know that everyone and their brother knows the significance of that level, and that in of it's self should tell you that the market isn't going to just go there, stop and wait for people to short it, and then reverse allowing the average retail trader to make money from it. It's never that easy my friends.
That simply means that we must either fall short of that level, or bust on higher past it. Since we have already been given our final upside target of 118.16 DIA, which should be around 1270-1280 SPX (guessing here), we have to calculate the odds of another parabolic move straight up from the current level to that all time yearly high.
I don't know what the odds are, but I simply can't wrap my head around the idea that the market could get through all the huge resistance overhead, without a pull back first. That would probably make the bullish percentage in the low 90's by then. I don't know if it's ever got that high before a pull back?
Logic (but again, the market isn't logical) tells me that they will take the money from those bulls way before going that high, just like they did the bears... on this insane rally up. Plus, they will actually need the bears to be heavily short, so they can use them as fuel to rally higher. Without the ability to squeeze the bears, and with no bulls left buying, they must rely solely on the PPT money... and I just don't think that will be enough to overcome the negative news being constantly released, and the huge overhead resistance.
Of course I've said that before, and been wrong before, so why is this time any different? I don't know? I only know that the odds of a correction first, before going up to the final top for the year, is even higher this coming week, versus last week. Odds, numbers, and percentages are really all you can trade on now, as the typical TA charts don't correctly tell you when the market is going to turn.
Obviously, the super computer algorithms are much smarter then the average trader, as they combine all the data in a fashion that isn't predictable by humans. I'm sure there is a reason behind the madness of it all, but I don't know what it is?
However, there is little doubt in my mind that it's all politically motivated, and of course "Financially Motivated"... meaning that they are trying to time events around key political issues, like the health care bill, and now the bank reform bill. And let's not forgot that the elections are this fall, which tells me that any correction we get will be short lived, as they need to rally the market into the elections.
After the elections are over... well, does the old saying "Katie bar the door" paint a good picture for you? Or maybe "Timberrrrrr"? I'm sure you get the picture by now. Once all the new and old Democrats and Republicans get re-elected, there isn't any reason to hold the market up until the Presidential election in 2012.
The market could fall hard all of 2011, and then rally in 2012 for Obama to look good just before he tries to get re-elected again. Of course none of this helps out our short term trading accounts, as forecasting the next weeks' move is much harder then the next year or two.
But, who ever said picking a top or bottom was easy? Could it happen next week? Possibly? I hope so, as I'm really tired of the never ending bull rampage. It's quite sicken to see so much deception and manipulation in the market.
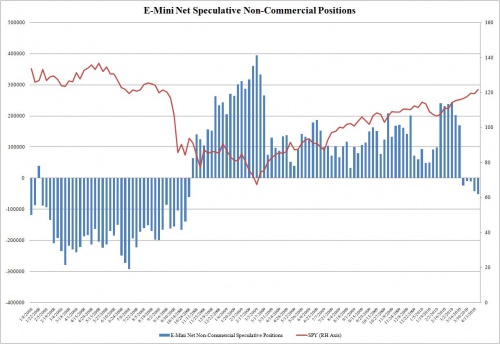
I do know that is coming soon, as the insiders are moving to a short position, as explained in this article by ZeroHedge. A 10% (or more?) correction is planned, as these guys are the "Smart Money". I'm hanging tight, with my short position (even though it's underwater now), as still see a sell off before OPX in May.
I leave you with this chart from Cobra's blog...
Red


The Weekly view from Americanbulls
TNA had a weekly HOLD signal last week, rose this week, and remains a Hold. The candlestick this week is a Long White Candlestick.
AmericanBulls has this trade starting at $44.23 on March 3rd, and this week closed at 70.78, up 60%.
TZA had a weekly WAIT signal last week, fell this week, and remains a Wait. The candlestick this week is a Black Candlestick.
AmericanBulls last placed a SELL on TZA at $9.83 on February 19th and this week closed at $5.41, down 44.9%.
Summary of Positive ETFs & a few popular ETFs & stocks (Market positive):
Hold: TNA(3x, up 60.0%), AAPL(up 38.4%), UWM(2x, up 37.3%), IYR(1x RE, up 22.7%), IWM(1x, up 17.1%), QQQQ(up 17.5%),, USO (oil, up 4.8%),
New Confirmed Buy: URE(2x RE)
Action for TNA or TZA for tomorrow: none
Hi Red,nice post… I have a video on Goldman Suks and a write up on my blog, go read it you will like my banter of the crooks
http://hotoptionbabe.com/2010/04/25/more-goldma…
Hi Red,nice post… I have a video on Goldman Suks and a write up on my blog, go read it you will like my banter of the crooks
http://hotoptionbabe.com/2010/04/25/more-goldma…
Let's keep things ultra simple
SPY has only been significantly below it's green TL on 3 different occasions in the past 430 calendar days.
http://www.flickr.com/photos/47091634@N04/45544…
All 3 of those occasions started with a initiation gap below the green TL with an acceleration downthrust.
Until that happens, don't expect SPY to change it's behavior.
The green TL should be in the $SPX 1265-1285 region around the summer solstice.
It looks like we are going straight up to 11,816 dow first…
Sundancer, are you saying that it is unlikely we could have a 100 SPX drop (over the course of several weeks) without the market gapping down below the trendline at the open?
since the operators have initiated every downward thrust below the TL with a gap, I see no reason for the operators to change their calling card
Hmmm. Well tomorrow is the 81rst calendar day from the downward move so I guess we should know whether we are going to have a large move down by then.
Carl’s morning call:
June S&P E-mini Futures: Today's range estimate is 1205 – 1217. A swing to 1270 is now underway.
1201.25–1213.75 actual last Friday (12.50 points)
1216.75 high last night
1205-1217 estimate for today (12 points)
1213 currently, so estimate is -8 to +4 from here (Bearish)
GS trending down.
SPY gaps up, $VIX gaps up, GS falls out of bed! LOL
9:47 est GS 153's
Usually when those fake prints happen, we don't get that much more downside on the day then the number printed.
these are actual trades
Got it – thanks!
GS getting crushed. This market is so irrational.
the lower GS goes, the higher SPY goes, makes perfect sense LOL
GS has been sandwiched between two different ENV on the 195 min.
http://www.flickr.com/photos/47091634@N04/45548…
Dude…You pull one chart from Cobra which (may) indicate he is bearish but did you read his blog? He is bullish short term, intermediate and long term!
Yes, I read his blog all the time. And I do know he is short term bullish. So is everyone else it seems. I'm about the last bear alive I believe…
You're not! I went long DRV today based on a candlestick pattern that I really like.
I show resistance at 1218+
http://screencast.com/t/OTJmMDc0YWU
Yep
http://www.flickr.com/photos/47091634@N04/45553…
GS is dropping big
XLF broke support at 16.60
Carl at day’s end:
1205-1217 estimate for today (12 points)
1207.50–1216.50 actual today (9 points)
Carl nailed the high, close on the low.
Trade: No trades today.
Grade: C (made no money)
TNA opened flat (down a penny). TNA was up 2.0% at the high, and closed down 1.3%.
We are now in a New Moon Trade, which tends to favor TZA, but we are now trading TNA, as it is going up, and TZA is not.
AmericanBulls had TNA with a Hold signal for today. The TNA buy was at $69.05, and TNA closed at $69.89, up 0.8%.
Volume for TNA today was about normal for the past month.
$RVX (VIX for $RUT) closed up 8.5% with TNA down 1.3%. No divergence. Bad for TNA.
TNA was up for 5 days, down for 2 days, up 4 days and down today. Bad for TNA.
The high for TNA had been from yesterday at $70.98. Today’s high was $72.24, 1.7% higher. Good for TNA.
Yesterday, when TNA rose 3.1%, Ultimate Oscillator fell from 75.7 to 74.8, a divergence. Today that divergence played out as TNA fell 1.3%. Today, TNA fell and reading went from 74 to 69. Bad for TNA.
MACD on the monthly chart has been rising for 9 days, and today well. Good for TNA.
Bollinger Bands for $RVX (VIX for $RUT): Today’s long white candle closed the 50 day MA, a bit below the upper Bollinger band. MACD seems to be rising. $RVX seems to be rising. Bad for TNA.
Bollinger Bands for $RUT: Today’s rare non-white candle touched the upper Bollinger Band and closed below it. MACD is rising. While it’s rare that $RUT has a black candle like today, it does happen, and usually returns to a white candle in 2-3 days.
Bad for TNA for tomorrow.
Bollinger Bands for $RUT:$RVX ($RUT vs VIX for $RUT): today’s doji dropped to the Bollinger mid line, which was rising today. Bad for TNA.
TNA had a higher high, higher low and lower close – Neutral for TNA.
Money flow for the Total Stock Market:
$1,393 million flowing out of the market 2 days ago.
$2,305 million flowing into the market yesterday.
$ 17 million flowing into the market today on a down day.
Neutral for TNA.
I will post the AmericanBulls candlestick interpretation a bit later.
Overall, it looks bad for TNA.
The Daily view from Americanbulls
TNA had a Hold signal today, was down today, and has a highly reliable SELL-IF signal for tomorrow. The TNA buy was at $56.50. TNA closed at $69.90, up 23.7% since the buy. The candlestick today was a Black Candlestick (normal selling pressure). The last two candlesticks formed a highly reliable Bearish Dark Cloud Cover Pattern.
TZA had a Wait (for a signal) today, was up today, and has a low reliability BUY-IF signal for tomorrow. The TZA sell price was $6.51. TZA closed today at $5.48, down 15.8% since the sell. The candlestick for today was a White Candlestick (normal buying pressure). The last two candlesticks formed a low reliability Bullish Harami Pattern.
Three recent TZA Buy signals have failed and may perhaps serve as a warning:
Buy at $7.33, sell at $7.14
Buy at $7.11, sell at $7.05
Buy at $7.04, sell at $6.51
For that matter, recent TNA Buy signals (until this last one) have also been uninspiring:
Buy at $55.36, sell at $55.43
Buy at $55.69, sell at $55.63
Buy at $56.50, up 23.7%
Summary of Positive $RUT based ETFs & a few popular ETFs & stocks (Market positive): +3
Hold: GLD(gold, up 0.83%), UCO (2x oil, down 1.0%), EWU(England, down 1.4%)
Transition to Market Positive: 0
Transition to Market Negative: -16
SELL-IF: TNA(3x), UWM(2x), ERX(3x energy), EWX(emerging mkts), IWM(1x), SLV(silver), QQQQ, AAPL, DIA, SPY, EWQ(France), EWG(Germany), IYR(1x RE), URE(2x RE), DRN(3x RE), AMZN
Market Negative: -3
Wait: USO(oil), GOOG, GS
Comment: Bearish overall, Neutral Oil, Bearish $RUT, Bearish Real Estate
Action for TNA or TZA for tomorrow: possible buy TZA, possible sell TNA
Earl, Thanks for the post, I read it every night.
Tomorrow will be a funny day…
http://midasfinancialmarkets.blogspot.com/2010/…
Hi. I am forex-cat.
Your article is always useful.
Thanks.
…my blog:
http://forex-chart-analysis-and-a-cat.blogspot.com/
Hi. I am forex-cat.
Your article is always useful.
Thanks.
…my blog:
http://forex-chart-analysis-and-a-cat.blogspot.com/