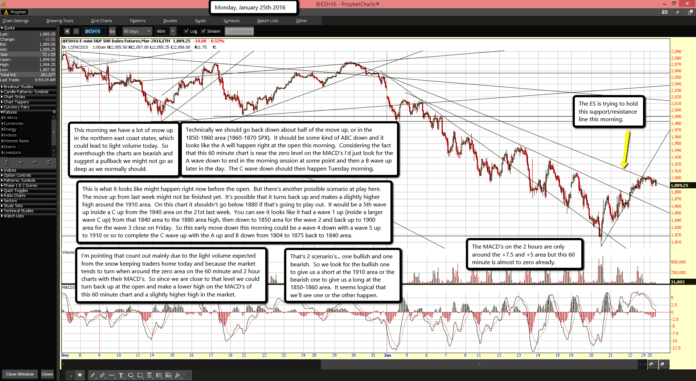
 The ES is trying to hold this support/resistance line this morning.
The MACD's on the 2 hours are only around the +7.5 and +5 area but this 60 minute is almost to zero already.
This morning we have a lot of snow up in the northern east coast states, which could lead to light volume today. So even-though the charts are bearish and suggest a pullback we might not go as deep as we normally should.
Technically we should go back down about half of the move up, or in the 1850-1860 area (1860-1870 SPX). It should be some kind of ABC down and it looks like the A will happen right at the open this morning. Considering the fact that this 60 minute chart is near the zero level on the MACD's I'd just look for the A wave down to end in the morning session at some point and then a B wave up later in the day. The C wave down should then happen Tuesday morning.
This is what it looks like might happen right now before the open. But there's another possible scenario at play here. The move up from last week might not be finished yet. It's possible that it turns back up and makes a slightly higher high around the 1910 area. On this chart it shouldn't go below 1880 if that's going to play out. It would be a 5th wave up inside a C up from the 1840 area on the 21st last week. You can see it looks like it had a wave 1 up (inside a larger wave C up) from that 1840 area to the 1880 area high, then down to 1850 area for the wave 2 and back up to 1900 area for the wave 3 close on Friday. So this early move down this morning could be a wave 4 down with a wave 5 up to 1910 or so to complete the C wave up with the A up and B down from 1804 to 1875 back to 1840 area.
I'm pointing that count out mainly due to the light volume expected from the snow keeping traders home today and because the market tends to turn when around the zero area on the 60 minute and 2 hour charts with their MACD's. So since we are close to that level we could turn back up at the open and make a lower high on the MACD's of this 60 minute chart and a slightly higher high in the market.
That's 2 scenario's... one bullish and one bearish. So we look for the bullish one to give us a short at the 1910 area or the bearish one to give us a long at the 1850-1860 area. It seems logical that we'll see one or the other happen.


