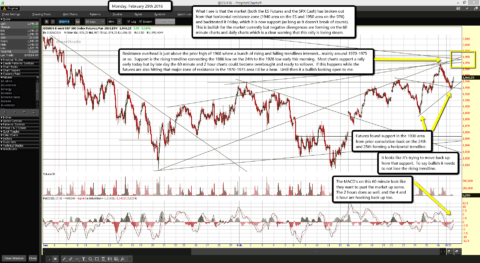
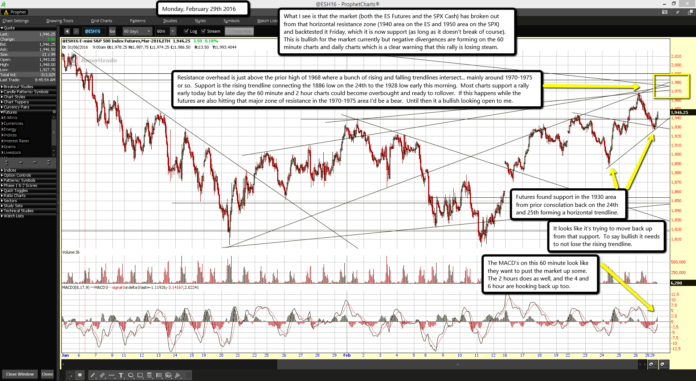
 Futures found support in the 1930 area from prior consolation back on the 24th and 25th forming a horizontal trendline.
It looks like it's trying to move back up from that support. To say bullish it needs to not lose the rising trendline.
The MACD's on this 60 minute look like they want to pust the market up some. The 2 hours does as well, and the 4 and 6 hour are hooking back up too.
What I see is that the market (both the ES Futures and the SPX Cash) has broken out from that horizontal resistance zone (1940 area on the ES and 1950 area on the SPX) and backtested it Friday, which it is now support (as long as it doesn't break of course). This is bullish for the market currently but negative divergences are forming on the 60 minute charts and daily charts which is a clear warning that this rally is losing steam.
Resistance overhead is just above the prior high of 1968 where a bunch of rising and falling trendlines intersect... mainly around 1970-1975 or so. Support is the rising trendline connecting the 1886 low on the 24th to the 1928 low early this morning. Most charts support a rally early today but by late day the 60 minute and 2 hour charts could become overbought and ready to rollover. If this happens while the futures are also hitting that major zone of resistance in the 1970-1975 area I'd be a bear. Until then it a bullish looking open to me.


