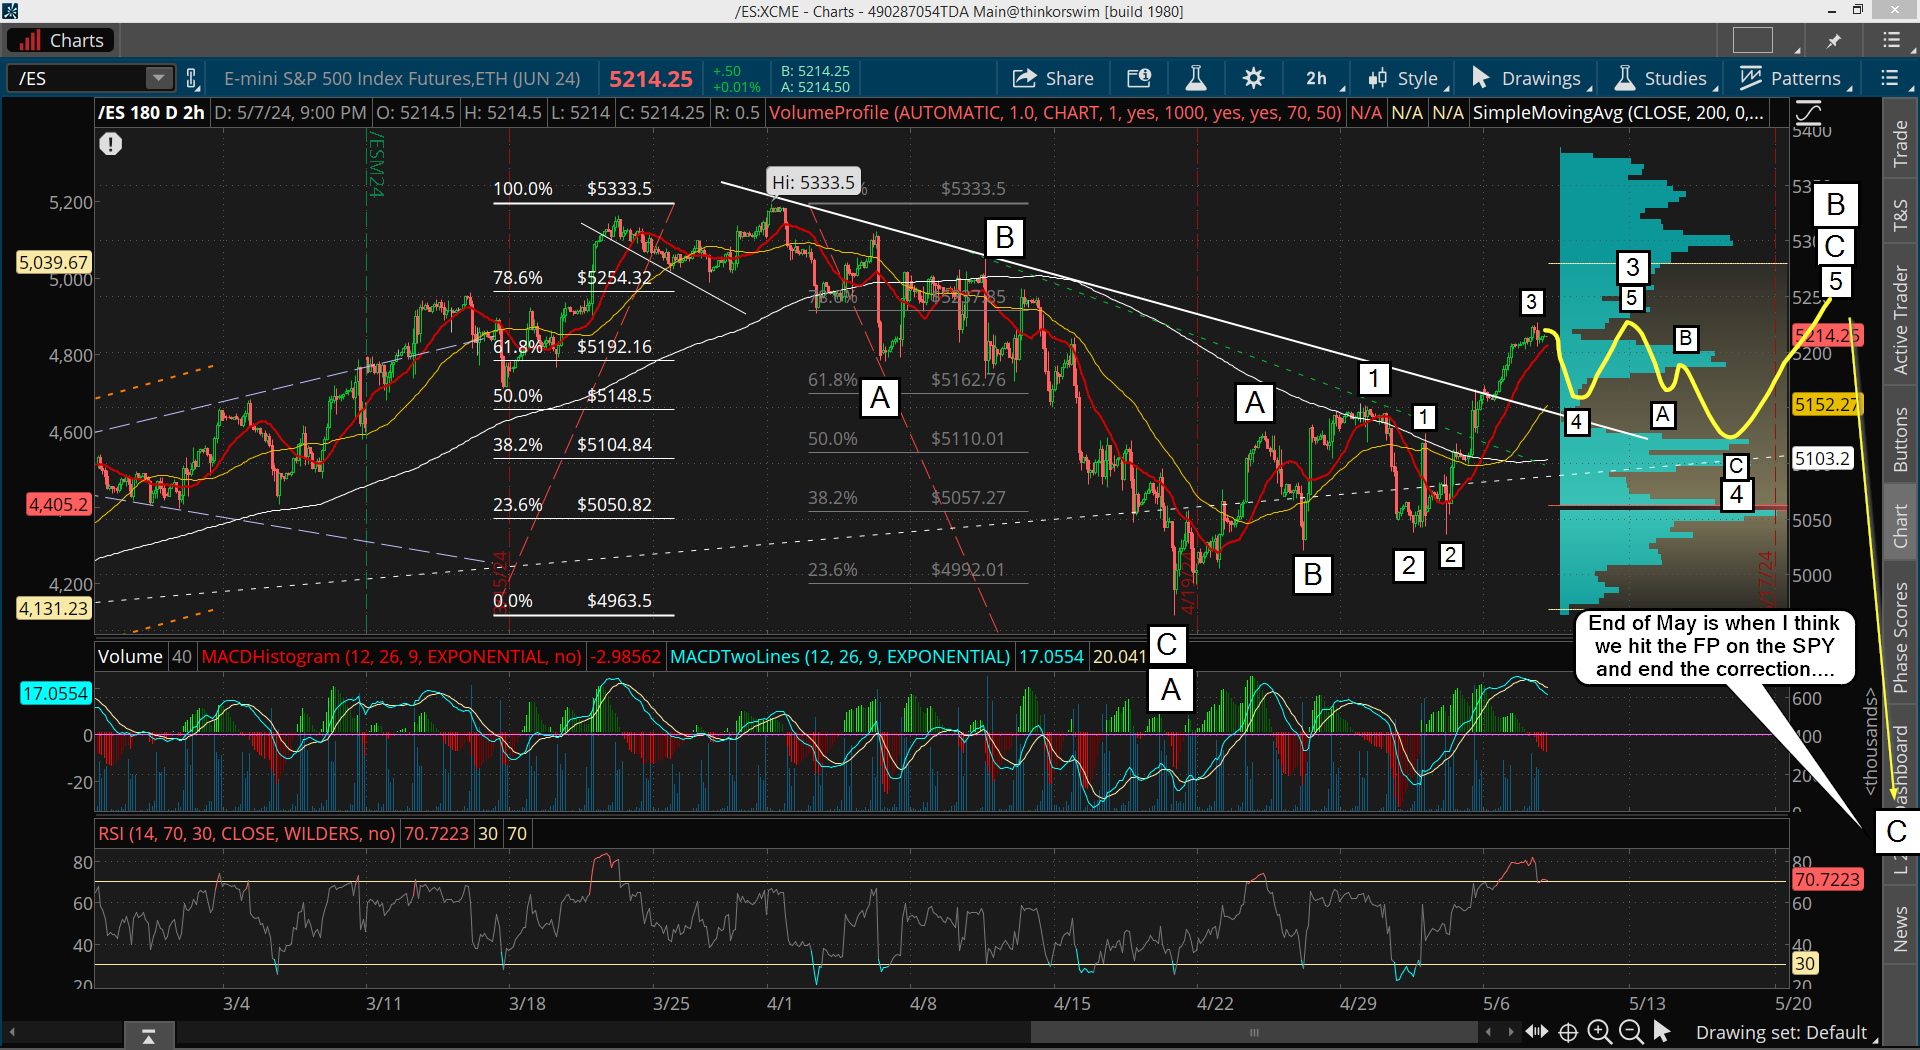
A pause day yesterday that closed a little positive but not much. Overall it just held the 5200 level as every attempt to breakout over 5230 failed. The market is basing for a big move, and most of last month I would say that the "basing" is bullish, but not this time around. If bulls can't get through the big resistance zone up to 5170 by the next day or so they will be forced to punt the ball to the bears.
But... I don't think we are ready to start the drop to the FP yet. The window of time has run out I believe. Instead I think we will get a pullback to support from the falling white trendline around the 5150 zone. From there we should go back up but it might take a week or more to take out yesterdays high. Here's the possible wave count...
I discussed this as possible last week, and while I wanted to see the FP hit already it's just not looking good for that happening now. This looks to me like it's going to drag out into the end of this month. OPEX is typically a bullish week, or at least a choppy one that doesn't tank hard. A rangebound trading zone is possible for that week, which is next week.
That would leave the last 2 weeks of this month for the large C wave down to play out and hit the FP, which should have 5 medium waves inside it and of course 5 small waves inside the wave 3 of that large C wave. But that's looking more and more like it's going to happen during the second half of this month.
This is needed I think for the weekly chart to have enough time to cool off from being so overbought into the April top. If the whole month of May is used to reset it then June can be a strong rally month where a new all time high will likely happen from. So for now, this wave count and forecast is what I think will play out. No amount of rooting for, begging for or praying is going to make the market do what you want it to do. You have to accept what it gives you and what it's telling you is most likely to happen in the future. This is what I think it's telling me, and will happen. Of course I'll adjust as we go forward.
Have a blessed day.


28 trading days off the high marked the secondary high in previous historical epochs but I think the topping process can extend later into the week. They’ve been using Thursdays and Fridays for turns lately. Friday would be 15 trading days off the low to match the 15 trading days down into the low.
There is a catalyst for a hard drop on Tuesday next week. They are releasing the PPI on that day, strangely ahead of the CPI.
A break of the 50 day average would indicate the decline is on. I’m looking for the 20 day ema to reach a certain level on a derivative index/indicator to mark a possible high. This would tie into similar levels seen at the 2022 top. We are getting close but the data hasn’t come out yet today.
My wave count would agree with you that we could top for my last wave sometime nice week. When I don’t know… maybe Wednesday? Hard too predict that, but if we drop hard on Tuesday for the PPI then they can use the CPI the following day to rally it back up to squeeze out the shorts. Then the drop can start for real and might last into the end of the month.