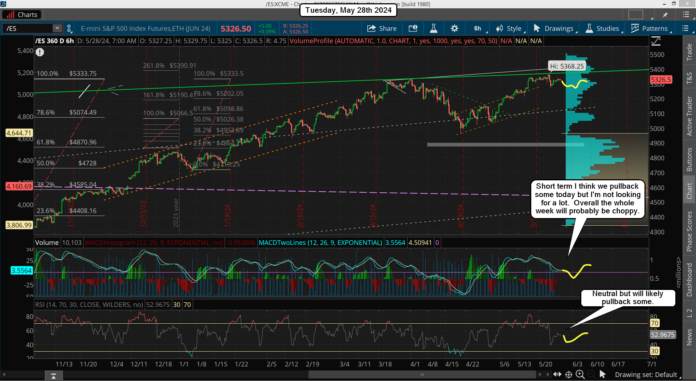
Nice pullback on Thursday but it was erased on Friday, so bears blew it again it seems. I don't see anything really bearish in the technicals right now, but the bulls are up against some pretty tough resistance from the rising green trendline overhead. So it makes me think this week is going to be a choppy one where not much is given up on the downside and not much is gained on the upside.
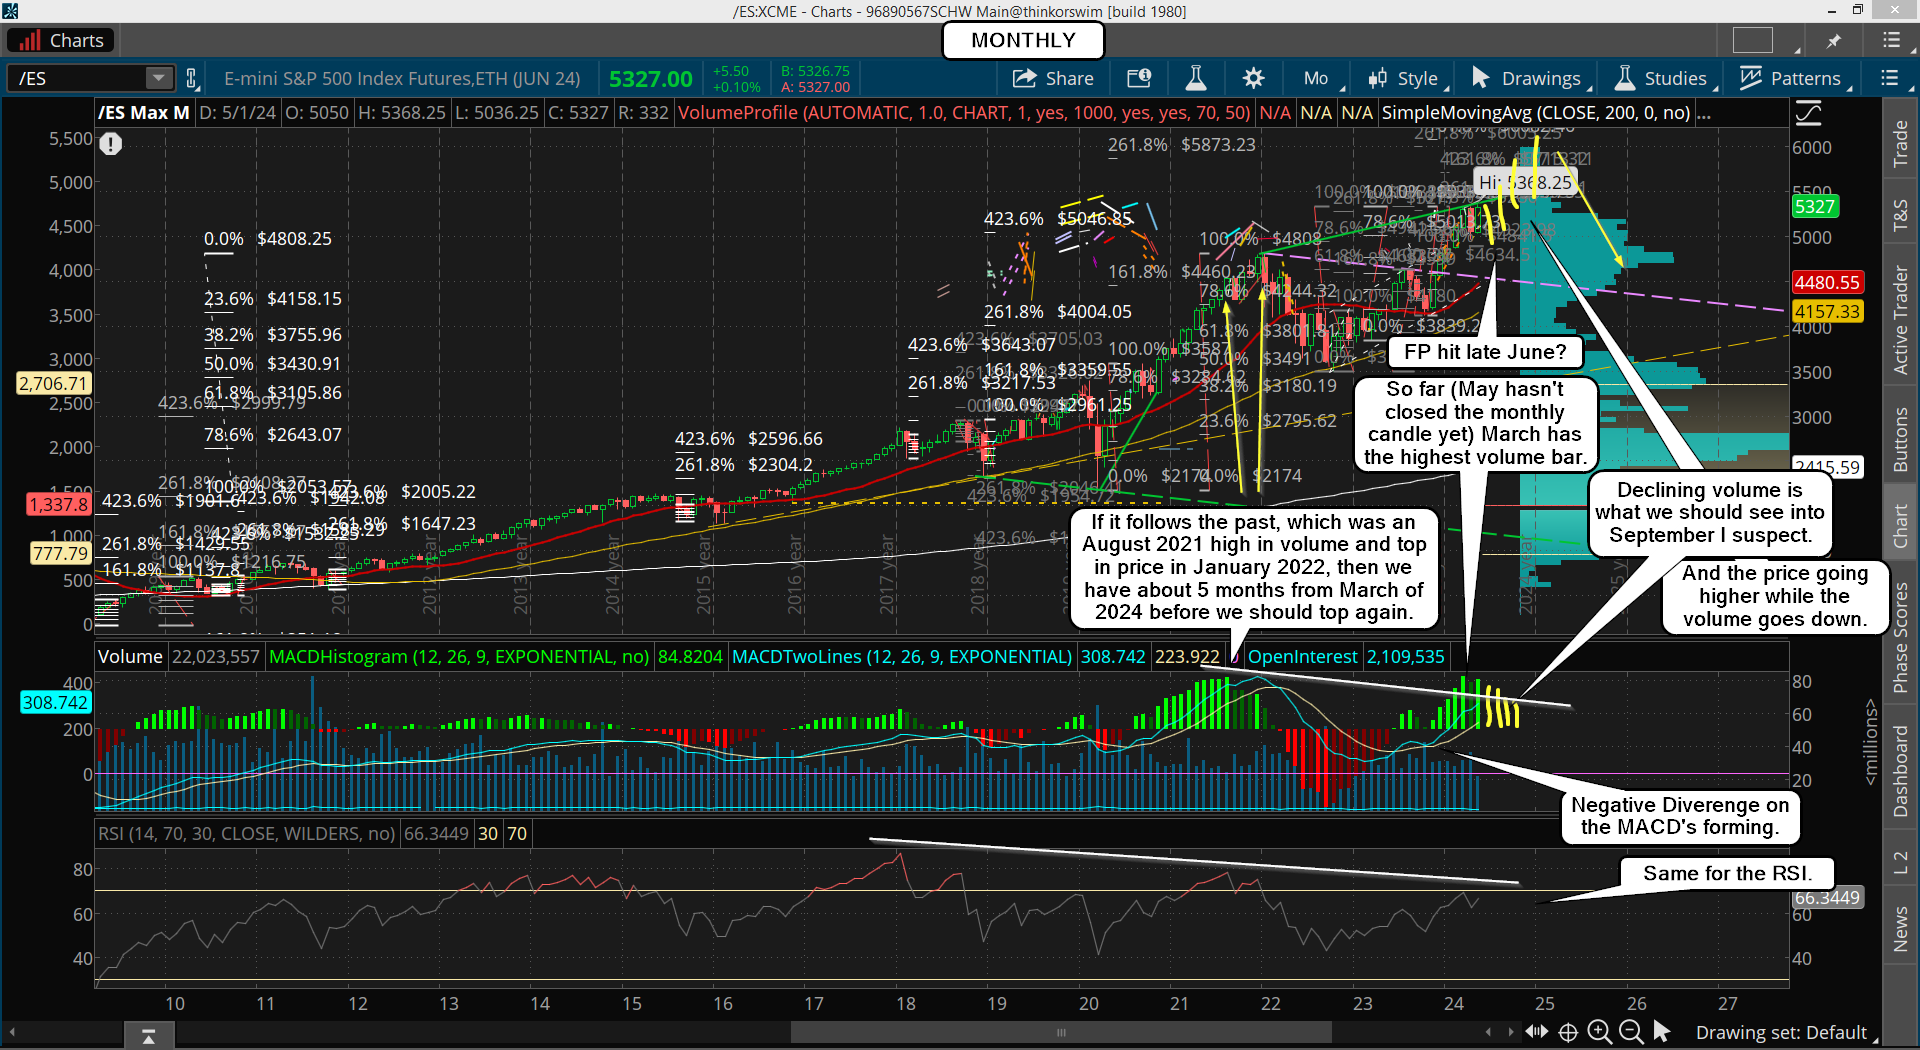
The monthly chart is still bullish and suggests this bull market could run for another 3-4 months. It will be super interesting to see how the monthly volume candle closes out this month as currently it's lower then the peak in the month of March, but higher then April. However, if it doesn't take out the March volume high then the "3-4 months left" will remain intact, but it will be canceled if a new volume high is made this month.
The January 2022 high in the market put in the monthly volume high in August of 2021, so the market rallied for 5 more months afterwards and then topped and dropped for all of 2022. Something similar should happen again, which is why I said 3-4 months is all we have left.
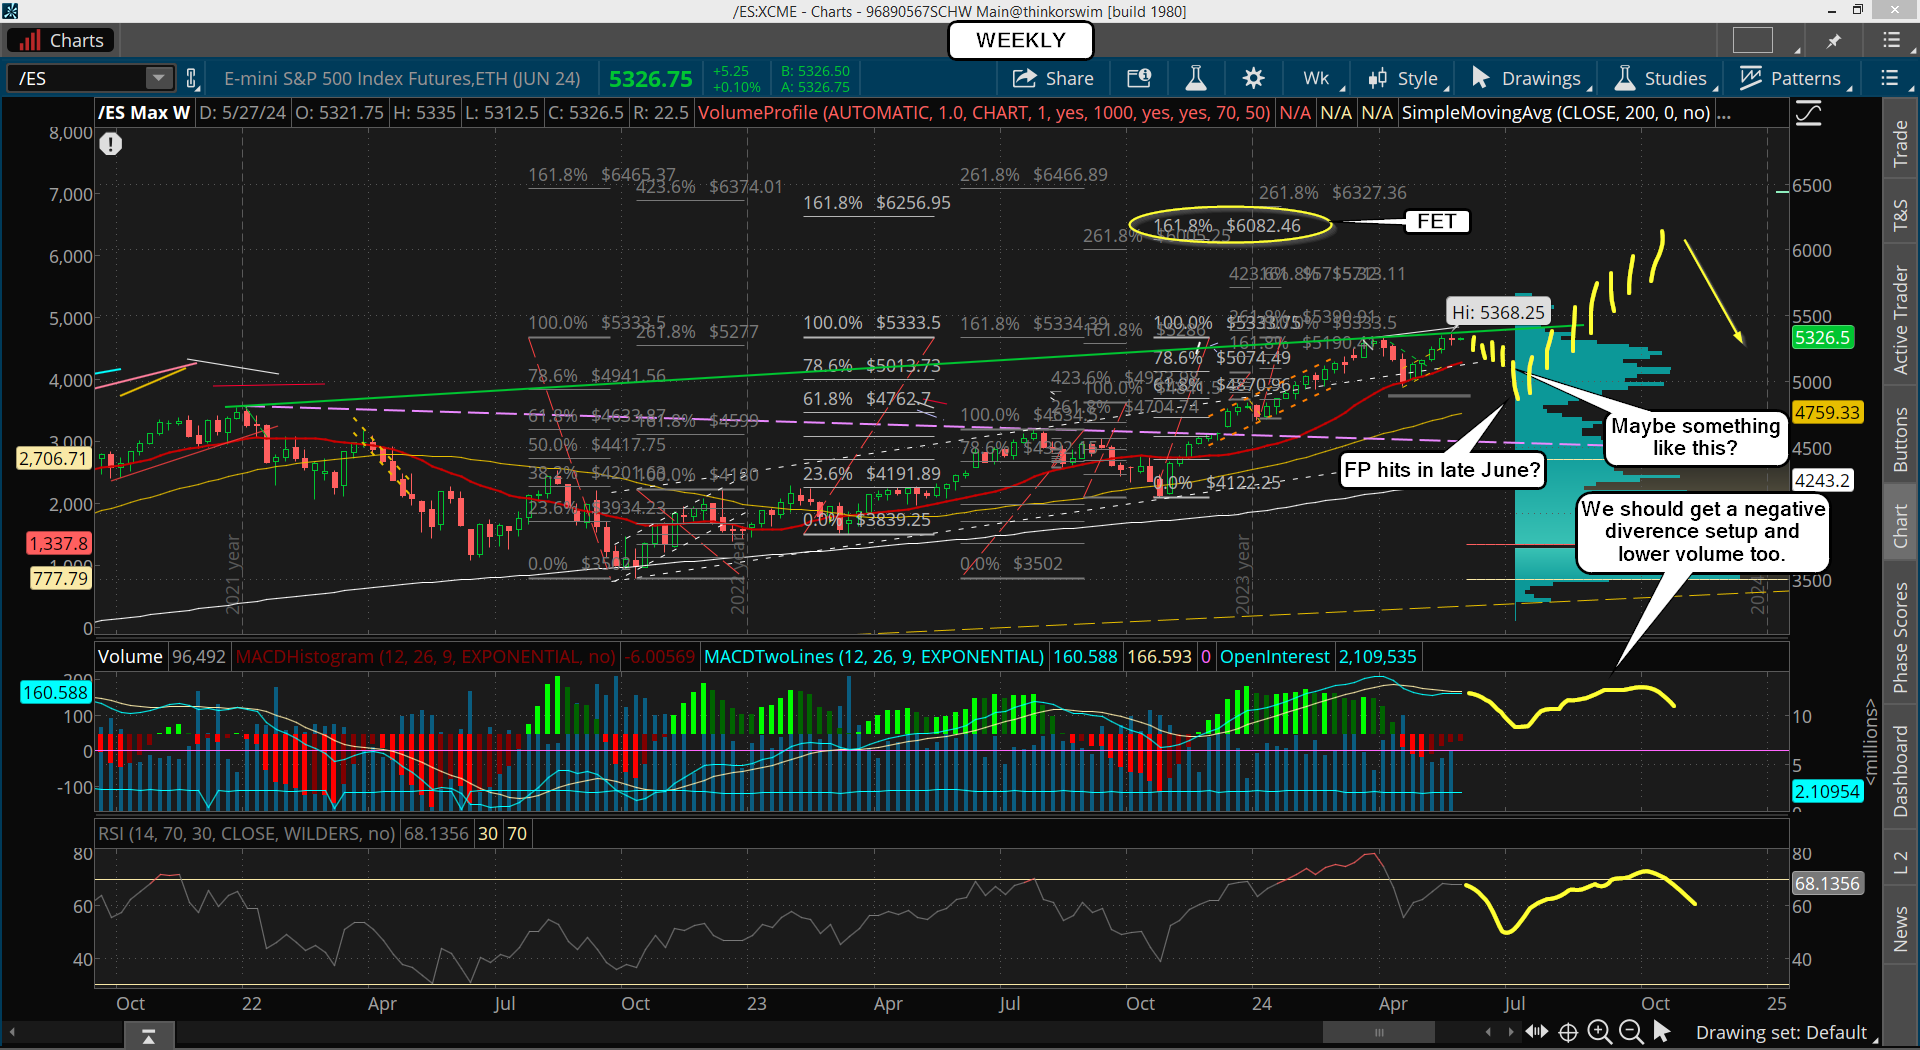
Now, the weekly chart has already peaked in volume back on the week of 12/25 last year. The MACD's peaked the week of 3/25 this year and made a bearish cross the week of 4/15, and have remained crossed ever since. It tells me that the market is likely going to be range-bound for awhile until those MACD's reset more.
They are still way to high I think to support another blast off rally. They need to pullback to the neutral line like the correction did from the week of 7/24 to 10/23 last year. However, the market might not pullback like it did then and just go sideways in a few hundred point range.
But I get the feeling that before they end that period they will take one week (the last one) to drop down to the FP on the SPY, but we might not see that for a month or more? What I saying is that I don't think we'll see any fast drop to the FP but a ton of chop up and down to frustrate both sides. Then at the end they will flush it down to the FP and reverse back from there to start the last multi-month rally to 6000+ into August or September.
As far as the daily chart goes it's closer to overbought territory but that doesn't mean it's going to rollover hard. It can get up into the full overbought zone and stay there for a long time when the monthly and weekly chart is support it. Currently the monthly chart is still pushing up but the weekly isn't, so this tells me that we won't see the daily chart get full overbought now as it doesn't have the same support it did previously... hence my reason for thinking we are going to be choppy for awhile, which should have a downward bias in the end.
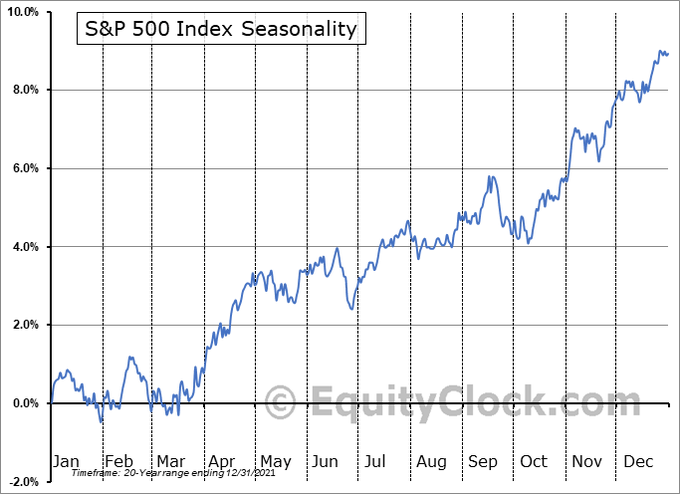
Meaning it can hit the FP on the SPY to conclude it all. This could take a month to play out? I could see it lasting into early July if it really wants to drag out that long. Seasonality is bearish the last half of June, and it turns quite bullish after that, which last into mid-September.
So if there is ever going to be a period where that FP is hit I'd think that is it. From there I'd look for 6000+ in a blow off squeeze, which could be right into that mid-September period to match up with the Seasonality Chart... who knows?
In the month of June we have two important things that could give us that last move down to the FP, which is the Consumer Price Index release (CPI) on June 12th, and the Fed speaking on the same day for the FOMC meeting. Of course if we hit the FP going into that date then it's a mega buy, but if we are still away from it then I'd think we will hit it the week or two afterwards. That's all I see right now, which is big picture stuff. Short term is too clouded right now.
Have a blessed day.


