

The market has spent the last several weeks in a choppy rangebound zone making another bull flag... but will it result in another month long rally? Anything is possible but I doubt if it happens this time around. The reason I say that is based on the past and how the technicals are aligned now, which similar patterns produced pullbacks from. Let's look at the daily chart below for example.
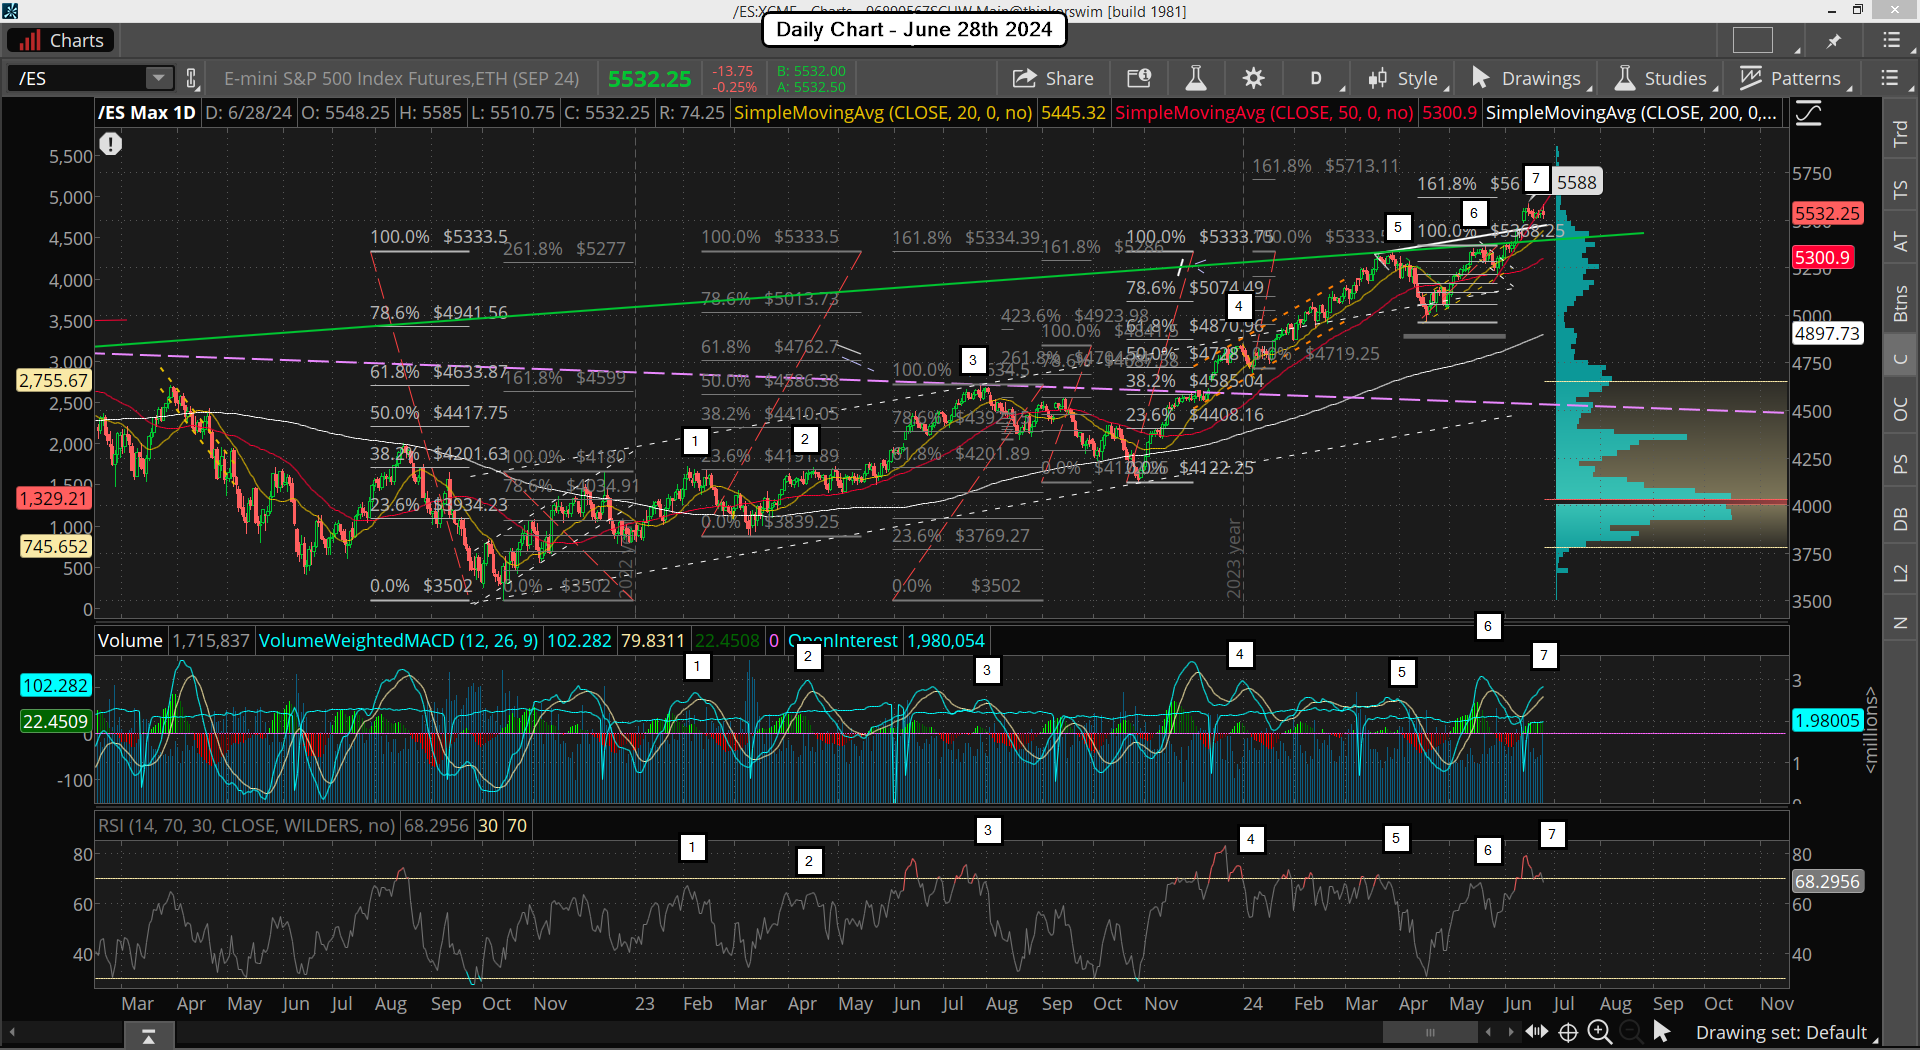
On it you will see that the MACD's and RSI were overbought during the prior similar patterns, just like they are now. And they produced a pullback in all the recent cases, which some were small and others bigger, but a pullback still happened. I'm only covering the period after the market bottomed in 2022 and started back up as we have to compare apples to apples and oranges to oranges... meaning uptrends to uptrends and downtrends to downtrends.
At point 1 the weekly chart was very oversold but the daily got overbought on the MACD and almost overbought on the RSI. A pullback happened, which was a backtest of the 200 day moving average, a common event when the downtrend is ending and an uptrend starting. Point 2 gave only a small pullback, which I'm sure was because the weekly chart was pointing up strongly from being very oversold on its' MACD's and the RSI around neutral. It would have been foolish to short it back then based on that alignment, and the smarter move would have been to wait on the MACD on the daily chart to turn back up and go long. Point 3 gave us a deeper pullback because the MACD on the weekly chart reached the overbought level. Chart below.
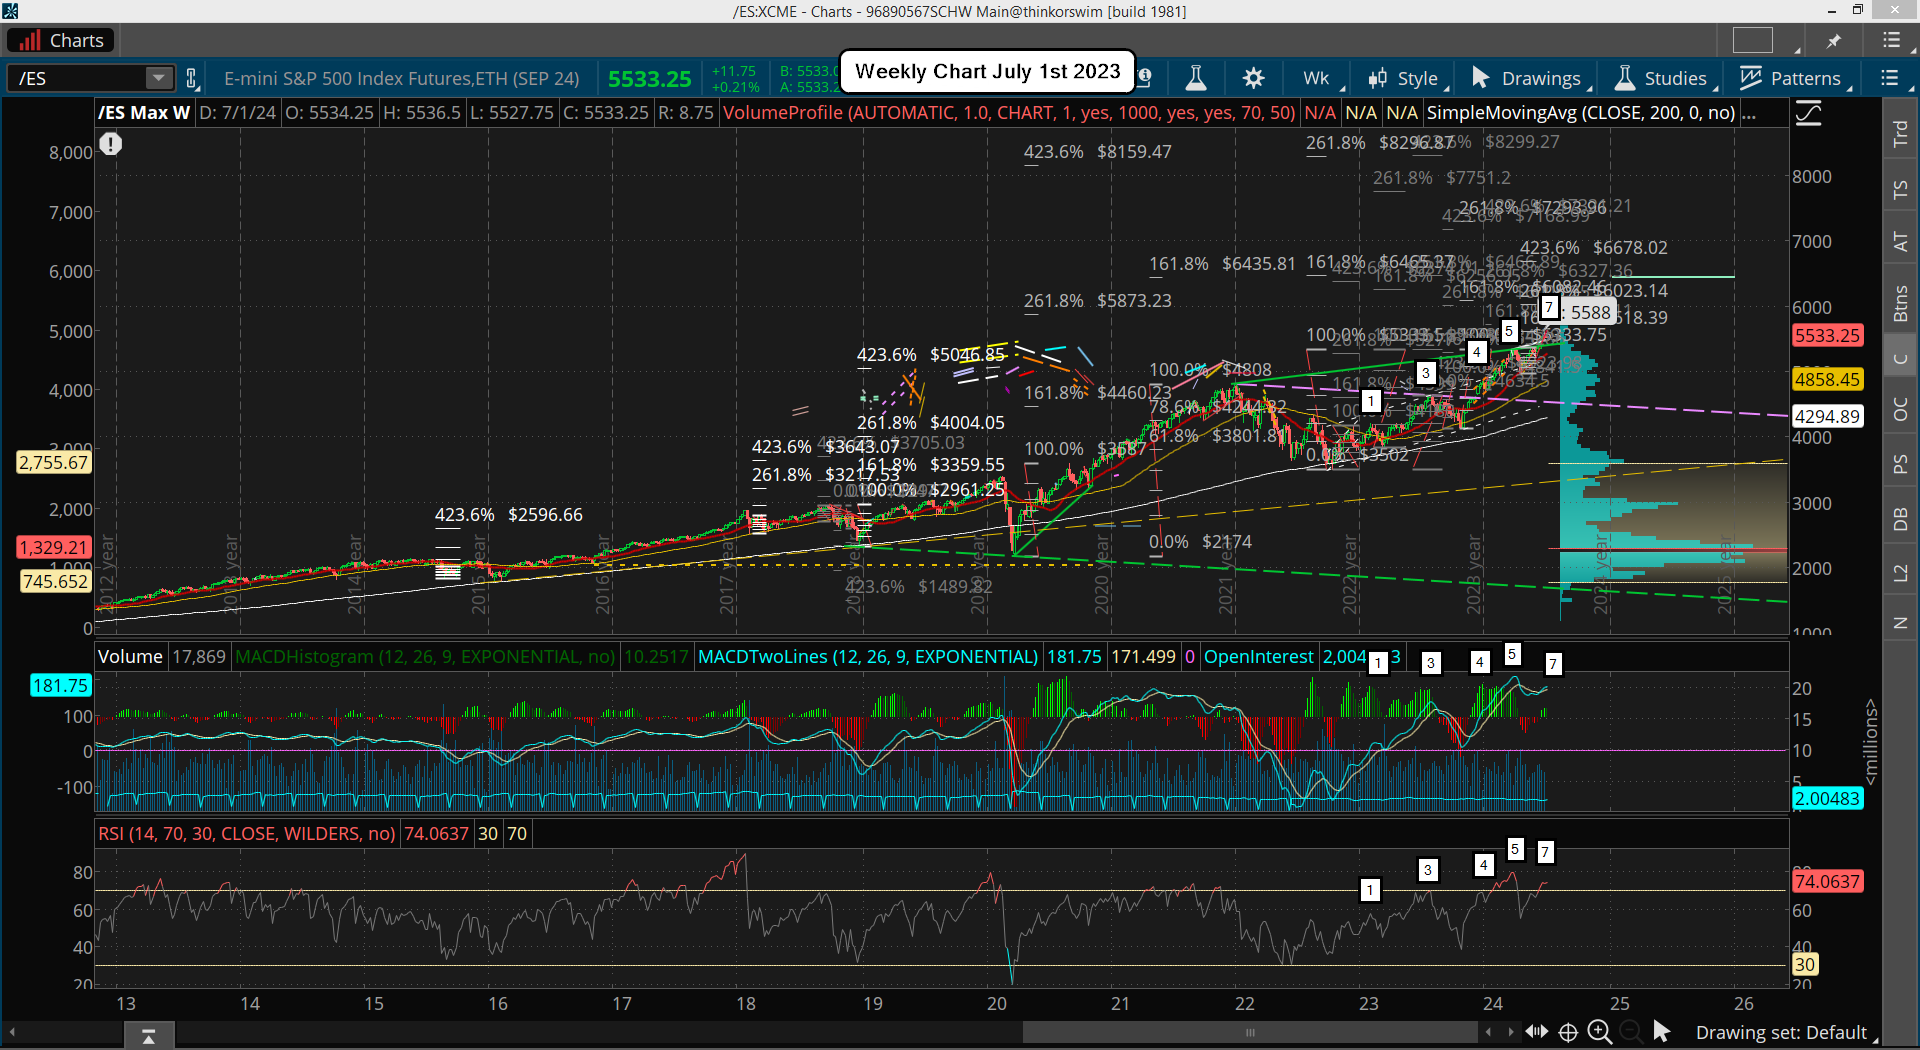
As you can see now on the weekly (and daily) charts the pullback from point 3 needed to be a bigger one because both the charts got overbought on the MACD's and RSI. When more time frames align together there's always a bigger move, whether up or down, and in that case it was down.
At point 4 the weekly chart was pushing up strong again on it's MACD and RSI, reach the same overbought level as on point 3, but that strength keep the pullback small from the daily. Point 5 is where the weekly chart got very overbought on its' MACD and RSI but the daily chart only a little overbought, which is the opposite of point 3. But it still produced a nice pullback as pressure from the weekly forced the daily chart to rollover. As you can figure out by now the deepest pullbacks were from periods where both the weekly and daily charts got overbought and I must conclude that from looking at both charts currently they appear to be overbought together again.
Therefore there's little left on the upside on my opinion before we see a nice pullback. My FET at 5618 is still on the table I think and should be hit this week. I say that because of the expected light volume due to the holiday on Thursday for the 4th of July. But next week every trader should be back and the volume with it. So going into the 2nd week of July is where I think we could see a nice pullback happen.
Have a blessed day.

