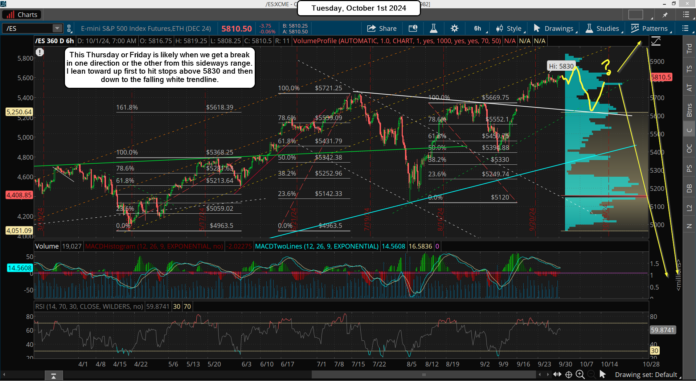
We got a small pullback yesterday but then a late day squeeze came in and stopped horizontal support from breaking. This might continue all week long and turn the wave 4 pullback into a sideways correction, which will still be a valid wave but a frustrating one for any bears that are trapped or bulls wanting a pullback to get long at. It could also be just an A wave inside an ABC pullback for wave 4 that could still have a C down later this week to that falling white trendline of support.
This market feels more like it's just waiting for some kind of news event to rally higher (or sell off?), which might be this Thursdays Jobless Claims number or the Employment Situation on Friday (more commonly called the Non-Farm Payroll Report).
If we go into it with a low then I'd look for the NFP Report to cause another rally after it. Of course if it's at a high into it then I'd look for a pullback. Or, we go into it sideways, which would be the hardest to figure out. I lean toward that happening as it will keep everyone guessing. If that happen the market won't rally much from it most likely because it won't have pulled back first to get short term oversold. I'd then look for 5850-5860 to hit the stops above 5830 to be the target.
Then we should reverse back down and start either the wave 4 that I'm looking for, which would be to the falling white trendline, or to start the big drop to possibly the FP on the SPY at 483 as the top "could" be in at that point? There is no way to really know for sure on the move to 6000+ that many are looking for. If we drop to the support zone, where the white falling trendline is at, into next Monday or Tuesday it will be up to the Fed to say something positive on Wednesday the 9th at the reading of the September meeting.
Of course Powell and leak something out at any point really but the market will want to hear that they are doing more rate cuts to get going up strongly again with that 6000+ target in mind. If they disappoint and say no more rate cuts the market will fall off a cliff and the top will be in I think. Bottom line her is that I think we need more time to pass before it will finally exhaust itself. Then a pullback should start of some degree.
Have a blessed day.


We’re getting preliminary sell signals. Stuff that one sees before the start of a decline but doesn’t work in a raging bull market.
The 30 day simple moving average has remained above a certain indicator which is indicating market uncertainty. In a bull, the indicator would be above a trending rising 30 day average. This is the pattern seen at major tops like in 2021-2022.
The 13 day simple moving average has caught up to the market (which partly indicates exhaustion). The SP 500 dropped to it today but did not close below it.
So there is still a chance that the market might make one more final high (wave5?) like was seen when the SP bounced off the 13 day average in late August. A drop below the 13 day average would indicate the decline is on.
Tomorrow there is a solar eclipse so we could see either see a top or something nasty. It will have a near square with Mars and a few other minor planets are in the mix.
The 17 year cycle ties into 1973. I will elaborate on that later.
One sign that the SP 500 top is in from last week: The rally from the August low was a Fib 61.8 percent of the move in trading days to the rally from the April low into the July high. It was also tied into the high of July 27.2023 and the October 27, 2023 low although the SP made the high on the 26th last week. The Dow made the high on the 27th. Also, we saw a weekly topping bar for most indices.
Stop run above 5830 this Friday after the NFP and then down into next Thursday to 5550-5600 is what I think.