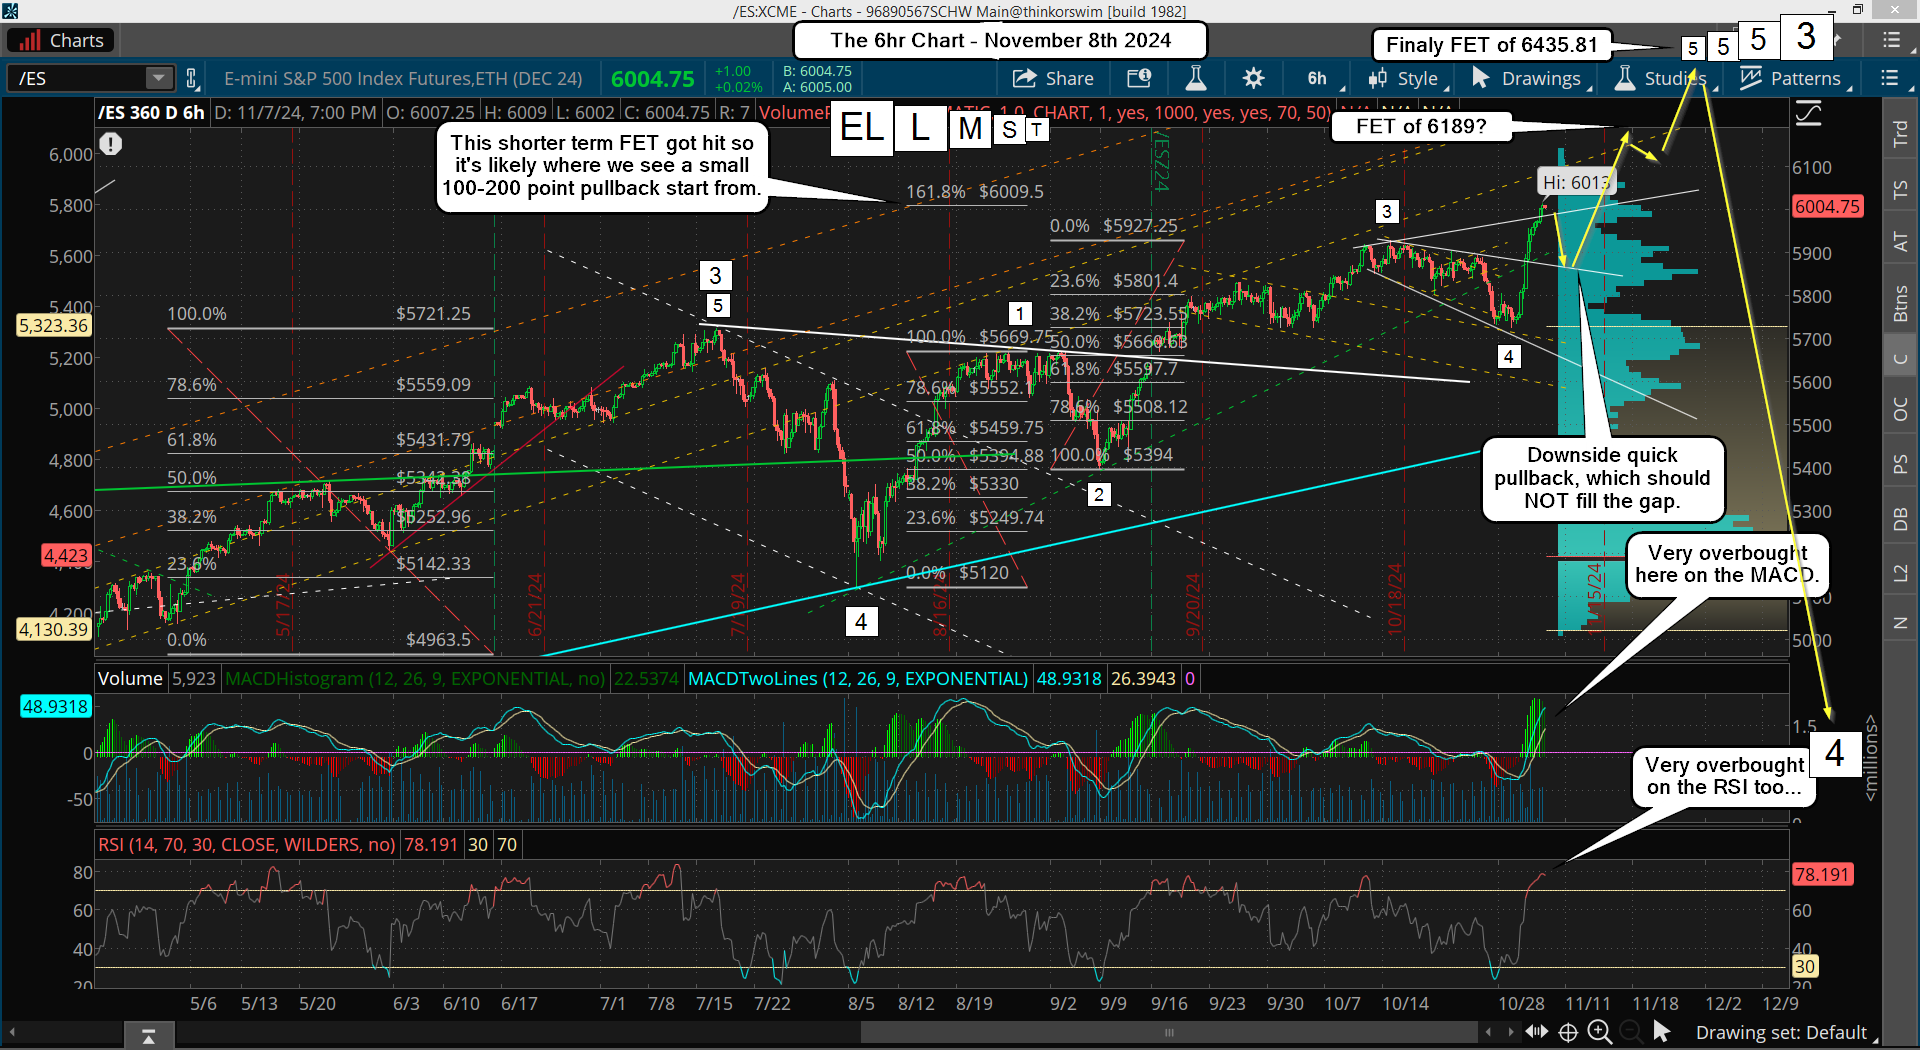
This market clearly has legs and wants to skip any good pullback (like my dream of going down to the 533 FP) and is likely going to just continue higher until it hits the final high. Yes, there will be some pullback but it might just be 100-200 points and very fast, and short lived too.
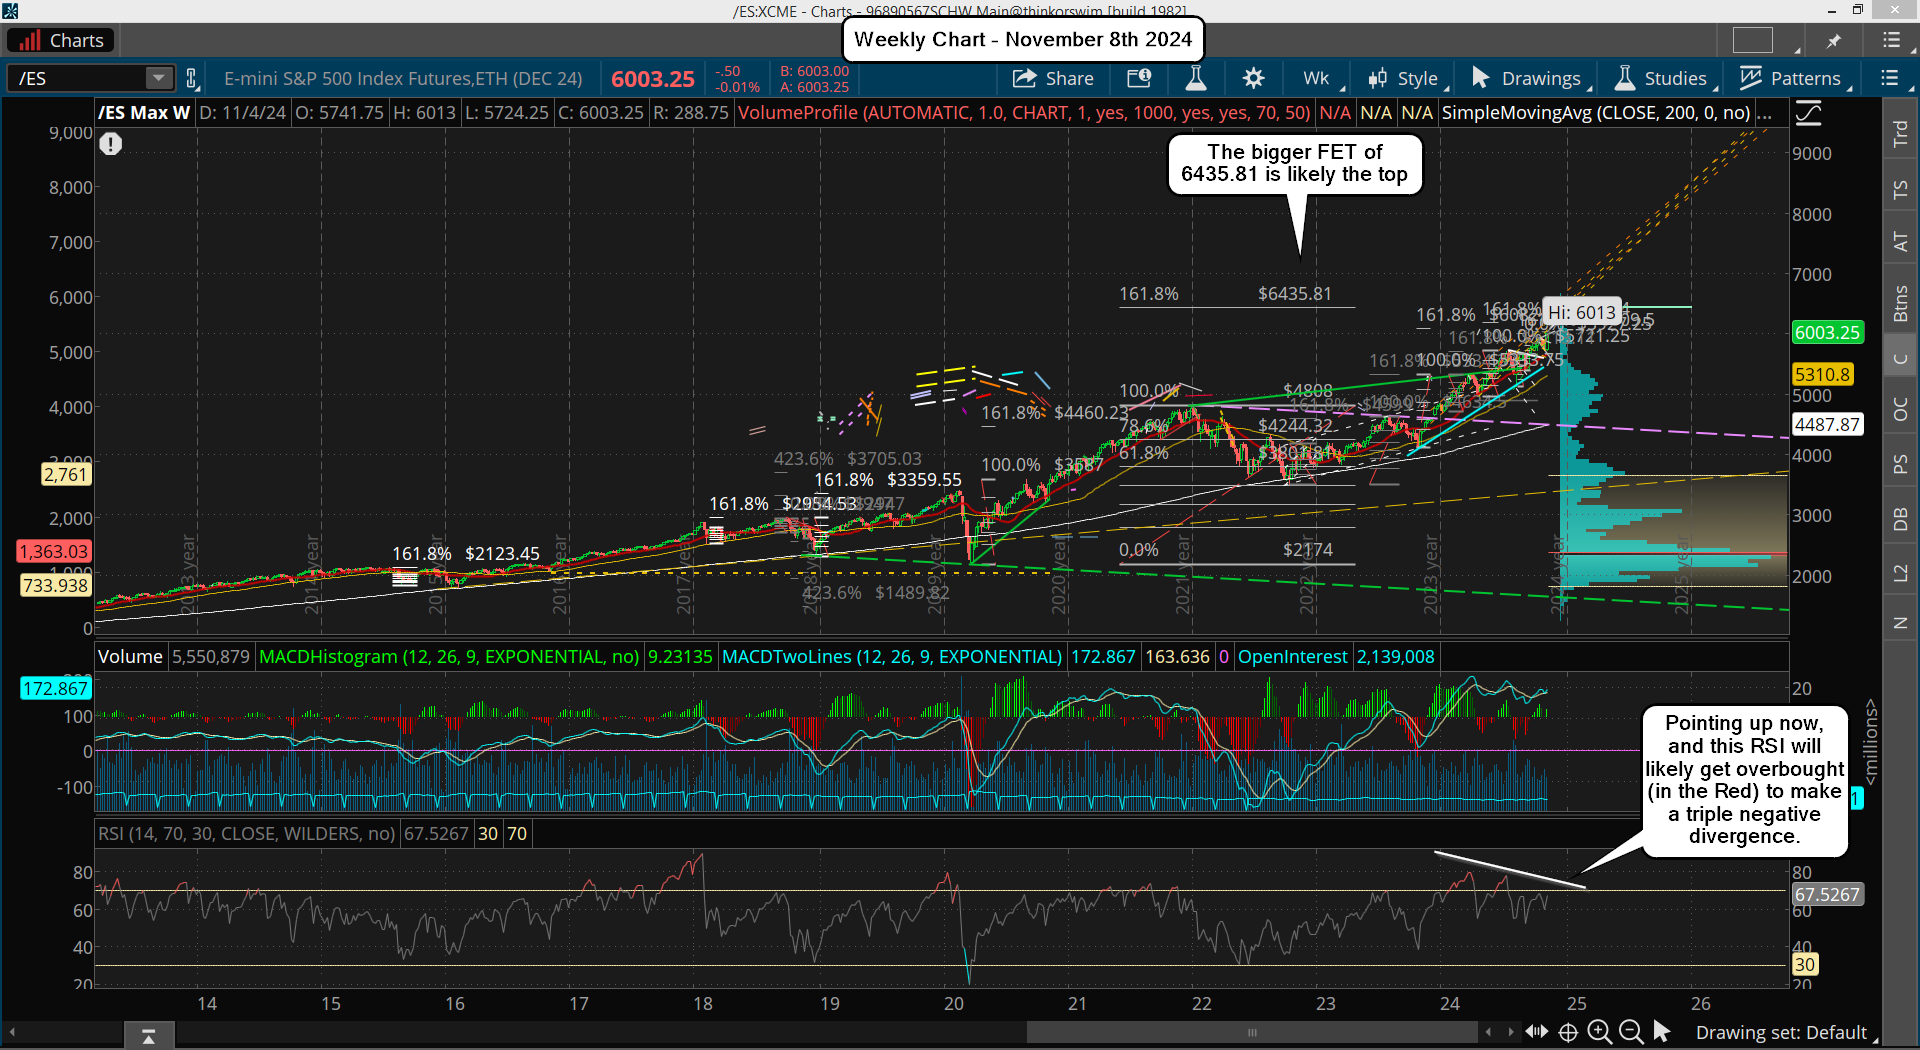
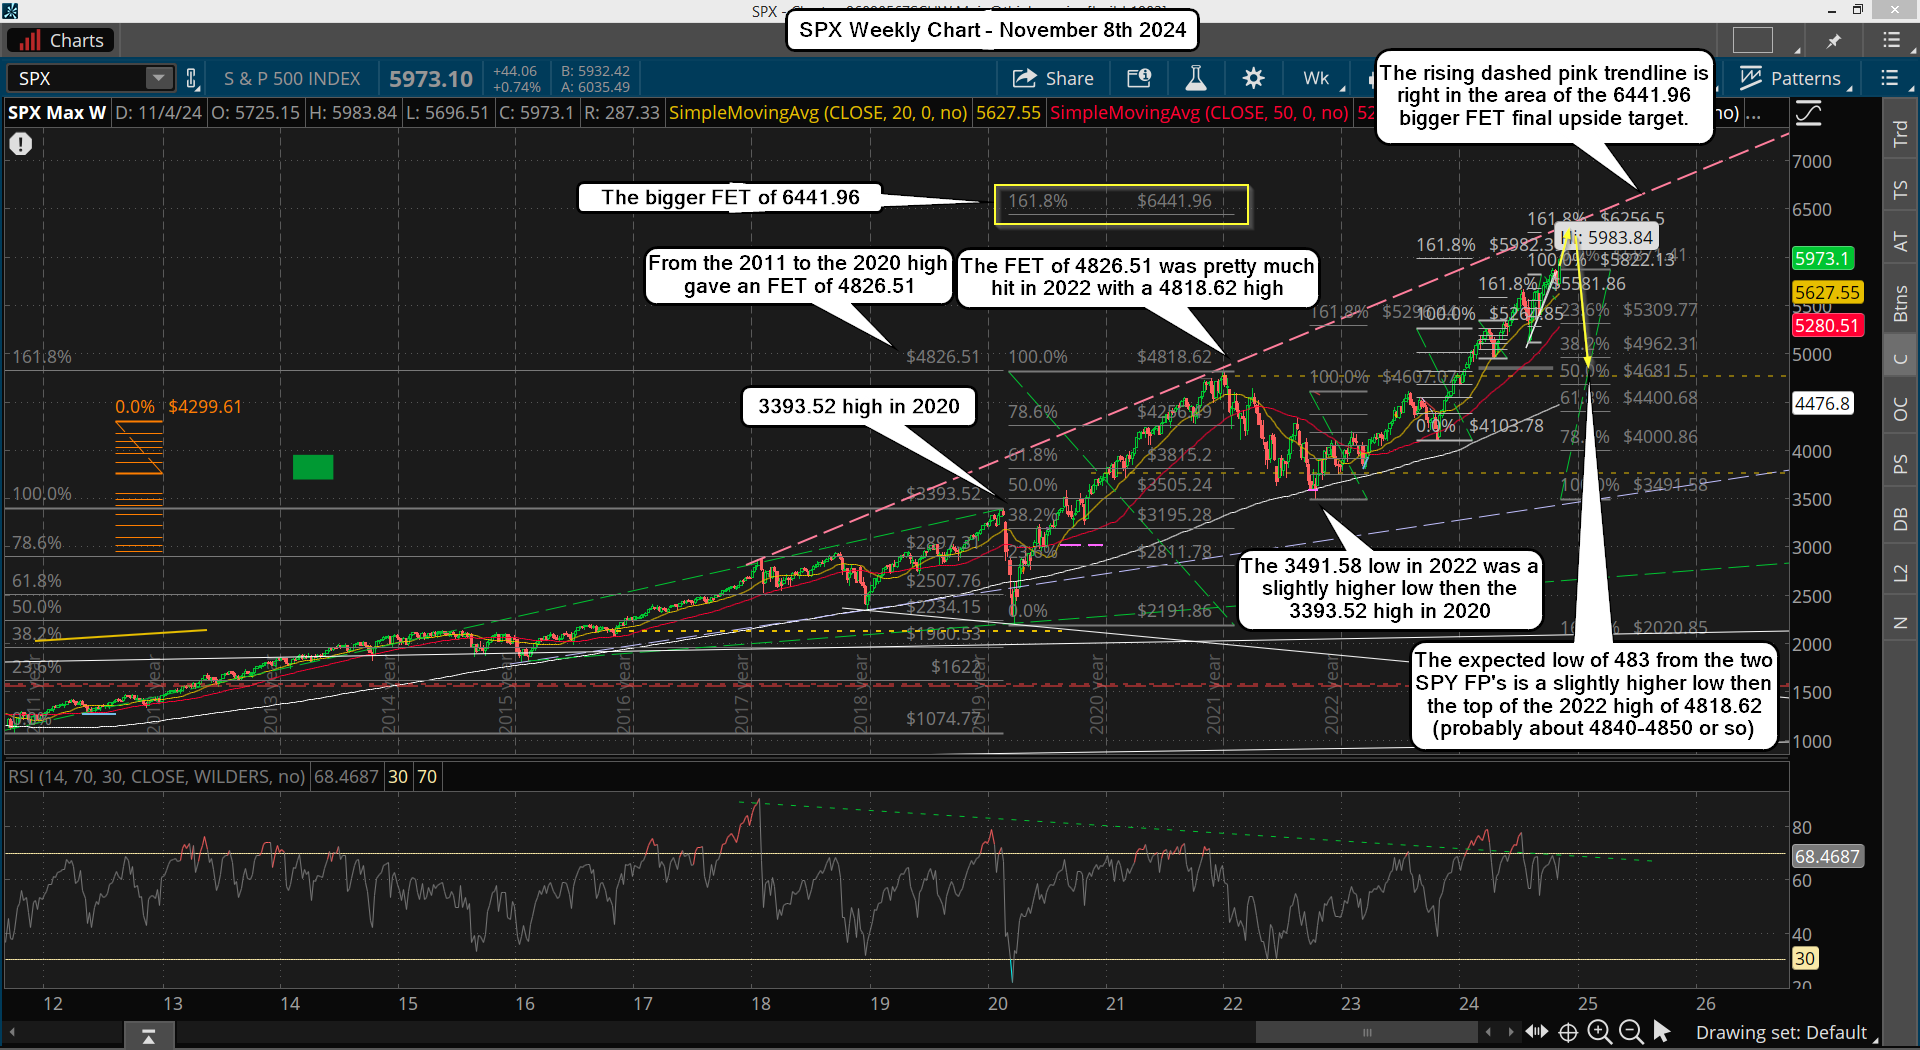
I think the final high will be my FET at 6435.91 as it was created from the 2020 low up to the 2022 high and since this is a massive blow off top that one seems to be most likely. This should be the place where Nivda will hit its' upside FP of 160.22 I'd guess. Below is a weekly chart of the ES showing the Fibonacci Extension Target and that rising trendline.
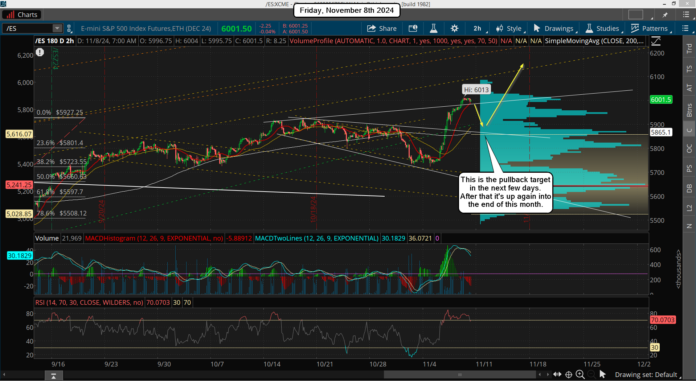
Shorter term FET's seem to be places where shorter pullbacks happen, and since we hit my FET of 6009.50 yesterday the 100-200 point pullback can happen at any time now... possibly next Monday or Tuesday? It will suck in all the bears thinking the final high is in but I don't think it is. This breakout is too strong and is likely going to rally up all of November to hit the bigger term FET at 6435.81 (6441.96 SPX) as shown on the weekly chart. The short term drop should hit the falling white trendline of support (in the middle) on this 6hr chart below.
It's around 5865 roughly, depending on "when" you hit it? I think early next week, like Monday is most likely. Just release some bad news over the weekend to gap it down and it will get everyone super bearish, plus it will shake out the bulls. But it should hold and from there we should go back up the rest of November to kill every bear on the planet.
By the time we top in early December everyone will be super long and afraid to short. Then out of nowhere some event will trigger the drop, which I don't know what it will be but it should fall off a cliff and the downside target on the SPY of 483 from the 2 fake prints I have will be hit before the end of the year.
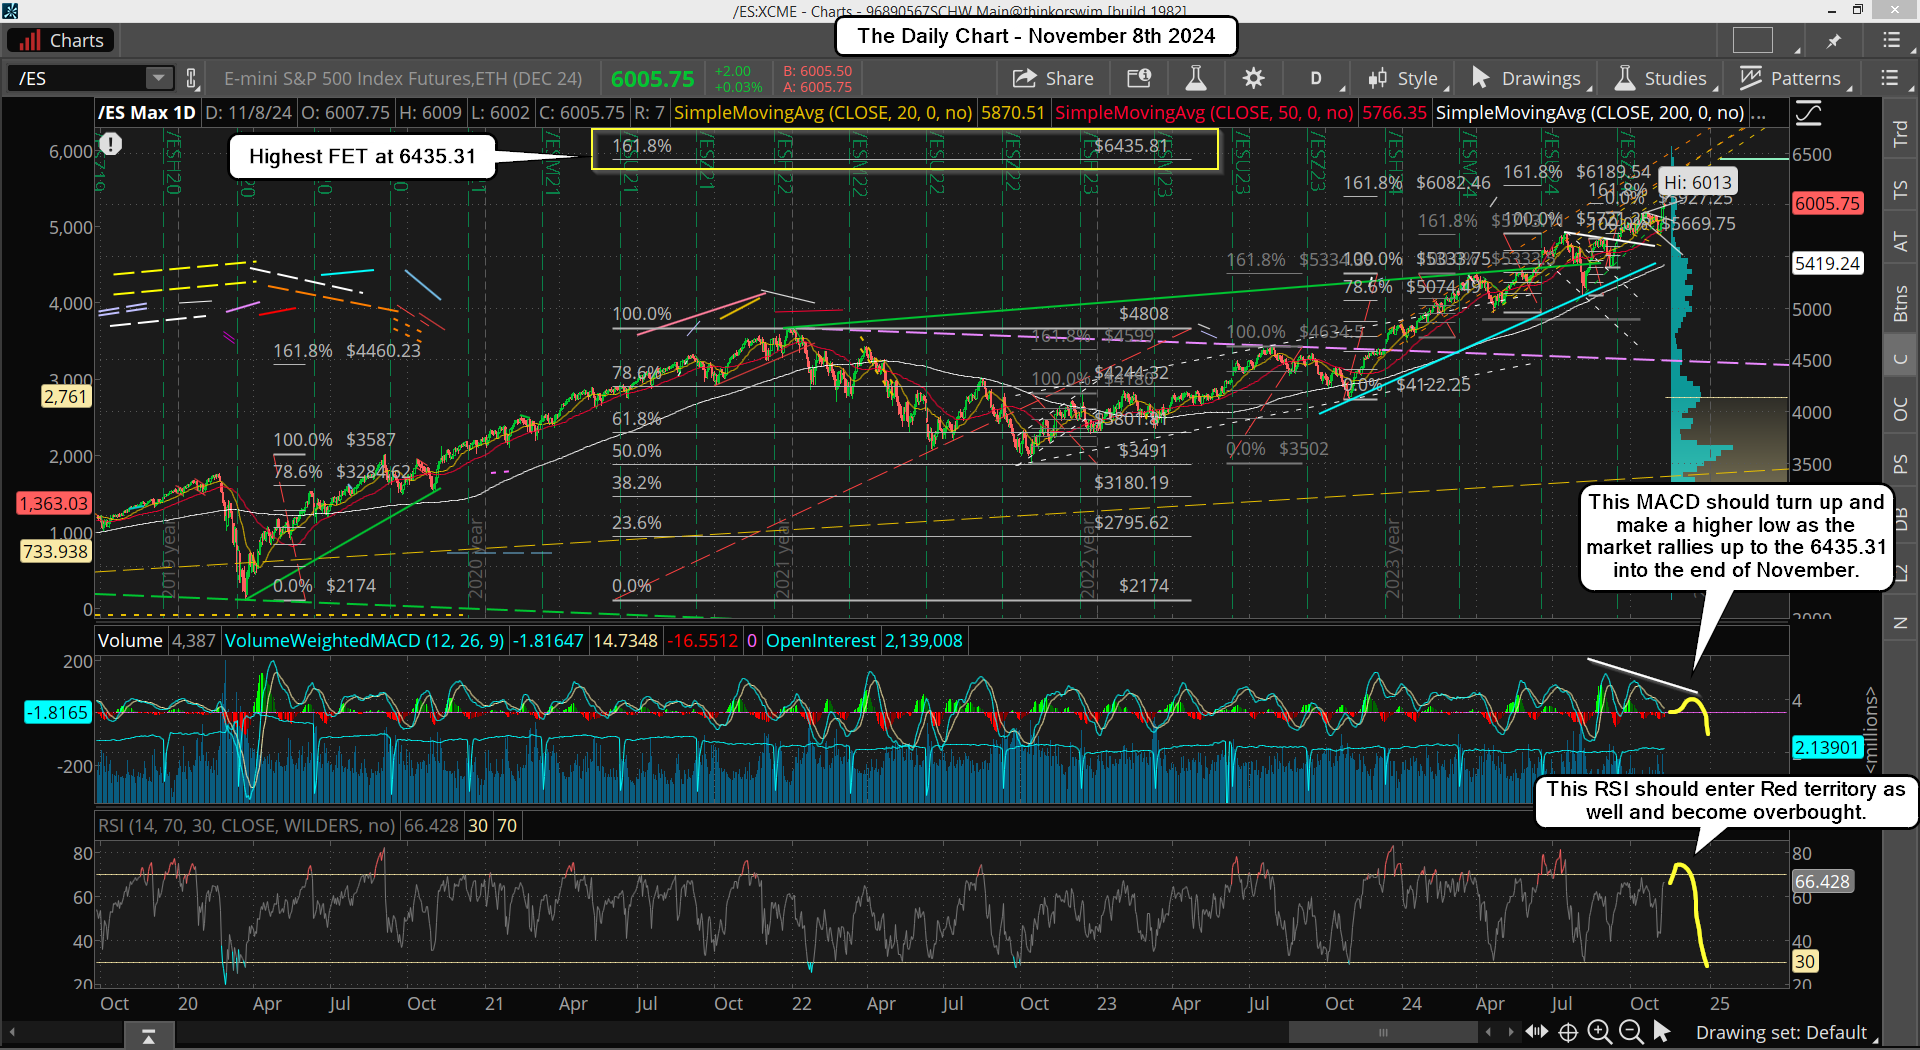
Crazy, I know... but I think the market loves to trick the most traders and that kind of move would do it. January will still be a huge rally month but it should only be for a lower high, like 61.8% retrace or something. Below is the daily chart...
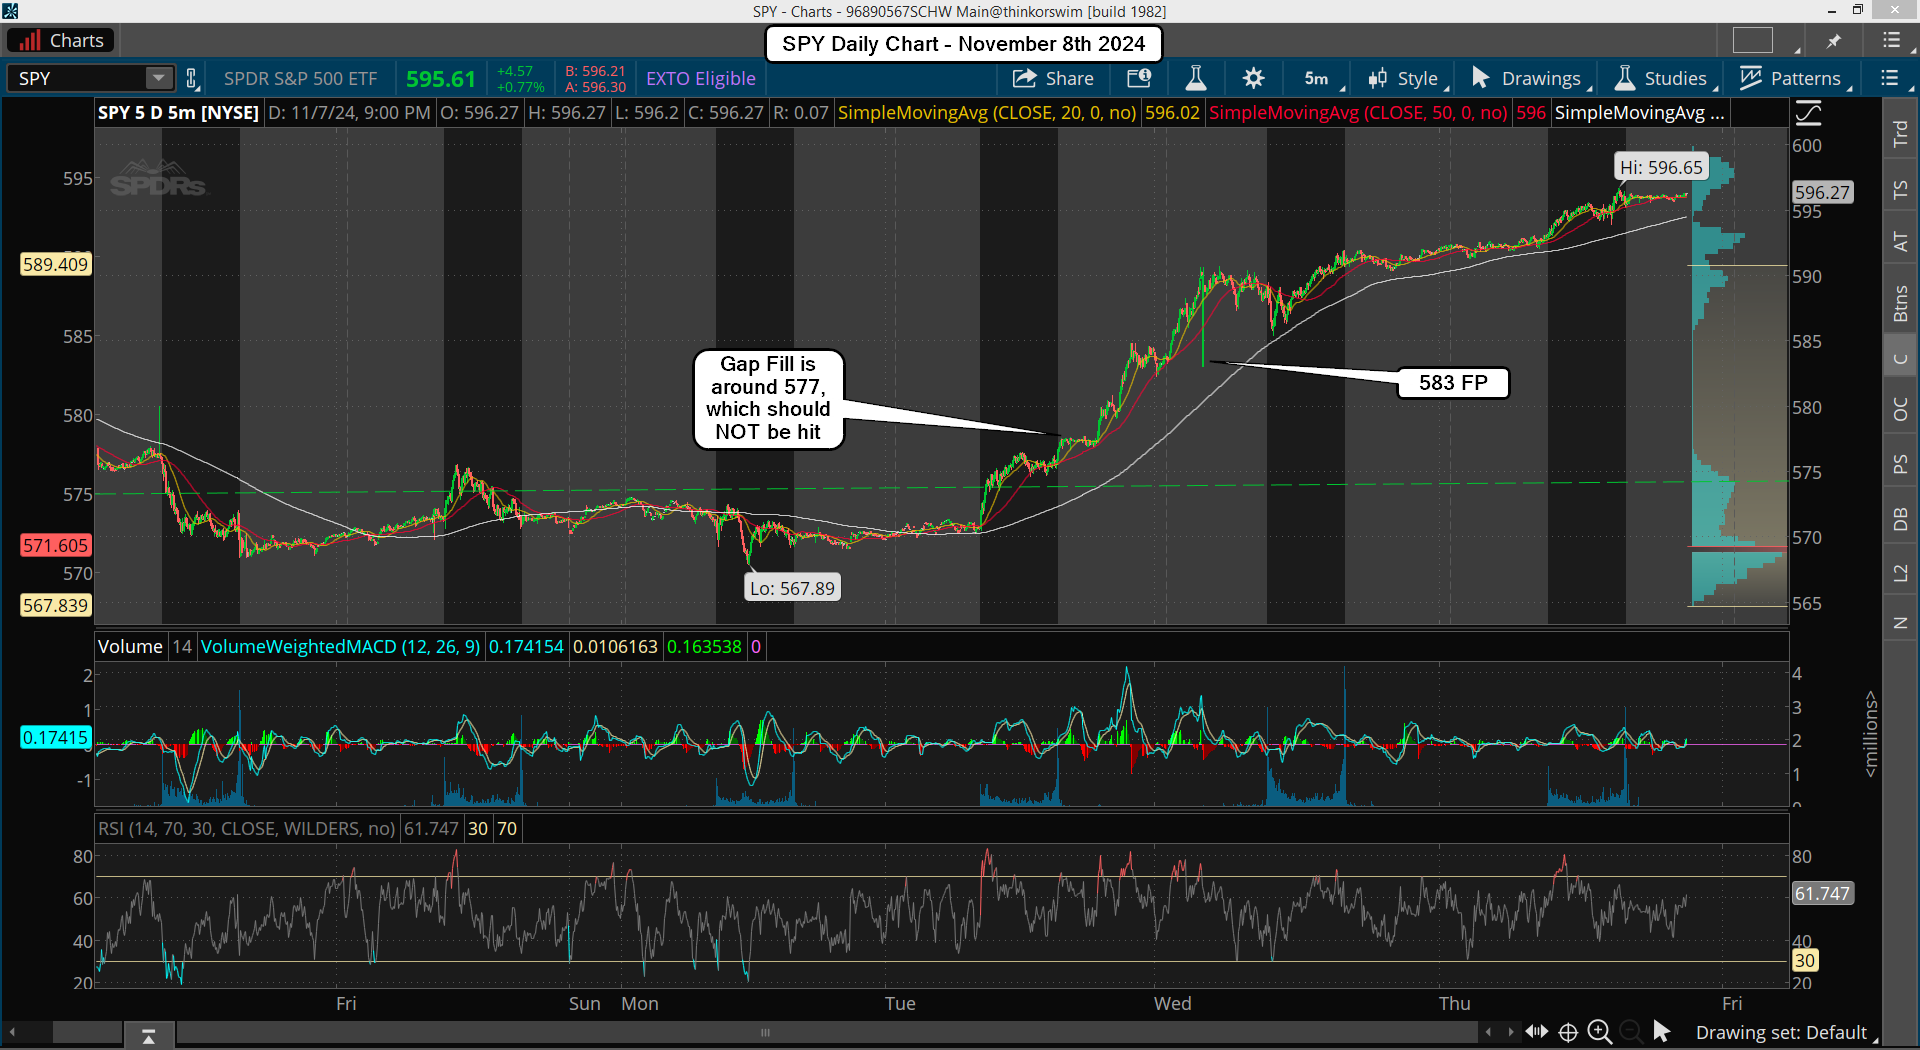
On it you can see the RSI still has room to go higher before it gets fully overbought, and I think it will be by the end of November. The MACD will hook back up and make another lower high as the market tops out, which will be a triple negative divergence. This market is preparing for a flash crash in December but the "event" to blame it on is unknown. I think the low will be the two FP's of 483 on the SPY, and the 533 FP will probably be the first low... like the A wave down. Then a B up and the C down will hit the 483 FP to end it.
My main reasoning for thinking this is based on the past and what happened in similar cases. On my weekly chart of the SPX (below) I noticed that the bigger FET that started at the 2011 low of 1074.77, up to the 2020 high of 3393.52, put out an FET of 4826.51, and we topped at 4818.62 in 2022, so that was a perfect hit. From there we dropped to a low of 3491.58 in 2022, which is super close to the 3393.52 high in 2020... so it basically erased that 61.8% rally up that was projected from the 2011 low to the 2020 high.
Isn't it interesting that the two FP's I have on the SPY point to roughly the 2022 high of 3393.92? They are a "slightly" higher low then that level, which is exactly the same for the 3393.92 high in 2020 compared to the 2022 low of 3491.58... and that my friends is not just some random coincidence.
The market is run by algorithm's and it's telling you (me) via the fake prints that it wants to repeat the prior pattern. The big question is... can it all happen in December? It took about a month to bottom in the 2020 crash, so I guess it could do it again without to much trouble. Or we just get to the 533 FP in late December and a rally in January of 61.8% does the B wave, then the C wave last into February or March.
That seems like a nice and clean decline like the 2022 correction. Will it be that easy or will it unfold all in December like the 2020 crash did? I lean toward the flash crash model so that Trump doesn't get the blame for it and while he (or any president) does not control the bigger cycles in the market they can manipulate the short term with the Fed pumping money into the system behind the scene. Is that happening right now? Probably.
And let's face it, the Deep State is in full panic mode right now and they must be thinking about doing some kind of False Flag event before Trump takes office in January. Therefore it's not logical to think we'll have a clean decline. A flash crash drop is more likely I think. We shall see.
Lastly I want to point out a "possibly" FP I have on the SPY from Wednesday morning before the open. It's at 583, which is probably the 5860-5870 area on the ES. That's the exact area I'm looking for the short term pullback of 100-200 points go to. I'm a bull if that level is hit in the next few days.
Have a great weekend.



Everything is in an uptrend right now. We are a few days away from even getting the most preliminary sell signal. RSIs on the 60 minute charts for the indices are extremely overbought but they still need to make lower high divergences.
Mars Pluto are opposite each other now and loosely so for a week or so. Maybe Venus square Neptune next week could be a trigger for geopolitical action. It is a 11 month and it’s a year with a lot of 11s. It’s also 83 (11) years from a certain little incident in this year of 24 (3×8).
If we get a pullback next week I’m getting long as I really think we are going to have a huge blow off rally into early December.
You should know by now my old friend how accurate the FP’s are. We will see NVDA hit its’ FP at 160.22 before any big drop happens. We’ll get some small pullbacks but no final top until it’s hit. It will be close to my FET of at 6435.81 on the ES too I bet.