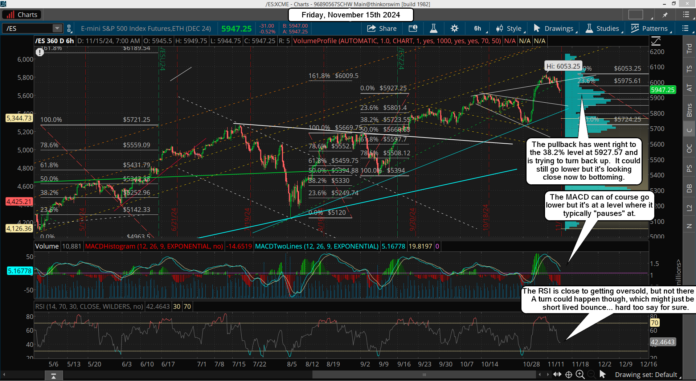
I posted on Twitter an update yesterday as it appears the market is indeed unfolding in an ABC down and we were in the C part yesterday. Once it finishes, which it might do so at anytime, or go deeper to that "possible" FP on the SPY of 583 (about 5880 ES?) as that's also around the 50% retracement level, we should be fully oversold and will complete Small Wave 4 down.
Some think the high is already in now and that we'll only go back up for a lower high next week, which is certainly possible, but I think we go higher. I still think the FP on NVDA of 160.22 is the final target high to get hit before this market finally tops and sells off hard. Below is that Twitter post...
https://x.com/reddragonleo/status/1857123456245985294
Now I can certainly be wrong as predicting highs (or lows) is super hard, but over the many years of track fake prints I do know they will be hit. What I never know is the "when" part. I have to guess at that using technicals, Elliottwave, Seasonality, etc... and I just can't see a really big drop (like down to the 533 FP on the SPY) happening before that upside FP on Nivida is hit.
With short term charts getting close to oversold on some time frames and completely oversold on others the technicals tell me there's one more rally left over the next 2 weeks, so if the bulls don't blow it here they can still hit the FP I think. If I'm wrong and the top is already in then the upside target won't be reached until late January as we are going to have a nice pullback in December.
As for today, I don't have too much to add. We could have already bottomed or we go a little lower to the 38.2% level at 5927.57 or as deep as 5888.75, which is the 50% level and around where that possible intraday FP is on the SPY of 583.
Have a great weekend.


I think we rally to one more high. There is a possible low low high in 2 weeks. April low to August low +16 weeks later. My weekly exhaustion indicator should be getting in “exhausted” territory by then.
The 60 min RSIs need to make a new high with a lower high divergence. The sell signals came on fast last week.
Some charts are displaying August 1987 final blowoff high patterns XLY and Oracle. The 2000 Nasdaq chart from January to the March high can be discerned in the 2024 chart. The April low was the initial January 2000 low, the August low, the secondary Jan low and the rally since then comparable to the Feb-March 2000 final rally.