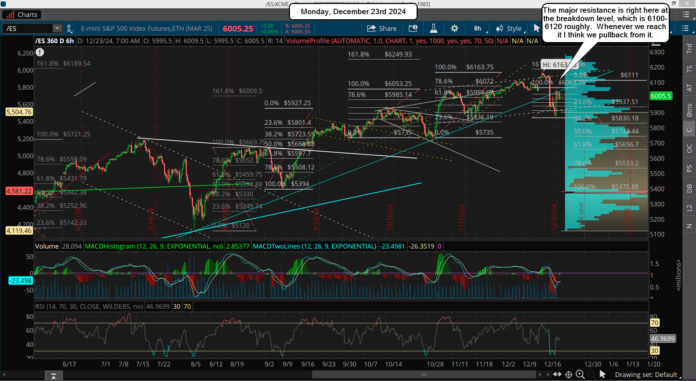
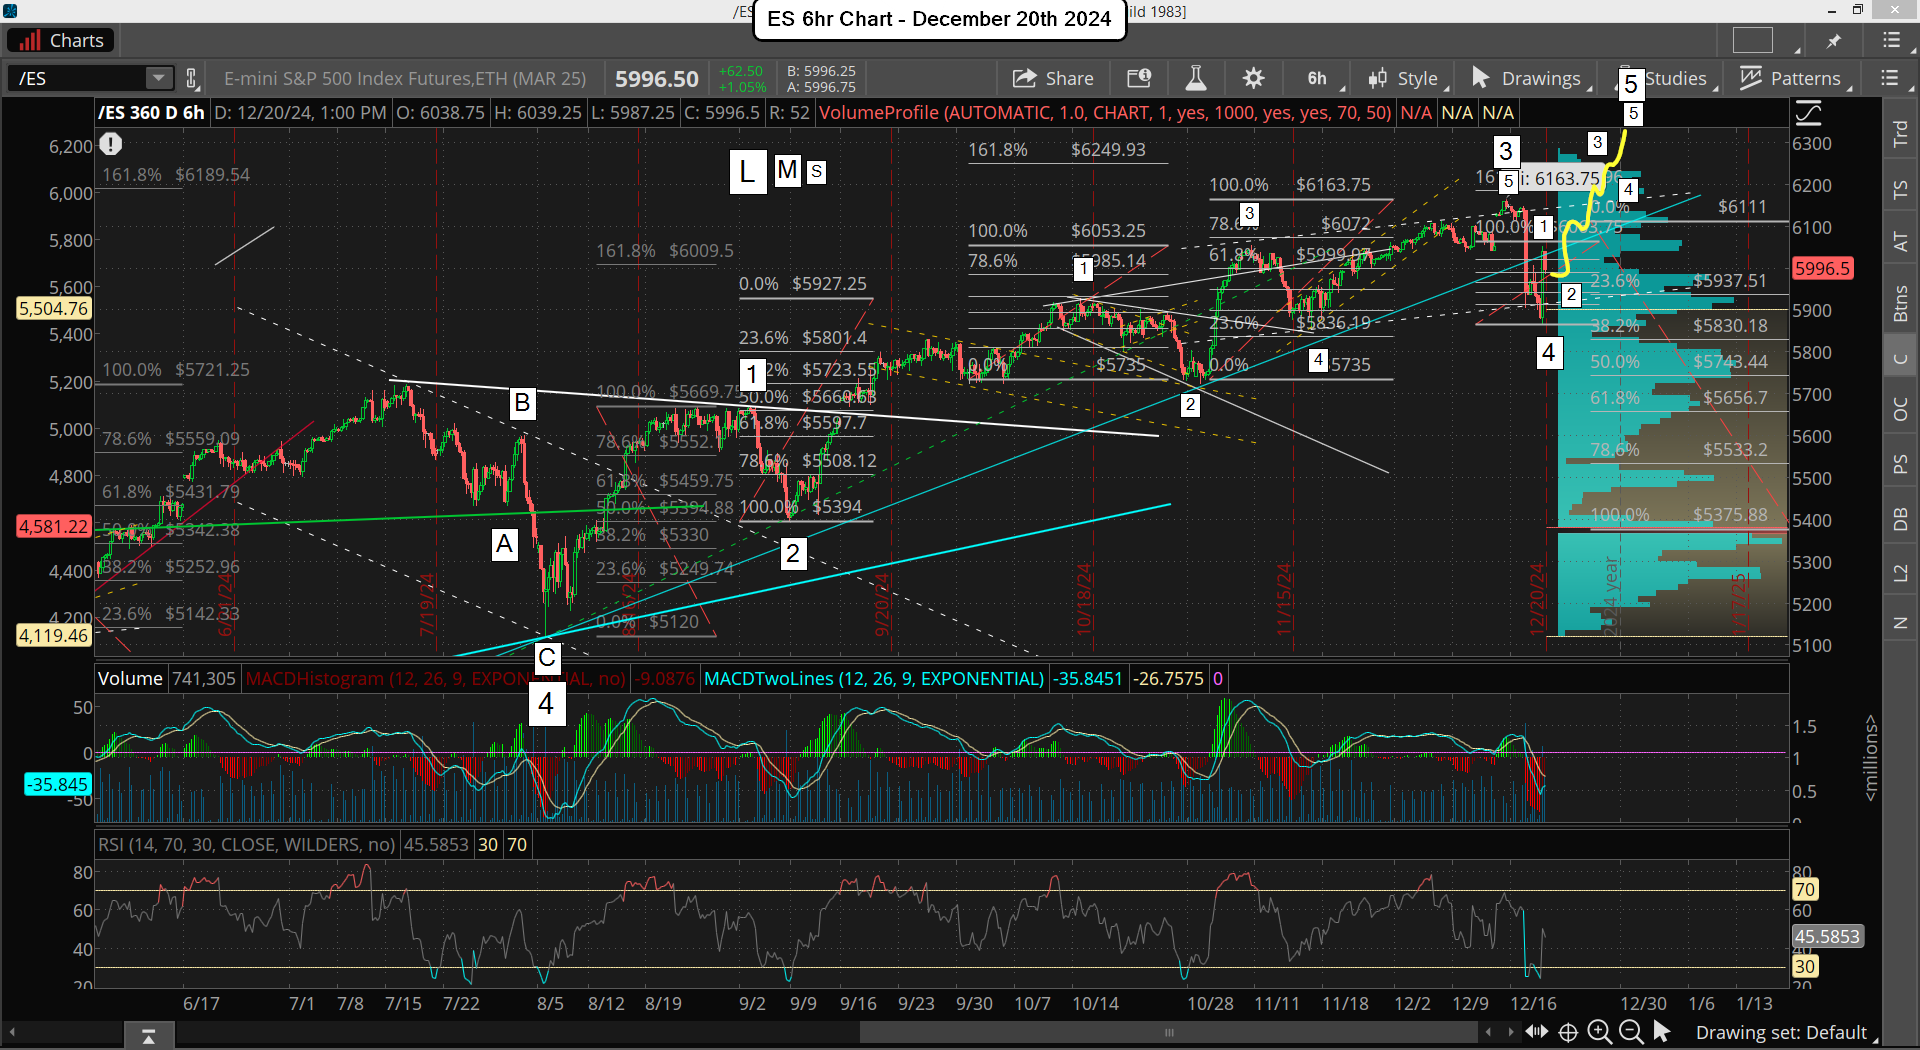
The bottom appears to be in for the pullback, which was a wave 4 of some degree. We are in the final wave 5 up now, which will likely unfold in 5 smaller waves. The move up from the low last week was the wave 1 inside wave 5, and we started the wave 2 from that high of 6050.75, which means this week we should do the wave 3 up inside wave 5 up.
That wave 3 will probably subdivide in 5 waves as well and could last until the end of the month, hard to say for sure. Then a wave 4 pullback inside wave 5 up and a final wave 5 of 5 up to end it all. It might complete before the end of the year but it's looking more like it will drag into the first week of January... again, that's just a "best guess" on the time.
It could be faster of course but I'll be focused on everything, which is the wave count, the technicals, the Fibonacci Levels, and "time windows". On the new March contract of the ES I've calculated 2 more "possible" blow off tops, which are a Fibonacci Extension Target (FET) of 6249.93 and 6428.72, which seems impossible to hit the higher target but I have to be open minded and allow this to play out.
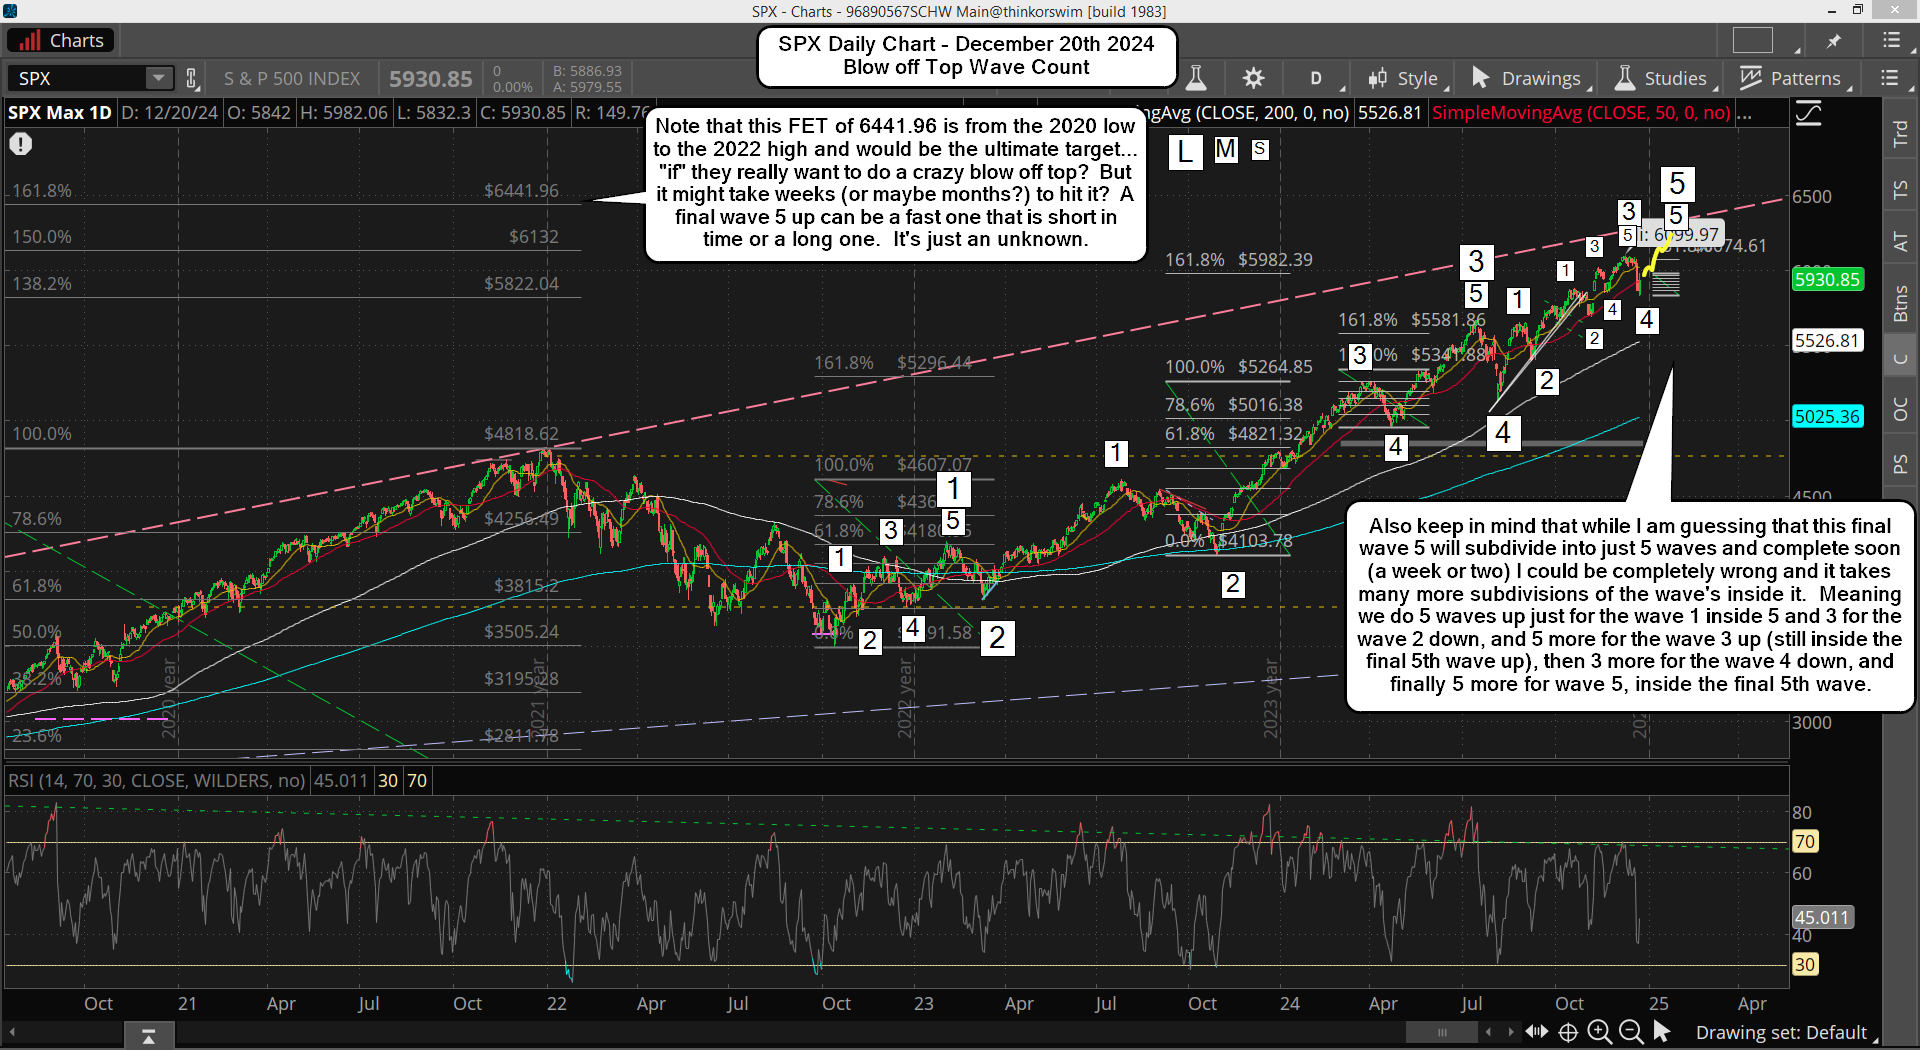
On the SPX Cash those levels are roughly 64 points lower due to the very wide spread between it and the new March contract of the ES Futures, but will narrow over time. Below is a daily chart of the SPX with the wave count on it.
And on the 6h chart of the ES below is what that wave count would look like... "if" we have a blow off in the next couple of weeks?
These last few months of moves up and down make it hard to know for certain the smaller degree wave counts but I think it's right on the bigger ones, which are the most important anyway (at least if you are trying to find the final high). Now it does look like it's going to drag into the first part of January to me (at least), but if we get some kind of crazy huge squeeze this week and into next week then it could end this year, but it's not looking likely to me right now. It just "feels" like it's not going to be an easy top and that it's going to drag out for longer then one expects.
If it's going to drag out longer then we could see the FET of 6441.96 on the SPX hit, which might take several months to happen. I mean it could drag into April or so if it really starts subdividing a lot.
The wave count, starting from the Large Wave 4 bottom on my SPX chart, doesn't look right to me. I think the Medium Wave 1 up and 2 down are correct but the Medium Wave 3 up seems like it's missing some waves. What I mean is that it feels like where I have the Medium Wave 5 and Large Wave 5 marked should just be the end of the Medium Wave 3. Then a deeper pullback should follow (then the recent one we had last week) for Medium Wave 4, followed by a Medium Wave 5 up into March or April. Below is that chart...
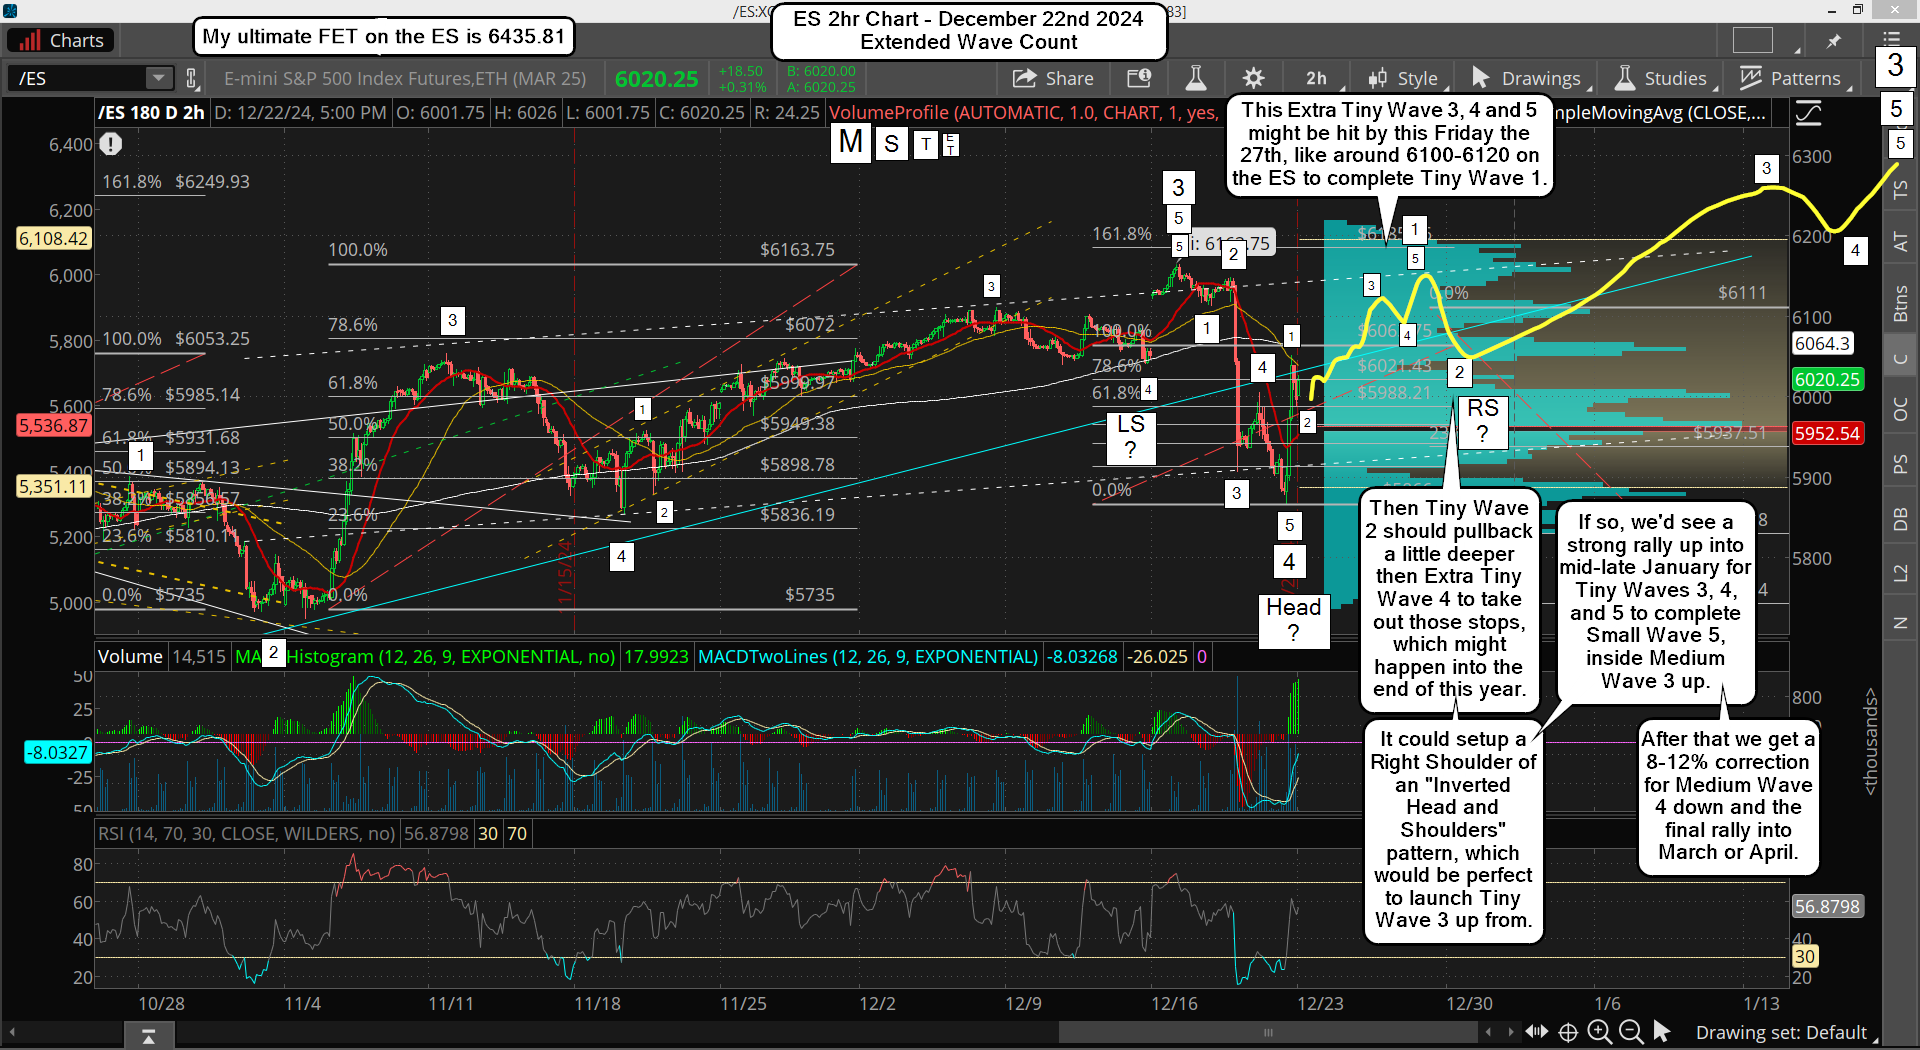
Now again, it's just a "best guess" of course but it makes more since to have the Medium Wave 3 moved to where I show it now on that SPX Extended Wave Count Chart. It means that the 12/6 high of 6099.97 is just the end of Tiny Wave 5 up inside Small Wave 3, inside Medium Wave 3, inside Large Wave 5.
The drop last week after the FOMC would then be Small Wave 4... NOT Medium Wave 4! It looks like a small wave correction to me as a medium wave one should be a larger percentage. If I'm right we'll make a higher high into mid-January to complete Small Wave 5 up inside Medium Wave 3.
Then we should see an 8-12% correction for Medium Wave 4 (in an ABC I'm sure) into February or March. Lastly we'll see a final blow off rally for Medium Wave 5 up into late March or April..
I'm really leaning toward this Extended Wave Count now, but again I'm open to see a blow off rally happen in the next couple of weeks. But personally I don't think it will. I think there's too much negative news out there about some January crash, which means the opposite should happen. We should rally up in a 5 wave series (Tiny Waves) to complete Small Wave 5 in mid-late January, which then completes Medium Wave 3.
Moving on to the short term. Below is a 2hr chart of the ES with the possible wave counts marked on it.
In closing, I lean toward the extended wave count as that will do the most damage to the bulls and bears both I think. I have the FP on NVDA that has yet to be hit (160.22), which likely would be if we get this extended rally.
And I have a new FP on the SPY that has a crazy upside target, which fits right in line with the extend wave count, and would be a little higher then my ultimate FET's on the ES and SPX. So I have more evidence to suggest we go much higher and drag out in "time" versus what I'd like to see of some blow off crazy squeeze in the next few weeks.
Have a blessed day.


