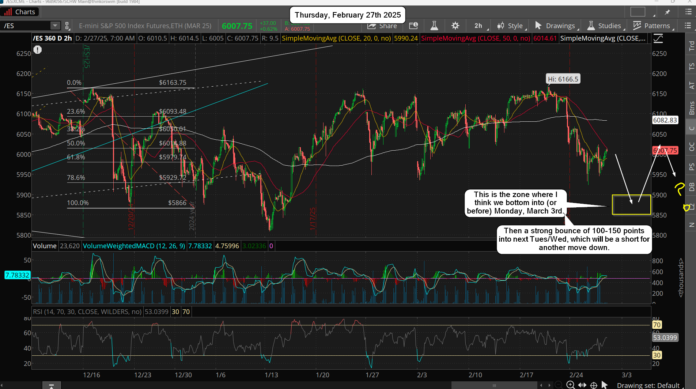
I'm still looking for one more lower low that takes out the 5924 low (ES) on Tuesday. I don't see it getting all the way down to the 1/13 low of 5810 as that's too obvious. I think somewhere between 5850-5875 will be enough to take out any longs from this Tuesday and lure in some bears.
Then I expect to see a face ripper rally of 100-150 points, which will likely be "about" a 38.2% retrace from the top down to the bottom that is made. The high yesterday was 6020, and that would be a magnet target for the rally into early next week. This assumes we get the low by this Friday, which I think is possible.
The expected low was for Monday, March 3rd, but if we reach it today or tomorrow I'll call that a successful hit as turn dates are always "windows" where it might happen a days or two early (or late). If we see the low hit today and the rally into tomorrow, where we reach that 6020 high by the close, I have to think we'll still get another pullback on Monday, but I don't think it will be any lower low but a higher low.
Basically, the move up to the 6020 zone would be an A wave and Monday would be a B wave, which might be half the move up? Hard to say for certain. But from there we could (should.. "if" this plays out?) see a C wave up into Tuesday or Wednesday for another hit of that 6020 zone, which I'd think will be taken out during that rally, but probably not by a lot. If we reach the 6060 zone it would be a wonderful short for another drop the rest of next week and into the following week. Now if we do not drop first (today or tomorrow) and rally up instead, then I'd expect to see the lower low move happen next Monday, which is the expected date anyway.
Have a blessed day.


We broke the 100 day average on the SP 500 and the monthly low so the freefall should be on. There is still plenty of firepower to the downside left. It is below the lower Bollinger Band so it should gradually hug the lower BB on the way down or put in a collapse day.
You’re pretty good with the turn days. I like the map you are laying out. I think there should be some followthrough into the next week. We could be following the last 2 week decline into October 4, 1929 following the initial high on September 3. There has been a similar pattern playing out but with more chop.
I think Friday will be the closest market day to the Rahu Neptune conjunction. It might be the basis for the 17 year cycle. The conjunction occurs every 17 years. The last one took place in April/May 2008. It didn’t pinpoint any turbulent market action.
I also noticed that Pluto was near the destructive current Uranus location in 1637 when the Tulip bulb bubble melted down in February that year.
60% AAII bears and it still plunged today. Put call ratios have been pretty low though.
I’ve actually heard more people citing the AAII numbers as a reason to be actually bullish than any expressed fear out there.