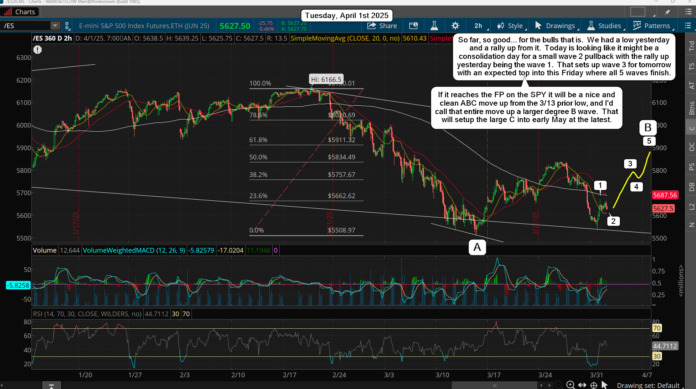
The market picked option 4 yesterday when I only had 3 options for the path it should take... LOL! The SPX made a new lower low, which was the Wild Card Scenario, and the ES made a higher low, which doesn't look like the Bullish or Bearish Scenario but a mix between them.
If I had to pick one I'd say it was the Bullish one as the early low happen (but not a lower low in the ES), then we rallied until around the 1pm period (EST) before we pulled back small for about 30-45 minutes. Then up into the close afterwards, and that's roughly what I wrote on the Bullish Wave Count from yesterday.
There's still big resistance in the 5700-5720 ES zone (I wrote on the chart 5720-5760, but it's lower I think), which is where the market will likely pullback at, or go sideways. If we can get there today and go sideways we could push through it Wednesday and Friday. It's hard to know what the price will be but the time will run out for the bulls this Friday (possibly into next Monday). After the clock expires for the rally the price will be whatever it will be, and the next move down next week should take out the lows.
We might see something similar to the 5/20/22 low, which could be equal to yesterday. We then rally hard into this Friday/Monday and start down next week. Back then it chopped from 5/27/22 until 6/8/22, and then fell off a cliff hard into a 6/16/22 low. That could be the early May low, and while patterns repeat over and over they never repeat exactly.
Possibly the chop period back then happens from April 23rd/24th until May 2nd? And the fast drop period from back then happens first... like it starts next week and ends into the 23rd/24th? The point here is that after this Friday the cycles are bearish again, and the expected low periods are the 23rd/24th and early May. As for that prior pattern you'll notice that the high it rallied into on 5/27/22 took out the prior high on 5/17/22. That would be similar to the recent 3/25/25 high getting taken out if we hit the FP on the SPY into this Friday.
Patterns rhyme all the time, and this would not shock me to see it play out. Back then that sideways chop before the last big drop was likely done to suck in a ton of bulls thinking the low was in. But currently everyone is super bearish so that might not be needed? Instead all that is required is the squeeze to the FP to get rid of the bears.
Then another big drop can start next week without anyone short... meaning they don't have to get a ton of bulls long but just need to get the bears squeezed out. I don't know if it's going to play out that or not but it's something to keep in the back of your mind when next week gets here.
If it repeats the same pattern as back then we'll see all of next week have big up's and down's repeatedly before it falls off a cliff. From a "Wave Count" point of view that would be a series of wave 1's down and 2's up in various degree's until a wave 3 of 3 of 5 sets up for that last big drop.
Have a blessed day.


This up close has created varied posibilities. At one point it looked like the pattern from October 2.1929. But it closed too high for that candle. The next two days are bearish astrologically, especially April 3rd.
We have room to run until the end of the week to establish the opening monthly range. We have room to run into next week for something even bigger. A certain little indicator is still heading south and by my calculations should hit a certain trend indicator today which would confirm the continued trend downward.
They kept things very bullish looking with this close but all TD downcounts are still intact. I would still look for a drop to the 100 week average and see how things are unfolding if we get there. This positive close doesn’t make any sense unless Trump revokes his tariffs. It’s a sign of a lack of fear.
If we follow the early October 1929 model (after the 1st week drop) we could then pop back up to the 50 day average and things would get pushed back to late April when there is some very harsh warlike astrology.
It was 8 days up from the 3-13 low into last week’s high. Another 8 days down to a 4-4low?
I don’t think they are going to waste some prime Venus and Mercury retrograde especially while all these planets are aligned with them in Pisces.
Actually we’re back to the early April 2000 Nasdaq pattern model. Pattern match the last two days.
I still think we squeeze into this Friday with the FP on the SPY as the target (586.86)… then down hard again next week.