

Last week I covered the wave count that we should be in "if" we don't make another higher high, but today I'm going to cover what the wave count should be if we are going to make a new high. Let's look at it below...
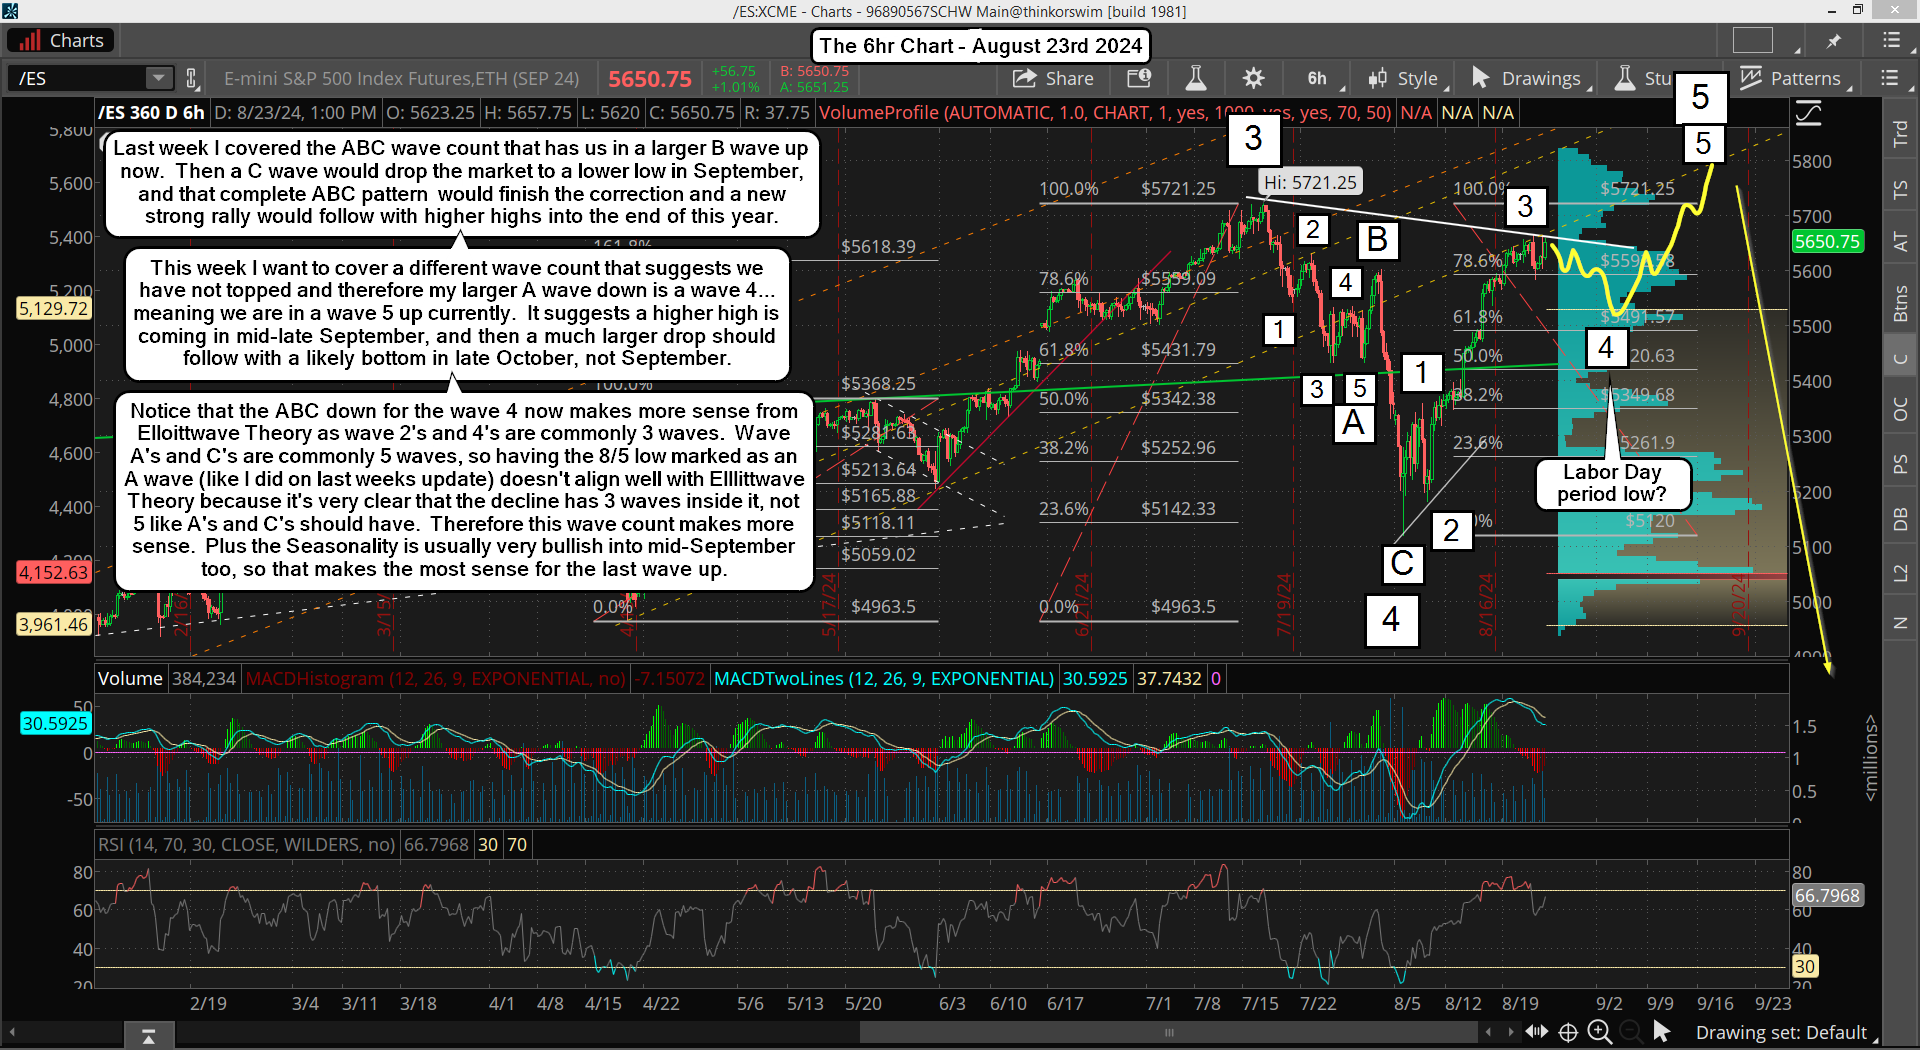
It was bugging me for a long time that the A wave down into the 8/5 low only had 3 waves inside it, and most A and C waves have 5 waves inside them, not 3... so this new wave count makes more sense because wave 2's and 4's usually have 3 waves inside them, and with this new labeling as that decline being a large wave 4 it fits perfect with the 3 medium waves inside it that make the ABC.
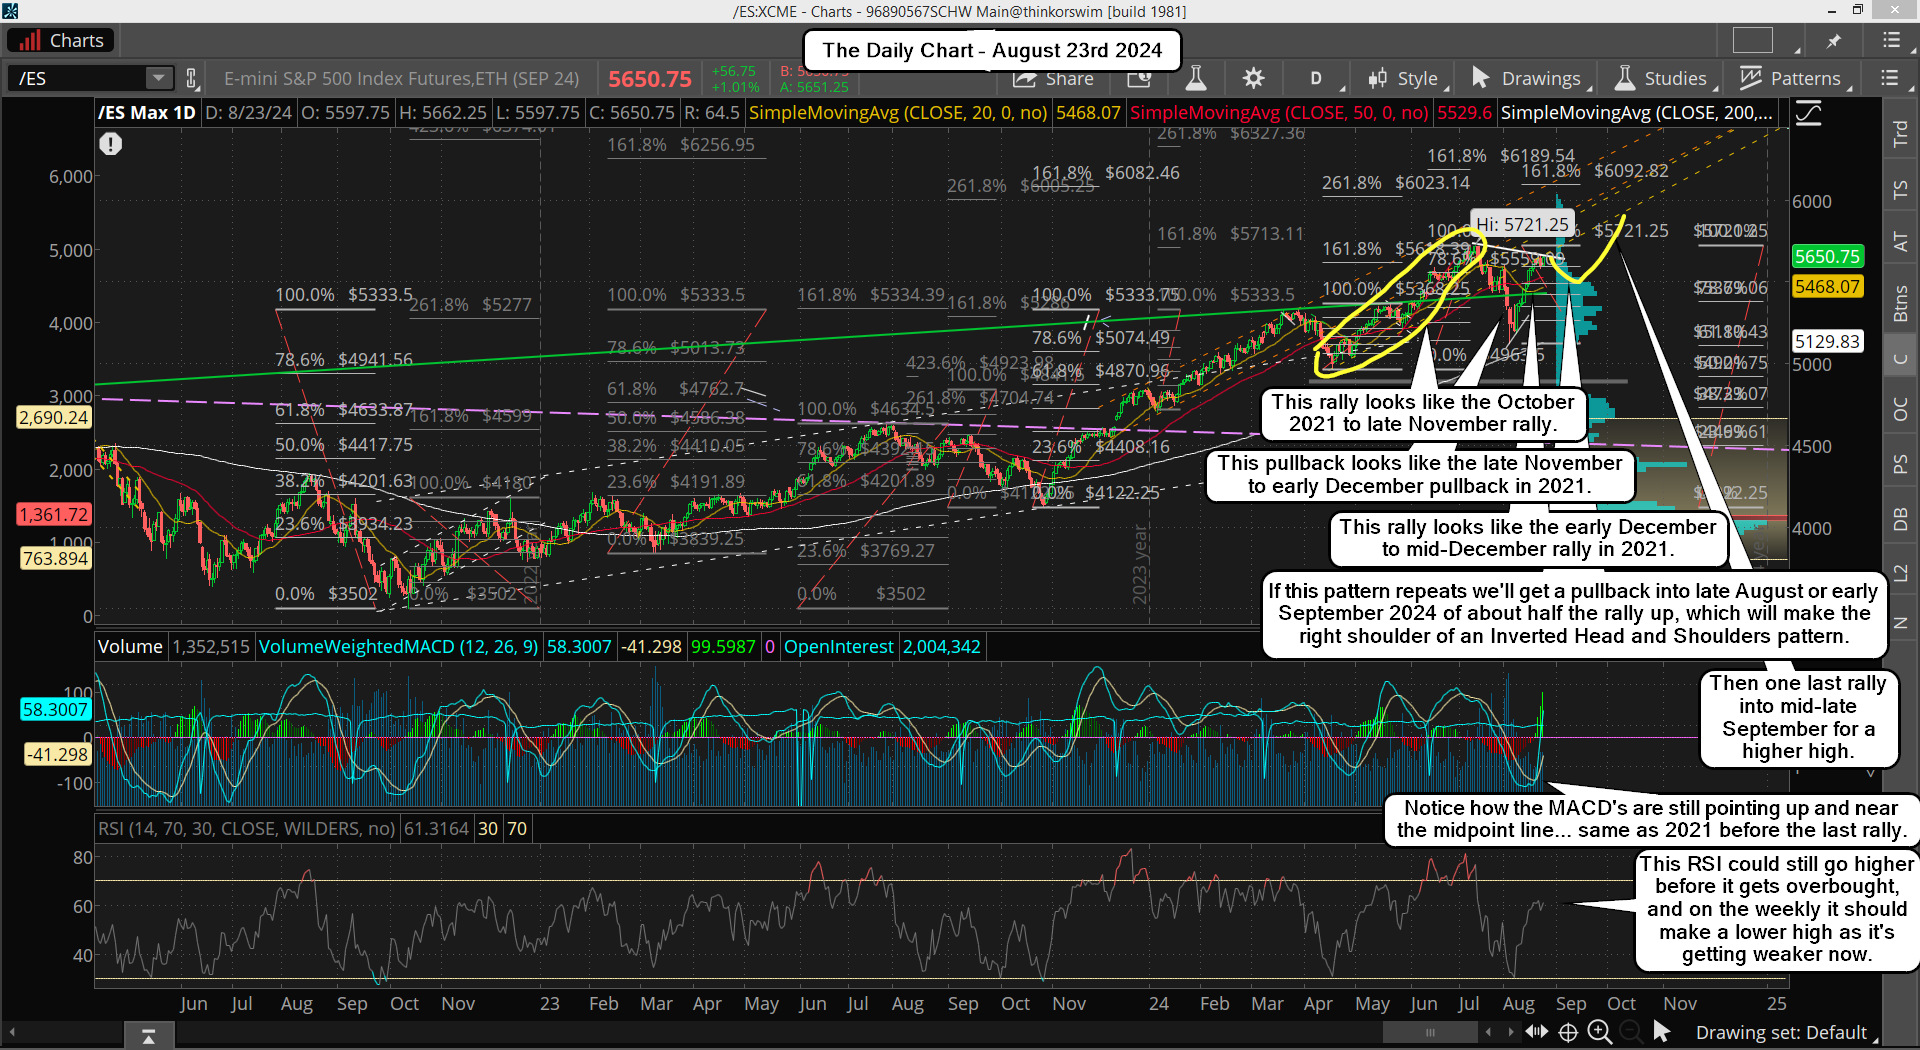
Next let's look at technicals and patterns to see if there's some more supporting prior history that could project the future. Below is the daily chart from the last move up into the 2021-2022 top as that's what it looks the most like right now.
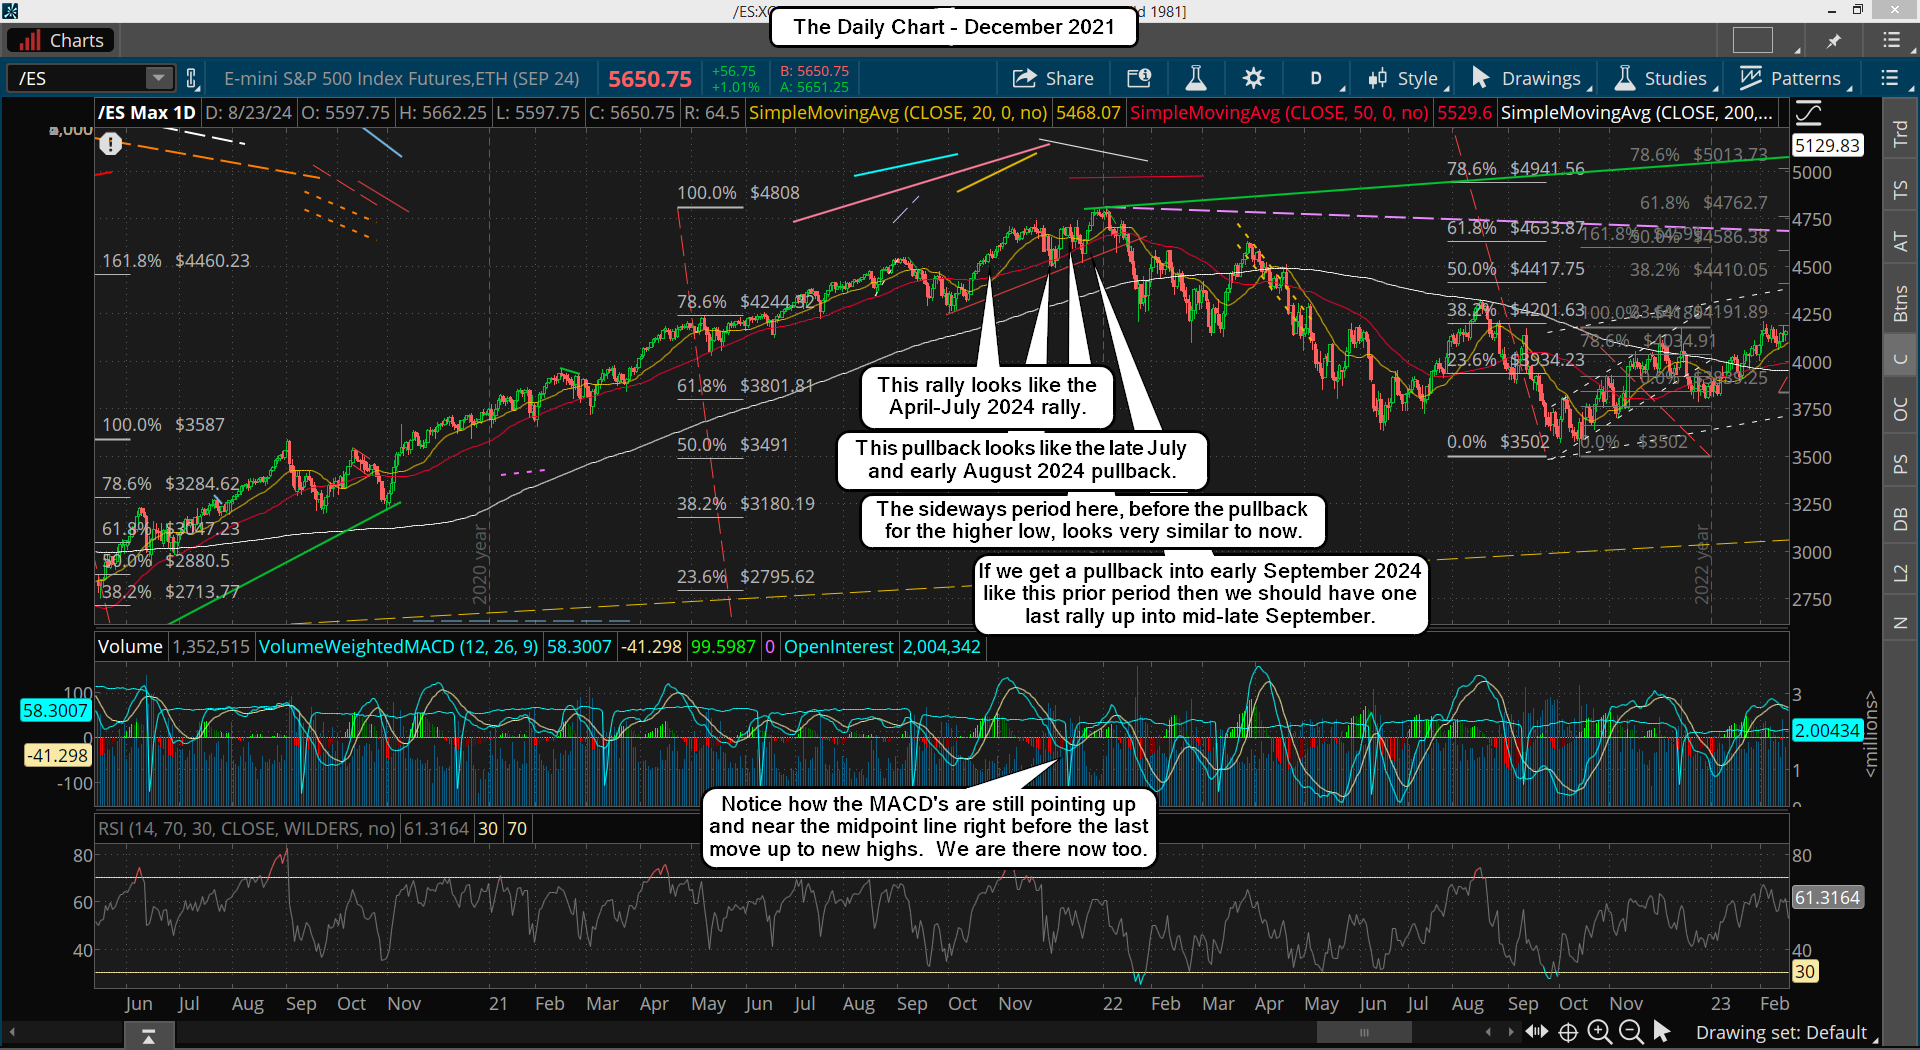
Now does that look like the current daily chart? I think it does, and while they never make a perfect repeat in time or price the overall pattern and prior position of the MACD's and RSI look very close to where we are today. That chart is below...
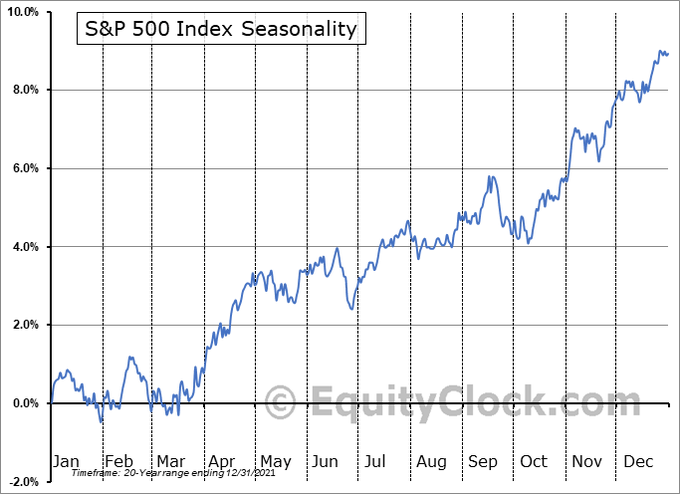
Interestingly the Seasonality Chart has a strong move up the first half of September, which would also line up with the last wave up to complete the large wave 5 and a new all time high.
Now let's not forget that we have another FOMC Meeting on September 17-September 18, and many others are predicting the Fed will do a cut, or say they are going to do one soon. History tells us that when the Fed's cut rates after the market has been rallying up during rates of increase the market always tanks.
You might think that cutting rates would fuel another strong rally higher but that's not what history shows. It shows the market rolling over shortly after rates are cut, and when you add those high odds of that happening at this next meeting, and prior patterns similar to late 2021, plus MACD's and RSI's that are similar, you have the makings of an important top and big drop afterwards.
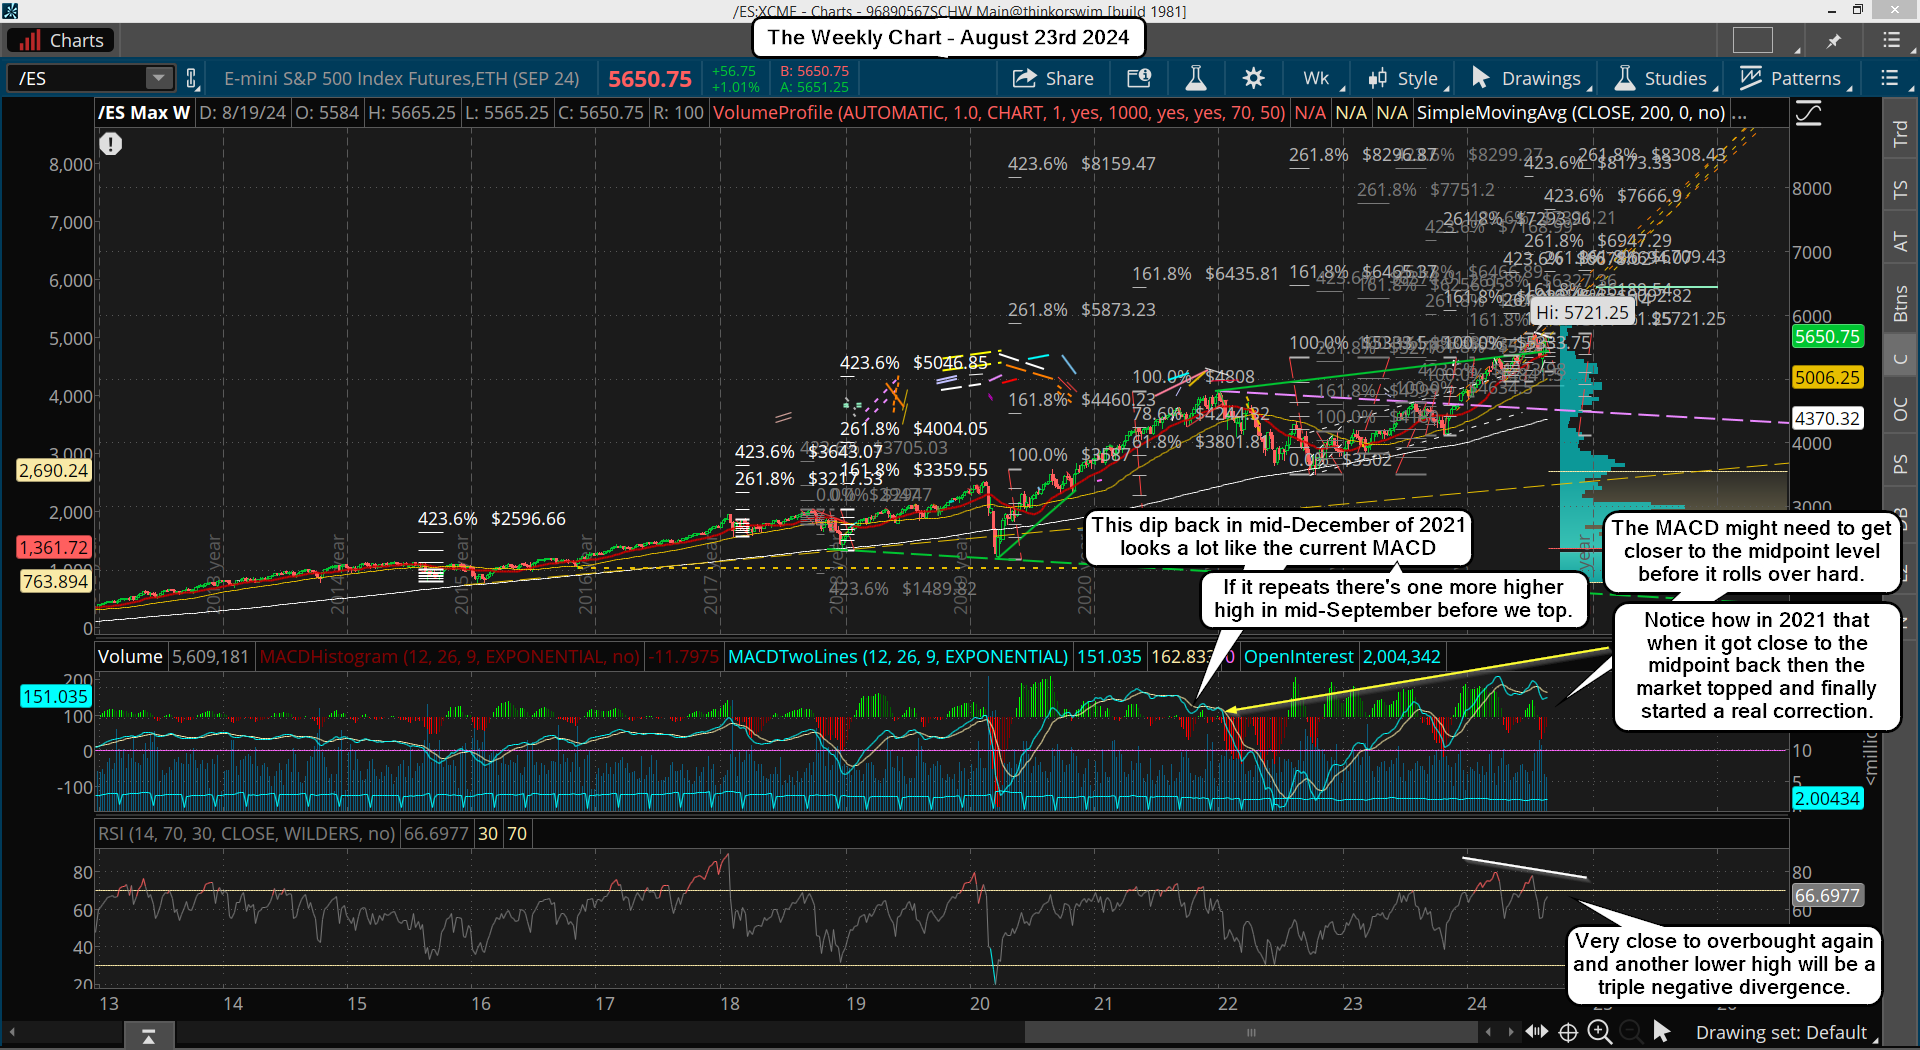
Looking at the weekly chart above, it too is getting weaker on the MACD's and close to overbought again on the RSI... while making a triple negative divergence. And let's not forget that many of the big firms, banks, brokers, fortune 500 companies, etc... end their tax year at the end of the 3rd quarter, which is September 30th. That's another reason to expect them to sell out their longs to close out their profit for this tax year. It's a common reason that many big drops happen into October of any given year.
Have a blessed day.

