

We went a little higher then I expected, which put in a slightly higher high. Nothing much has changed really as I'm still expecting a pullback into next week. That higher high yesterday was likely some final 5th wave up, instead of it ending on Monday like I previously thought it did. Basically, it looks like the chart I did on October 13th, which I'll post again below...
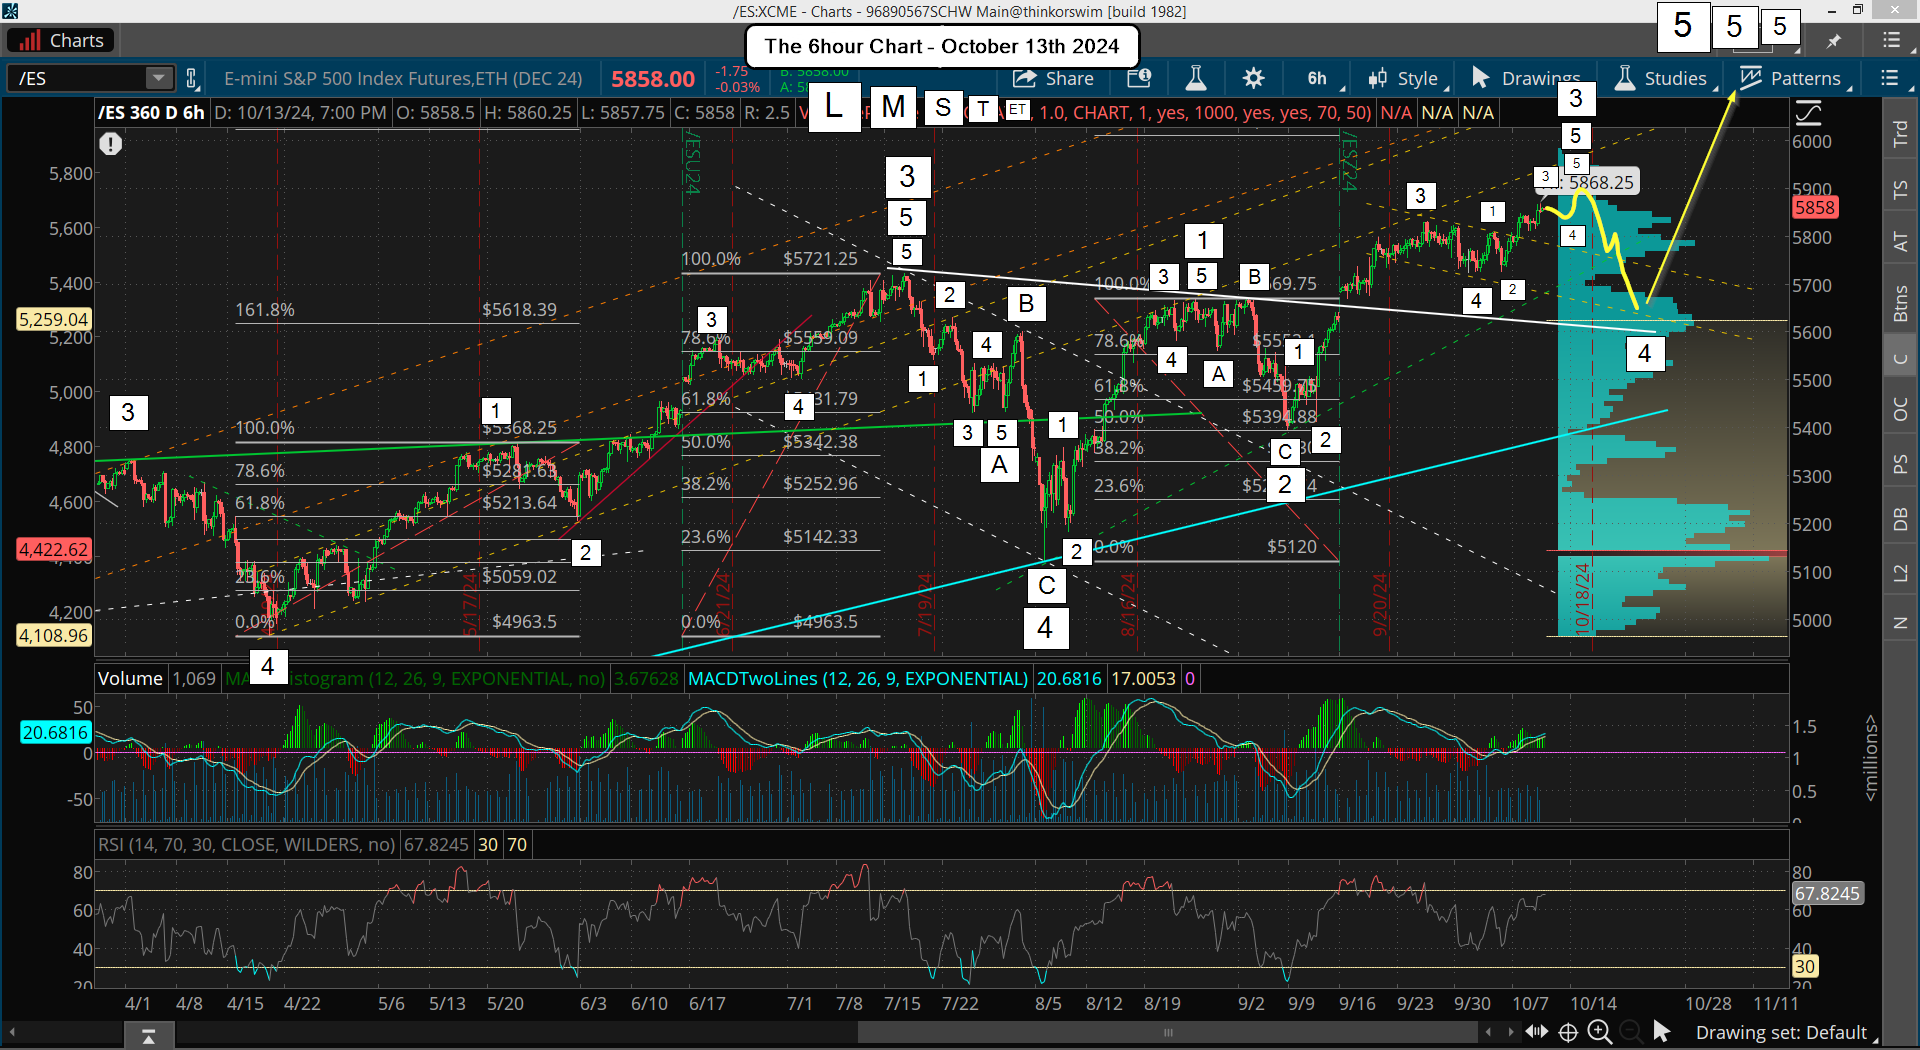
At that time I was looking for Tiny Wave 3 to have already topped that Sunday night at 5868.25, which I thought was the end of Extra Tiny Wave 5 (not labeled on the chart above but you can see 5 waves), but it went higher on Monday the 14th to reach 5918.50. It was obviously still not done previously, but it completed at that point. Then the drop on Tuesday was Tiny Wave 4 (as all the Extra Tiny Waves completed Tiny Wave 3), and the rally up from there was Tiny Wave 5, which peaked at the current 5927.25 high.
If this holds we completed Small Wave 5 up at that high and also Medium Wave 3 up. This puts us in Medium Wave 4 down right now in play, which should unfold in an ABC to make up all 3 of the Small Waves. Small Wave C should have 5 Tiny Waves inside it, and should complete by Tuesday or Wednesday of next week (best estimate). Below is that chart...
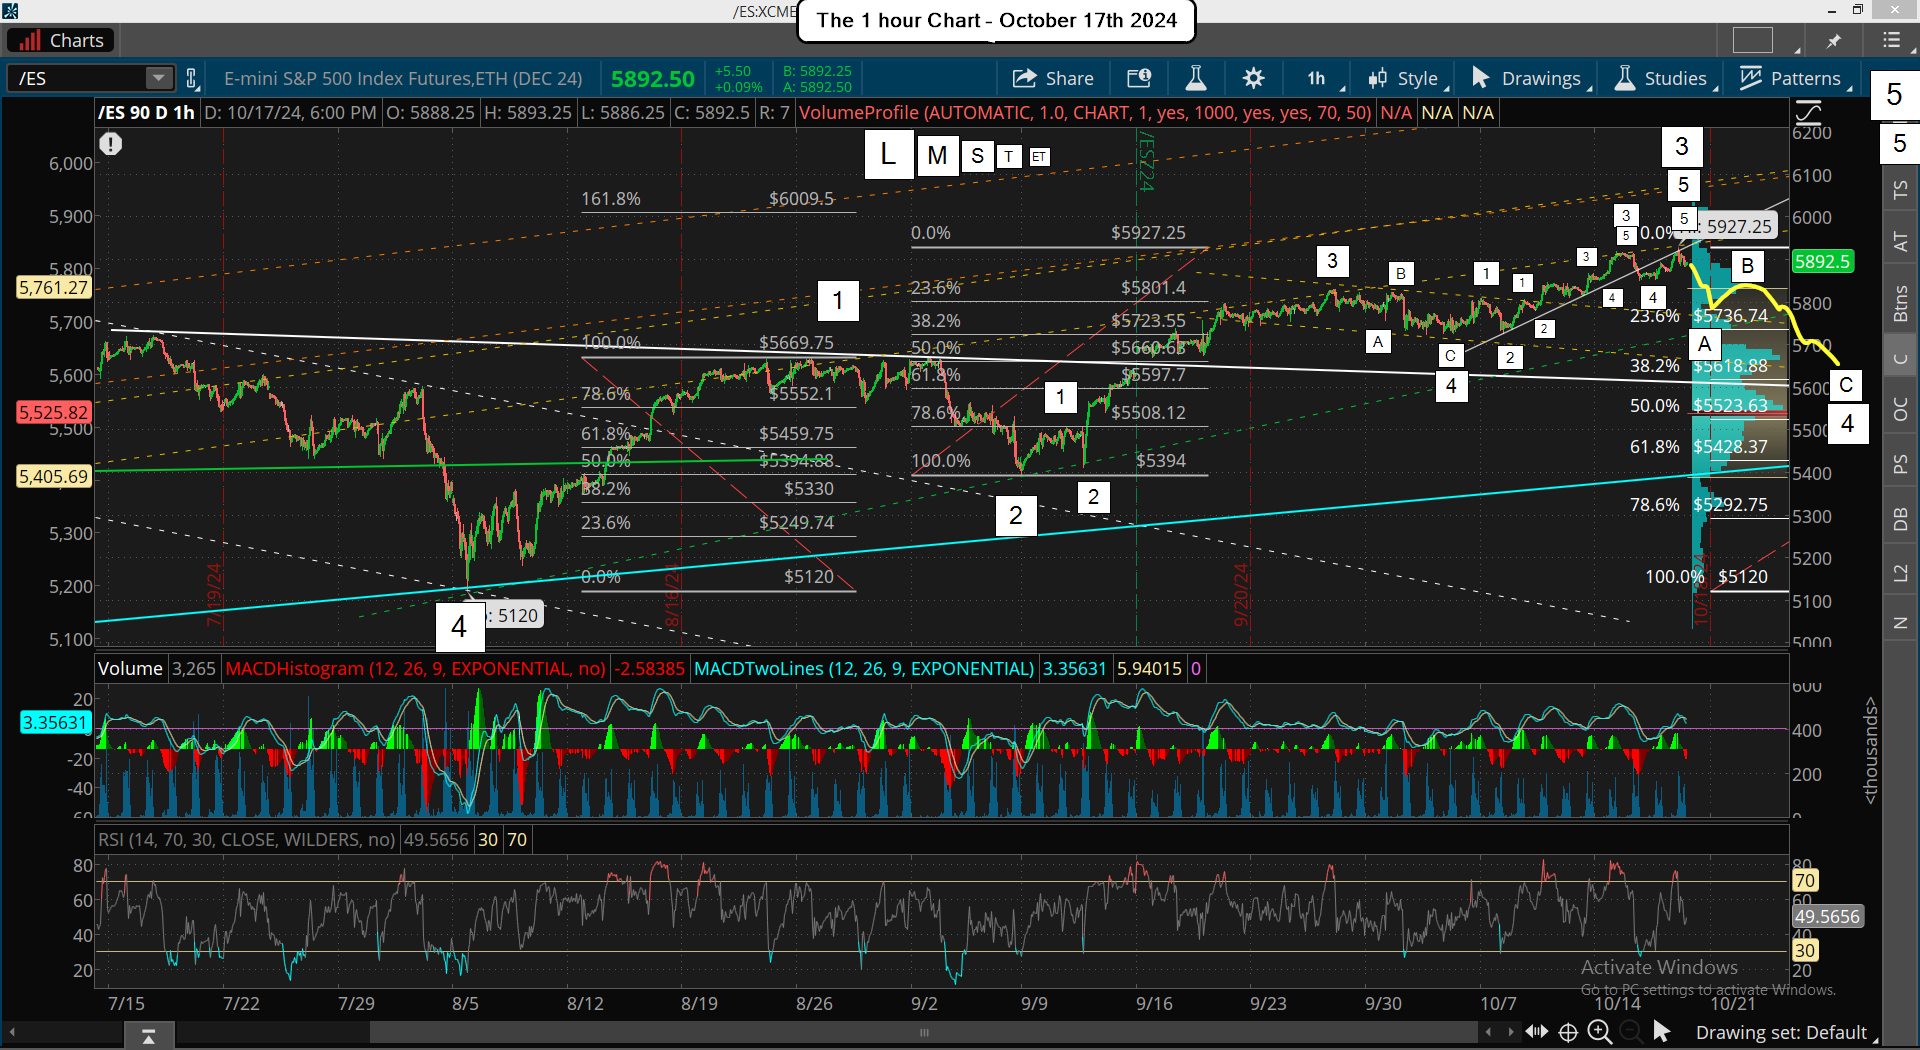
As you can see I've drawn some new Fibonacci Levels on it, which if we pullback to the 38.2% level from one of them, then that's somewhere between 5618.88 and 5723.55, depending on the starting point you do the measuring from. I don't think we will follow the Fibonacci Chart that starts at the 5120 low but I added it anyway.
That was the rally up from the 5120 low of Large Wave 4 to the high for Medium Wave 1 (5669.75), which was followed by a pullback of around 50% to the 5394 low for Medium Wave 2 down. That calculation was done using just the full length up of Medium Wave 1, but I've drawn both a calculation of just the length of Medium Wave 3 up and both Medium Wave 1 and 3 in total. I think the proper way to calculate is just using Medium Wave 3 only to see what Medium Wave 4 could be, just like using just Medium Wave 1 to calculate Medium Wave 2 down.
On it we have the 38.2% pullback level at 5723.55 and 50% at 5660.63, so I think that zone is our target area for the bottom of Medium Wave 4 down. Obviously, if they take out 5723.55 they are taking out the multi-bottom support and they might not want to do that... I don't know? But if they do it will be fast and ONLY done to hit the stops that the bulls have placed below that area. Then the 50% retrace level could be hit before we start back up for Medium Wave 5 into the election.
As for today I would like to see the 5850 low from Tuesday get taken out into the close so that we can open Monday down in the 5810-5830 area where there's support from 9/25-10/6, but that might be just wishful thinking as most Fridays are bullish. However, if that zone is hit we should bounce there as it's probably going to complete Small Wave A down, so maybe we see it reverse back up at the open Monday for Small Wave B?
Then (hopefully) it rolls back over near the close that day to start the final 5 waves down for Small Wave C, and that could last into Wednesday I'd say, maybe even Thursday? It really depends on how fast all this plays out as we could see another "one day wonder" where we drop a 100+ points to scare the crap out of everyone, and then that's all there is... it's finished!
That's really the smartest move by the bulls as it would lure in a ton of bears, which will be fuel to squeeze up to 6100 or so into the election. I'm just going to try my best to find the 5 waves inside the C wave down so I'll know where to get long at for the rally afterwards.
Have a great weekend

