

On Friday we finally reached a triple top, but short term charts looked too overbought to me to support a blow off gap up Monday and I posted a chart on X midday suggesting we will not do the breakout and instead go sideways in a range for about a week before we finally breakout though resistance and run the stops overhead. Shortly after I posted the chart (below) President Trump announced that he was going to doing tariffs and the market sold off fast to erase that entire rally and close down for the day.
For me, it was there in the charts that we were too overbought to hold up there and a pullback is needed to reset them. But I didn't expect it to be news driven and to happen so fast.
As I write this post over the weekend there's nothing new from him but I do believe that when we see the charts get nice and oversold we will also see him come out and announce some deal with the countries he was going to tariff and that will cause a big squeeze. When will that happen you ask? I don't know but I'll be looking closely at the 2hr RSI and the 6hr too. Below is the 2hr chart...
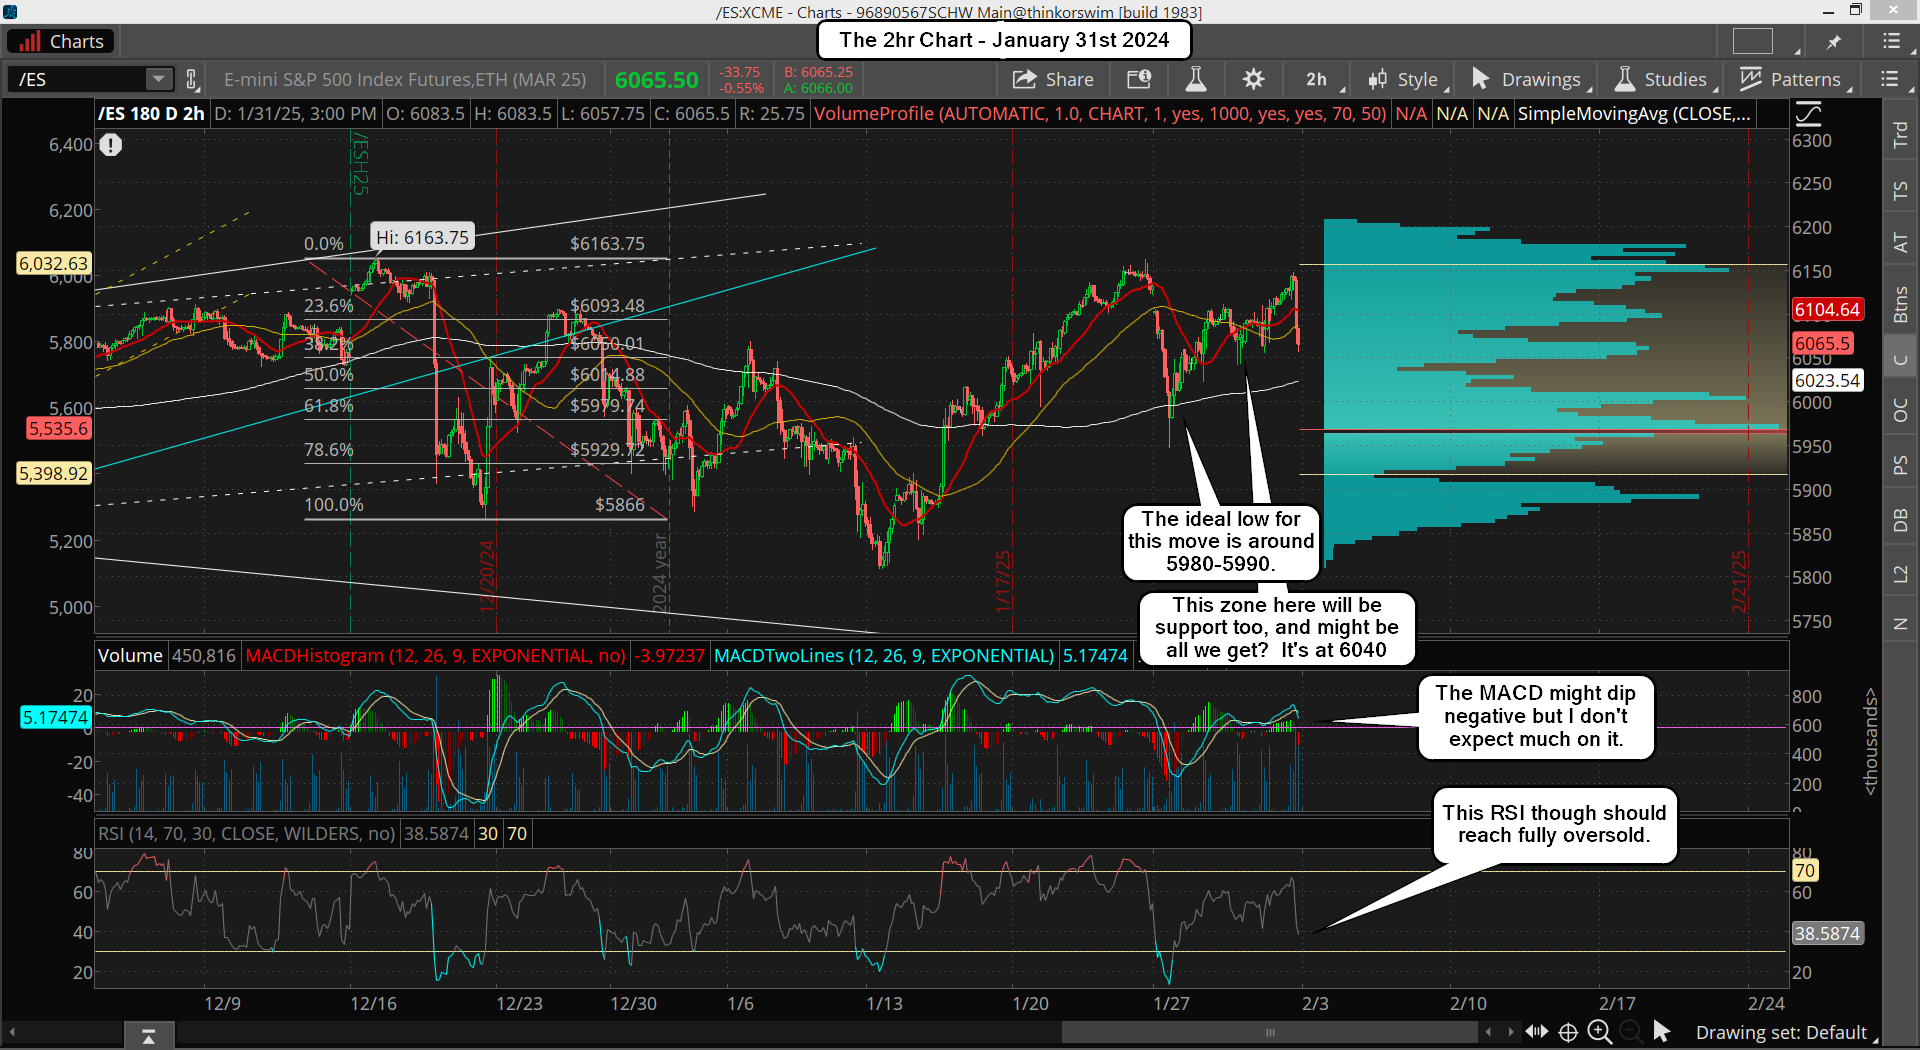
As you can see it's more about "time" then "price" as if the market can go down early Monday and find a support level to hold at then it can just chop around down there until the RSI gets oversold enough to bottom.
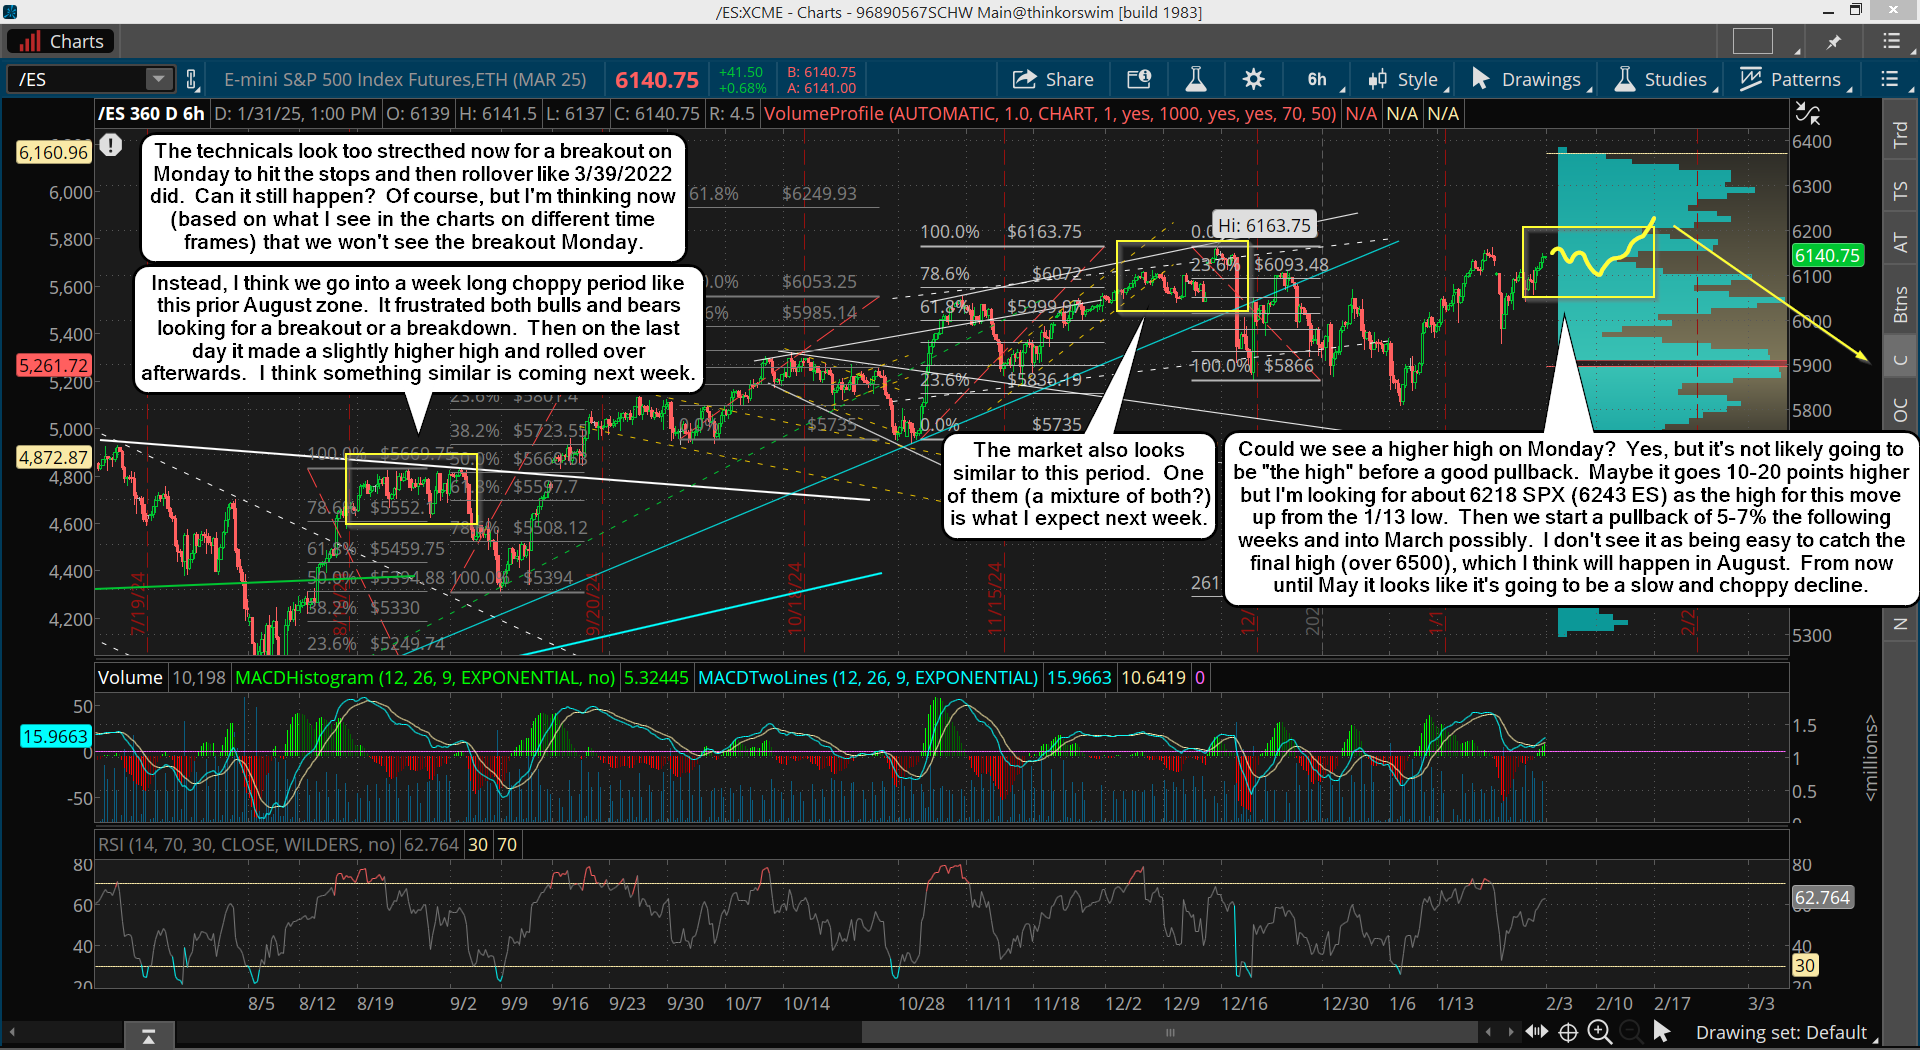
Then some deal announced during market hours or even after the close will be the spark to get the squeeze back up going, and I would expect to see it breakout this time around, and if it goes all the way up to my target (about 6218 SPX) into Wednesday or Thursday then it's all done for the rally. But if there's no news about a deal on the tariffs I'd go back to the market chopping in a range all week and breaking out next week to hit the target (like next Monday or Tuesday).
Considering that the "turn window" for the bulls to end their rally, and to let the bears take over, is this week I lean toward some deal happening to give the bulls the trigger needed to blast off faster and finish it all this week. That's just my lean of course.
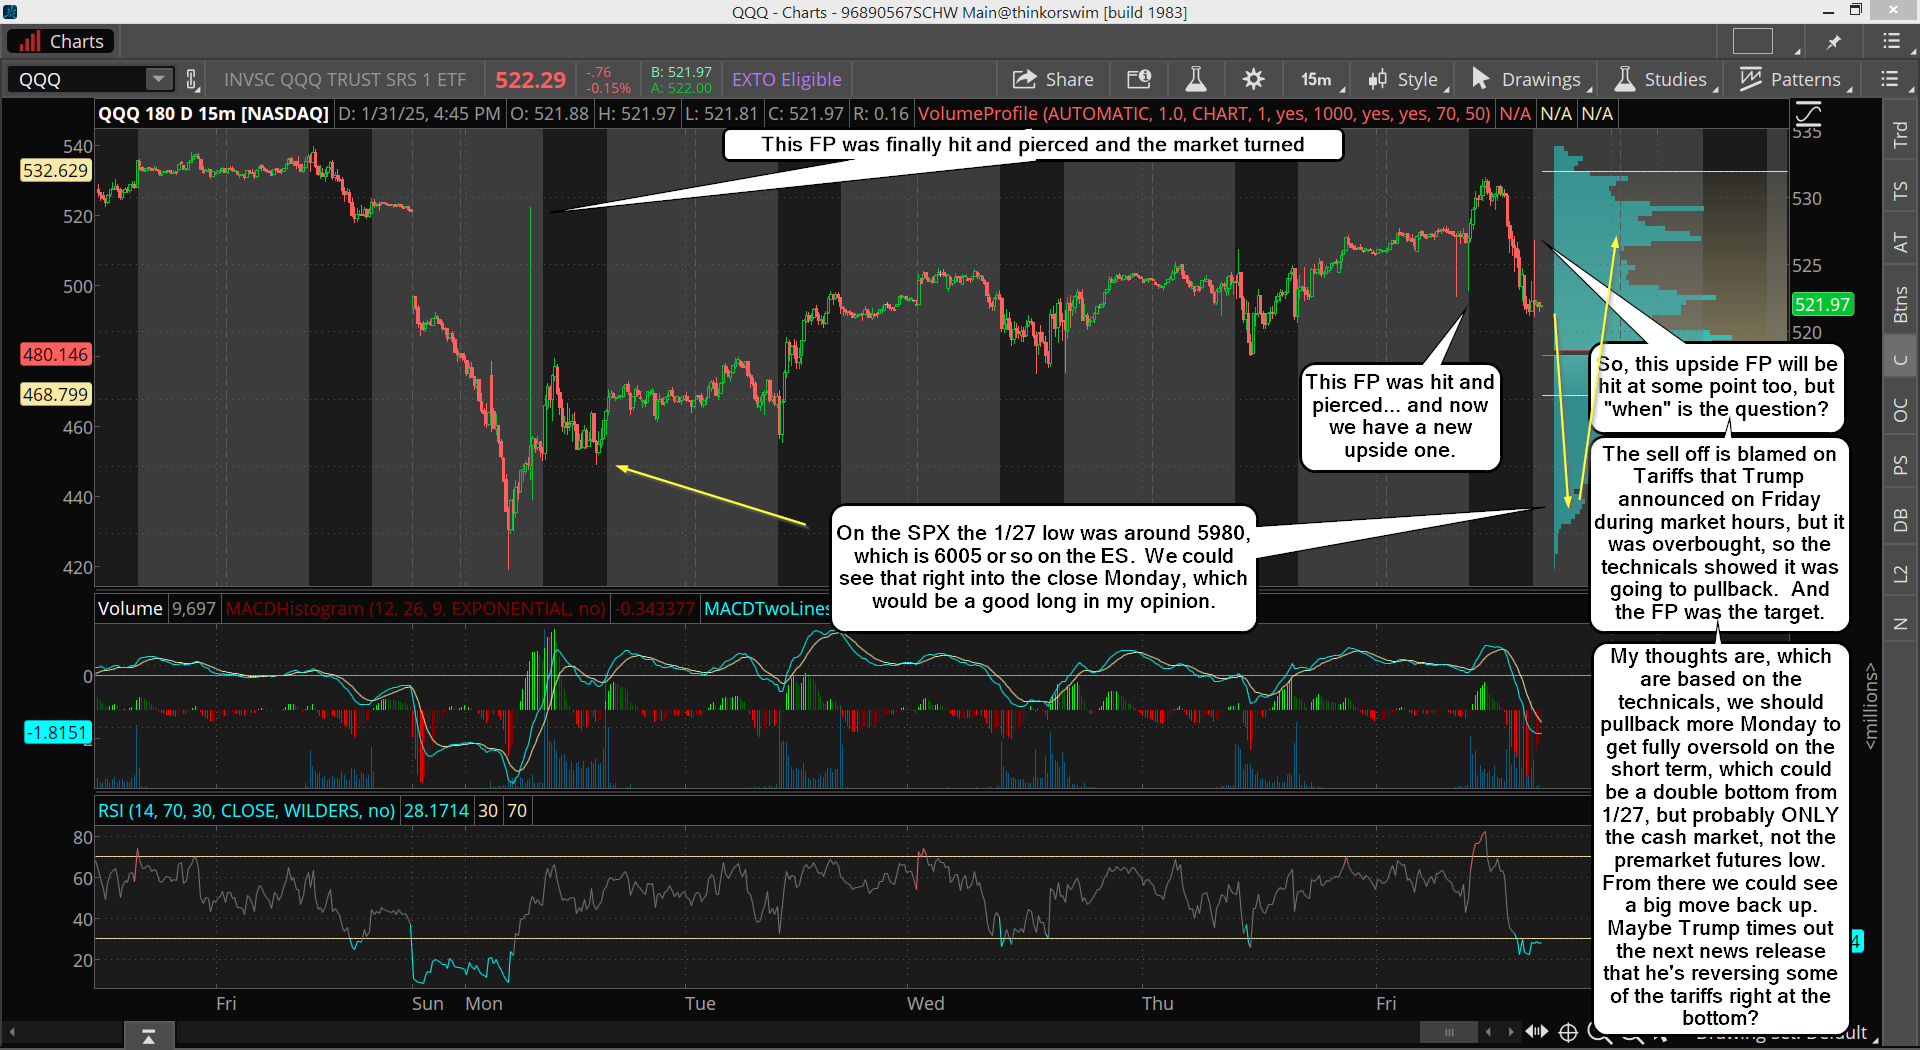
Above is a chart of the QQQ that I posted on X Friday as well. It shows the FP's and my thoughts on the most bearish case for it playing out. It doesn't have to go that deep but it would be a great long setup if it did. The deeper it pulls back I think the easier it will be to reach the new all time high, so I would love to see a move down to around the 1/27 low, but a slightly higher low, which on the ES would be around 5980-5990 I'd estimate. Below is the 6hr chart...

You can see the obvious Inverted Head and Shoulders pattern that has already been formed but to have a second right shoulder would be the ideal spot to go long I think. It would likely take all day Monday for the RSI to get oversold on the 6hr chart but I'd love to see it happen.
Have a blessed day.

