Saturday, April 26, 2025
Home Blog Page 4

ES Morning Update January 15th 2025

0

Ok, yesterday was a choppy one as the market continued to carve out the wave 4 up, which either finished or will finished today after the CPI as it will have some wild moves after it. If it finished yesterday then we should just start straight down for wave 5 as posted on my chart Monday, which I'll re-post it here below...

If we gap up instead from the CPI then the wave 4 is just extending a little and we should see the wave 5 down follow afterwards into midday or longer, but I lean toward the final wave 5 down ending at some point today. If we gap down right away then it could end in the first half hour of the day, but in both scenario's wave 5 down should end by the close. I do not know which way it plays out but the wave 5 down should at least double bottom, although odds favor it breaking and making a lower low.

After that though, lookout for a big squeeze up to retest the 1/6 prior high, and it might be super fast, like into the 20th, who knows for sure? But will be a fast squeeze. It's at that point where we should see another pullback but I don't know how much. The deep of that pullback should help determine if we are going to see a blow off top into the end of this month or not.

If it's a deep enough pullback then I'd say we won't see a new high and will just continue the wild swings up and down into a final low in May. Then we should see a huge rally up into August for that blow off top, but it's still possible to play out into the end of this month. If you are a bull though, and decide to buy the break of the expected double bottom I'd look to exit when upside resistance is hit from that 1/6 prior high zone.

Have a blessed day.

ES Morning Update January 14th 2025

0

We found a bottom yesterday at the 5809 low on the ES, and have been bouncing back up ever since. Looking at the oversold RSI on the 6hr chart it tells me this bounce could last a few days, which opens the door for the CPI on Wednesday to end the bounce and for the market to roll back over again for another move down.

That last move might end that day or carry into Thursday or Friday. It's hard too say for sure on the "when" but the price level is something else, which I think is more predictable in this scenario. I'm looking for a hit of the falling white trendline, which is anywhere from 5730 to 5710 between now and this Friday. Beside the CPI this Wednesday there's the Jobs Number on Thursday, so we have "things" that can cause moves in either direction.

I don't know how it's going to play out but my best guess is that "if" we rally today to get the RSI on the 2hr chart overbought (I don't expect that to happen on the 6hr) then Wednesday would could rollover again after the CPI.  (2hr chart below)...

If we pullback some first today then the CPI might cause some fast squeeze up first to get the RSI (2hr) overbought that day instead... then we rollover. The jobs number on Thursday would then just be more bad news to get that last push lower into the mid-low 5700's on the ES where I think we bottom at. The 11/1-11/4 low around 5735 will be big support, which is also the lows from 10/2, 10/3 and 10/7, so that zone will be a spot where smart money wants to buy at.

Will it make it all the way there or not is a question I can't answer, but I'm a bull if it does. I previously thought we would have bottomed by now and would be rallying into the 20th but it's looking like we are going to bottom right before it and start a powerful squeeze up afterwards.

That move up should last into the end of the month I think and should ONLY make a lower high now that we've went lower then expected, and took too much time to get there. I'm now going to go back to my original thoughts that we'll see a blow off top this summer as too much damage has been done to see that blow off into early February. It's not some much about "price" but more about "time" that's changed the plan and lowered the odds of such a move happening. Anything is possible I guess but for me odds are now much lower that a new high will happen into the end of this month... especially if we hit the low 5700's late this week before we even start the rally.  (6hr chart below)...

My point here is that's not likely that the down move is over yet and that it can play out differently depending on how the two upcoming "events" are used, but the end result should still be a trip lower to tag the falling white trendline, or at least get close to it. More patience is needed here if you want to catch a powerful squeeze back up into the end of this month.

My guess is that that it will retrace 61.8% to 78.6% to squeeze out of the bears, and lure in some bulls looking for the blow off top to happen. But "time" will NOT support it and we will be at the end of the month (most likely) when this happens and February should be a nasty down month, which will not support the bulls at all.

Have a blessed day.

ES Morning Update January 13th 2025

0

Really close now to the bottom, but not quite there yet. I do think we'll see it soon though, like today or Tuesday. Of course the wave count has changed some now that we've made a lower low. My best guess is that we should have a bounce Monday for a Small Wave 4 after first retesting the Friday low to complete Tiny Wave 5 inside Small Wave 3 down. Then Tuesday we should see Small Wave 5 down, inside Medium Wave 5, inside Large Wave 4, which should complete it all. Below is a chart...

From there we should rally hard for 2-3 weeks with 6500+ possible, and that will be Large Wave 5 to complete it all and then the bear market can start with February producing a nasty 10-20% drop. This is my Bullish Wave Count of course as I just think the odds are less and less that we don't make a higher high on the next big squeeze up. I'm sure there will be some news event to blame it on afterwards but we should bottom by Tuesday and start a powerful rally that should be the last one in the multi-year bull market.

Have a blessed day.

ES Morning Update January 10th 2025

0

The market continued to pullback on Wednesday and I'm not expecting much to happen today. Everything is pointing to a bottom early next week as we get closer to the inauguration on the 20th, but I think it bottoms before then and starts up so that it can do the big breakout squeeze afterwards, which could (should) continue into the end of the month.

I don't know if it's going to happen like this or not but a lot of things are setting up for some big move up, but whether that's just to a lower high or breakout high is unknown. The typical pattern though is that the longer the market consolidates in a range the bigger the rally. It's been in a corrective sideways up and down range of about 300 points for 3 weeks now, which should lead to a power rally when it finally breaks out. Not much more to add, so I'll end it here.

Have a great weekend.

ES Morning Update January 8th 2025

0

We had a nice pullback yesterday, which looks like it was a C wave inside my wave 2 down, inside C up to complete wave B. Today, tomorrow and Friday we should continue to have these wild swings up and down as we setup next week for a big move up to challenge the all time high, which "if" if follows my wave count from January 6th it will be a lower high. That wave count is posted again below.

Now if I'm wrong on the lower high then we might see a blow off top rally that will squeeze up to the FP I have on the SPY (over 6500 SPX), which I'd think will end the week after the 20th... call it "The Trump Euphoria Squeeze", which will sadly mark the final high for the year (and many years I suspect). It reminds me a lot of the 2015 pattern where the current market is similar to the 1/23/15 to 2/2/15 pullback, and below is that chart...

So while I'm not saying that we will follow that prior pattern exactly there are a lot of similar moves with it compared to now. If it does continue to track it then next Tuesday or Wednesday would be like 2/2/15 and mark the last low before a big squeeze for the blow off rally into 2/25/15 back then, which might be the end of this month roughly. If that plays out then of course the wave count will be different, and below is that chart...

If, that's a "BIG IF", we see this move play out no one, and I mean NO ONE will see if coming (except a few lucky people that read this blog), and it will hit the FP on the SPY that is above 6500 and that will end it all.  I will post the FP when this starts to happen so everyone will know when to exit their longs (if they buy some early next week?).

Have a blessed day.

ES Morning Update January 7th 2025

0

So far, so good for resistance holding. We've had a clean 5 wave rally up from the low last week and we have likely seen the top for now. We should spend some time (the rest of the week) pulling back some and going back up for a lower high... basically chop. I posted a chart on Twitter yesterday showing what I think the wave count is, and below is that chart again.

The Small Wave 1 up inside Medium Wave C, inside Large Wave B (just labels for this chart ONLY and NOT correct on bigger time frame charts), likely ended at the 6068 ES high and we are in the ABC down for the Small Wave 2 now. It can (and should) subdivide into even smaller waves, Tiny Waves, which would be a 5,3,5 pattern if it wants to divide that much.

Sometimes the wave A or C will just be one big wave when it's one that is of a smaller degree, and this would be Tiny Waves, so the 5,3,5 waves inside the ABC would be Extra Tiny Waves, and many times those waves just end up being a one wave move. Regardless of how it plays out on the really small time frame the end result should be a move down into late this week for a higher low then last week.

Clearly the low I was looking for around the 6th came early with the bottom being put in one 1/2/25 at 5874 on the ES. I'm just looking for a lot of "back and fill" this week, which might carry into early next week, before Small Wave C up takes us up to challenge the current all time high around the 20th. Again, I suspect that the inauguration will NOT be a "sell the news" event and that there will be one last move up a few days after it to hit the stops on the bears trying to short it. Then we should drop hard into February.

Have a blessed day.

ES Morning Update January 6th 2025

0

It doesn't look like they are going to allow the double bottom area to break as we come to the end of the bearish period today and/or tomorrow. However, I'm not married to the idea that the bulls are going to just do another huge "day after day" squeeze up to a double top or even a new high.

I get the feeling we are going to see many up's and down's from here forward into the 20th or later, and that we will not make a new high. I could be wrong there as that's just a gut feel and nothing more, but it's based on my thoughts that the SPX will hold the current ritual number high intact until this summer when they do the last big rally up to another ritual number.

Cycle wise that should happen in August, but we have a huge ritual date on September 9th, 2025 (999), so that might be the final high? If you are satanic, and all the elite are, and you want a huge crash to crush America and steal the wealth of the people, then you will want both a ritual date and a ritual price for the last high.

I have a FP for the ritual high on the SPX and it's above 6500 SPX a little, but not the obvious 6666 ES/SPX, or 666 SPY. It's below that but it's still a ritual number and while I'm just guessing on the date, which it might not be, but it will be something of importance no matter what.

I'm discussing it now because there's not much for me to talk about here in the short term. I think we are going into a chop period from now until the 20th or so with no clear direction. We will probably be some ABC that subdivides into 5,3, and 5 waves I suspect, and those waves will subdivide too as 2 weeks or more of time is going to require lots of chop. Again, it's possible that we make a new high but I really lean toward a lower one. I don't plan on doing any trading during this period as it's going to be tough to figure out.

Have a blessed day.

ES Morning Update January 3rd 2025

0

We double bottomed yesterday after a lot of wild intraday swings up and down, and rallied up from into the close. We are very close now to ending the bearish period, which should end early next week... meaning by Monday or Tuesday the bears will have overstayed there welcome and it will be time for a strong rally into mid-late January. As for the short term, we got oversold yesterday, so a bounce from it is normal. But I don't think the low is in yet and I don't think we are ready for a multi-week rally. I still think rallies will be sold until early next week.

Have a great weekend.

ES Morning Update January 2nd 2025

0

Nothing has changed with the forecast as the market is still on track to bottom into next Monday/Tuesday. It's just missing that one big down day where it flushes out all the bulls, and that means it should go below the 12/20 prior low by some good amount to hit all the stops, so around the 11/4 low would be the target.

I don't know if we pierce it too, and hit those stops, or if it stops short of it and turns back up. It's really going to be based on "time", which when it runs out for the bears it's over with and the bulls get the ball for several weeks.  I think it will starting next week, not today.  This move up should fade and is just normal to see when short term charts get oversold.

There is still a missing flush out drop coming in my opinion, and it should happen today, tomorrow, or Monday.   Then I think we turn back up strongly for a rally into mid-late January before we rollover again for another trip down hard in February.

Have a blessed day.

ES Morning Update December 31st 2024

0

The market started the first wave 1 down inside the wave 3, of C yesterday. It bottomed midday and bounced back up to erase about half the move, which is a wave 2, still inside wave 3 down. It might have already finished or it unfolds in an ABC up, which if it does the ABC we'll have the C unfold today.

And with the 2hr chart quite oversold it would not surprise me to see it unfold in an ABC, but either way the market does not look finished on the downside yet. After the wave 2 is done we should see the wave 3 of 3 of C happen, and that might be Thursday and/or Friday?

If so we'll finish the wave 4 and 5 of C next Monday, and we should be around the 5700 level I'd think... or we reach the FP on the SPY of 533.01? Hard to say which scenario plays out but I lean to toward the 5700 zone and the 5300 zone won't happen until February.

Have a Happy New Years Day tomorrow.

ES Morning Update December 30th 2024

0

Friday did indeed start the C wave down that I've been looking for to unfold. It was just the wave 1 inside the C and the wave 2 bounce started after about midday, and then we pulled back again into the close. It looks like the wave 2 up in unfolding in an ABC and the first bounce was the A, then the B down afterward, which right after the close the C up started.

Once that is finished we should see the wave 3 down inside the C start. It too will likely subdivide into 5 waves to make it tricky to figure out, but my best guess is that it finishes around the 12/20 low, then we bounce for the wave 4 and finally the wave 5 takes out that low and we hit the 1.618% extension of 5681 on the ES into early next week. This is the less bearish case, whereas there's a more bearish case too, and it's on the chart below.

With the more bearish case the wave 5 doesn't finish until we reach the FP on the SPY of 533.01 (around 5380-5400 ES), which is possible but I think it's less likely. Do I still think the FP will be hit? Yes, but not now. I think the less bearish scenario will play out and that we'll see the FP hit in February, which suggests we'll see a strong January rally up to around the 20th, and that could take until the 27th or so.

Call it that week basically, and from there we should rollover again and drop into another 5 wave move for a bigger C wave down. It's at that point I think we could see the FP on the SPY hit, which might be mid-late February. Once all of these waves finish so will the large wave 4, and next should be a 5 wave move up into August for the final wave 5, and it should reach 6500+ (which is supported by an upside FP I have on the SPY that points to that area).

In conclusion, I'm basically looking for around 5700 on the ES into early next week and that should finish waves 3, 4, and 5 of a C, which "probably" will end up ONLY being a larger degree A wave inside an even larger 4 wave. It's possible that the 4 wave completes on this move but I really give it low odds. Most likely it subdivides and finishes in February.

Have a blessed day.

ES Morning Update December 27th 2024

0

All up waves look complete to me now. Yesterdays chop should have finished my wave 4 and 5 up, inside the C wave of the bigger B wave up.  We should start down from today and it should take everyone by surprise that is looking for the Santa Rally... that's "if" I'm right with the wave count and technicals?

I don't have anything else to add as I said it all yesterday. So far it's playing out perfectly.  I'll keep this post short and end it here.

Have a great weekend.

ES Morning Update December 26th 2024

0

The Grinch That Stole The Santa Rally?

The Bearish Wave Count...

I've been talking about a blow off top over the past many posts but I want to cover another scenario where the final high isn't until the spring or summer of next year.  It's always wise to just let the market decide and have different plans of actions if the market doesn't do what you think it should.

Yes, I posted a chart Tuesday where we get a last squeeze up to a new higher high into the first week of January, but what if I'm wrong and Santa doesn't come this year?  That chart was posted on X and here it is again below...

There's some issues with that chart when you look closer at the wave count.  The waves just don't add up too me like they should in Elliottwave.  Down moves usually have 3 waves, and subdivide into 5, 3, and 5 inside them.

FIRST:  Notice that the decline from the high was 5 waves in total?  They are clean looking waves too.  Shouldn't that be an ABC pattern if it was finished?  Yes, it should, but it's not and that worries me, which leads me to think it's NOT finished.

SECOND:  The rally up from the low is looking very uneven for a 5 wave push with the wave 3 being the shorter move.  And if we pullback small for a wave 4, and do a wave 5 blow off to say 6250+ to complete it all that last squeeze will make the wave 5 the largest wave.

Too me it looks more like we had a strong one wave move up from the low for an A wave, then did an ABC down for the B wave pullback, and then started a 5 wave rally for the C wave, which as of the close on Christmas Eve we completed wave 1, 2, and most (or all) of wave 3 inside that C wave up.  Below is that chart...


If this wave count is correct we will NOT see a blow off top and will make a lower high, which might be today?  All that is left is a wave 4 pullback and wave 5 up to complete the C wave, and that entire ABC up from the low is then just a B wave.  Next will be a C down (with 5 waves inside it) into the first week of January.  It should make a lower low as well.

The technicals are getting short term overbought now, so they do favor a pullback of some degree into next week, and the wave count suggests it will be a C wave down.  On top of that we hit and pierced on Tuesday an upside recent FP of 599.96 on the SPY, which is below...

That means that FP is complete as it did it's job.  With it being fulfilled I have to be open to this bearish case with the market rolling over here very soon (today probably).  I don't have any downside FP's except the 533.01 one but that's too deep I think as I only see about 5650-5700 as the target low.

Everyone is expecting the Santa rally here, even I have been sucked into thinking it's coming... but the wave count and the technicals just don't support it.  I have to be open for another large drop here in the next week.

If this plays out the final high will be a lot higher as when you do a deeper pullback like what I think could happen it resets the upside target... meaning we could see 6500+ into this spring or summer as the final high.  And strangely I have an upside FP on the SPY with a target that high.  Plus we haven's yet seen the FP on NVDA of 160.22 hit yet either.  My guess is that when we hit it we'll also be at 6500+ and that should happen until mid-2025.

In conclusion I think I'm wrong on the blow off, last squeeze top happening into early January and that instead the recent pullback, which I previously labeled as a wave 4, will subdivide into an ABC as it did NOT likely finish at the low on 12/20, and that we are about to start the C wave down for the wave 4, and it should complete into early January with a lower low.

Have a blessed day.

ES Morning Update December 24th 2024

0

Should be a light volume day with a move up from the looks of the charts now. We are probably starting a wave 3 up (extra tiny) that will reach big resistance in the 6100-6120 zone on the ES. Since this week is expected to have most traders taking off for the Christmas holiday the expected pullback from that 6100-6120 zone might not be very much. I did a post yesterday on Twitter with that chart, which I'm re-posting below.

Notice how the pullback after hitting the 6100-6120 zone (to complete Extra Tiny Wave 3) is drawn out in time until the end of this year, and it's not that deep either. I still think this will be the path going forward, which will be the Extra Tiny Wave 4, and it will setup the first week of January for Extra Tiny Wave 5 up, which will complete Tiny Wave 1, which will then be followed by a shallow pullback.

Now, if the "degrees" of the waves are correct the pullback should not take out the low last week, but if I'm wrong on the wave degrees, meaning they are a larger degree waves, then the move up to a new high would be Tiny Wave 5 inside Small Wave 5, inside Medium Wave 3, which will setup Medium Wave 4 down to play out sooner then expected.

I posted on Mondays update a chart similar to the one above and I had them labeled as 5 Extra Tiny Waves up (for a double top) to complete Tiny Wave 1 up, which I'm re-posting it below again.  It's just extended in time with subdividing Extra Tiny Waves before it completes Medium Wave 3 up.

That WILL be wrong if we take out the current high into the first week of January. It will be higher degree waves. Meaning the 5 waves up will be Tiny Waves which will complete Small Wave 5 inside Medium Wave 3, and that will set the market up for a deeper drop in January as a Medium Wave 4 down is of course a larger degree wave then Tiny Wave 2 would be.

With the Tiny Wave 2 scenario we would drag out the rally into mid-late January to reach a higher high, but if we push through in a fast squeeze for that new all time high in the first week of January, then those Extra Tiny Waves won't exist and will be Tiny Waves instead.

You see, I don't know if the market is planning on subdividing into a bunch of Extra Tiny Waves to make Tiny Waves or not? The "tell-tale" will be how high we go into the first week of January. If we do a big squeeze to say 6250+ then we are NOT subdividing and that rally will complete Small Wave 5, inside Medium Wave 3 and will setup the market for a nice correction the rest of January.

If we meander around and fail to make a new higher high in the first week then we will probably subdivide and it will take until mid-late January to complete Small Wave 5 inside Medium Wave 3. Lots of options that could happen into the first few days of 2025. I will remain very open to either scenario playing out and will react accordingly.

Merry Christmas

ES Morning Update December 23rd 2024

0

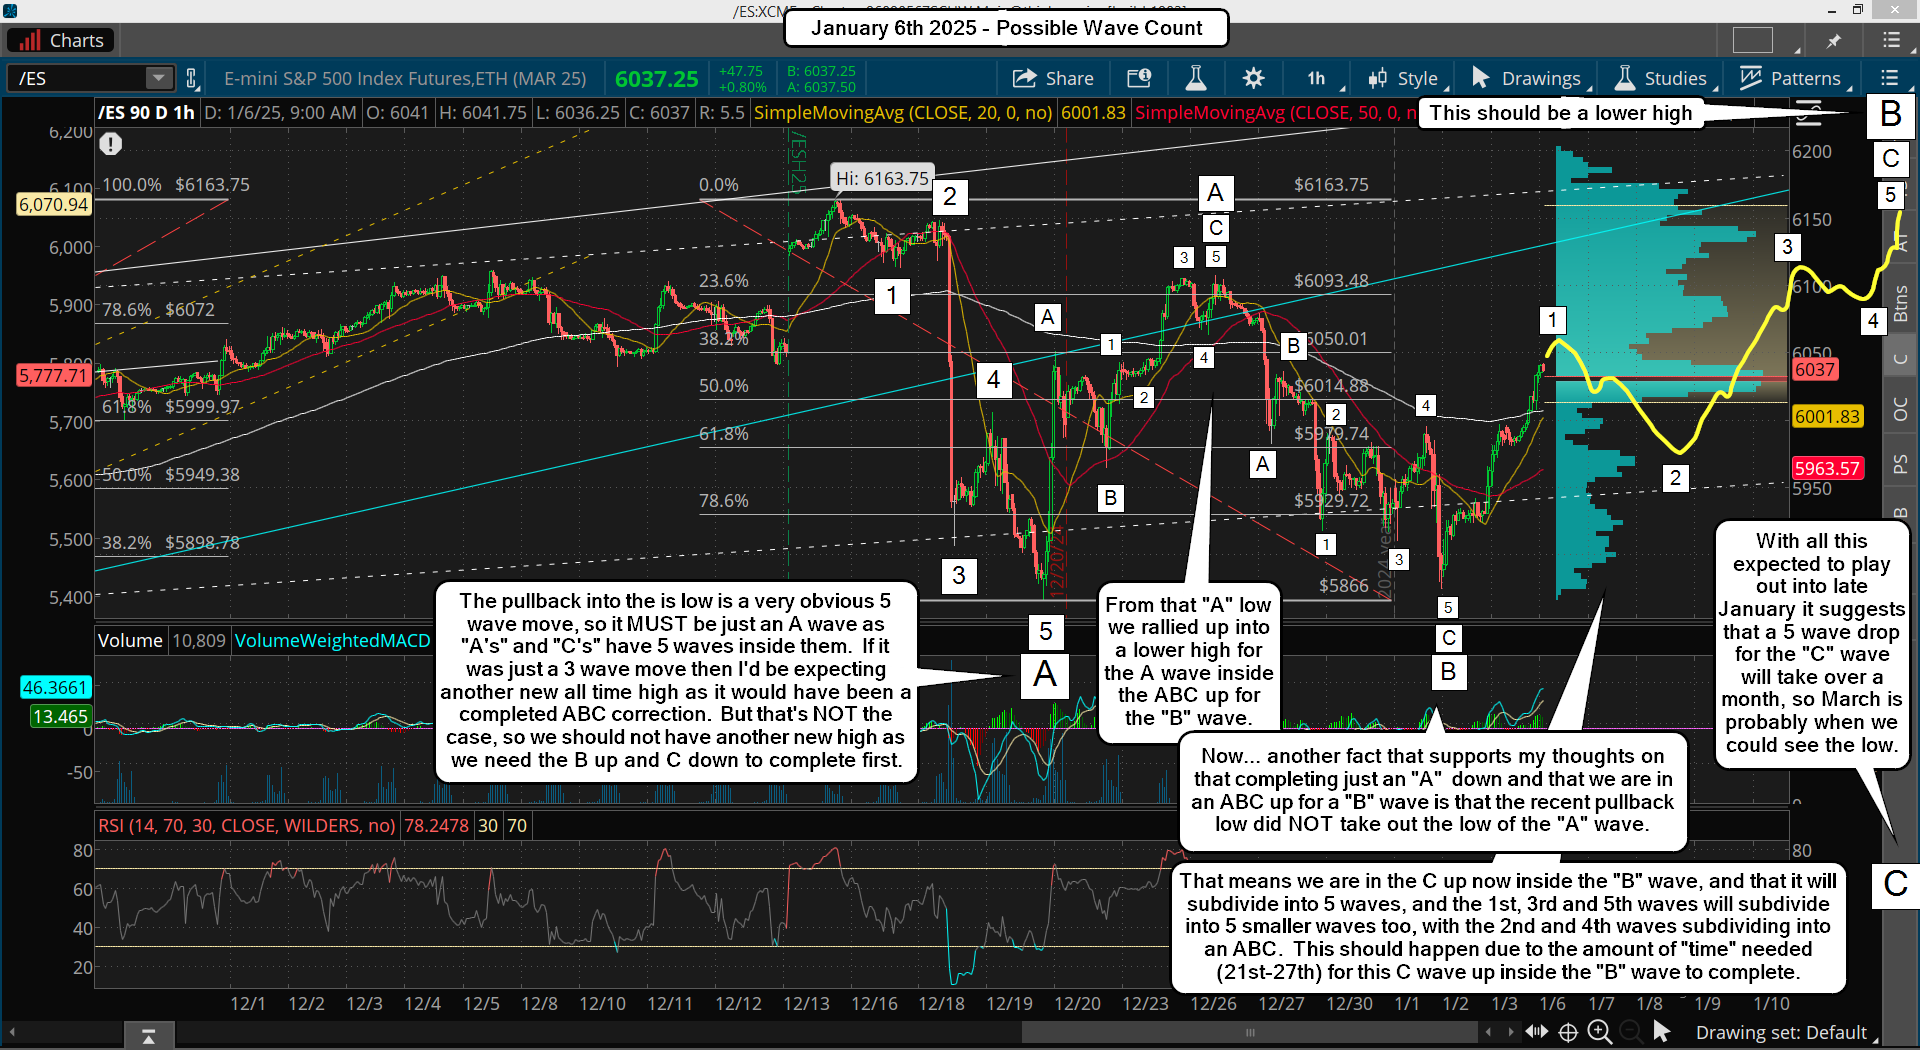
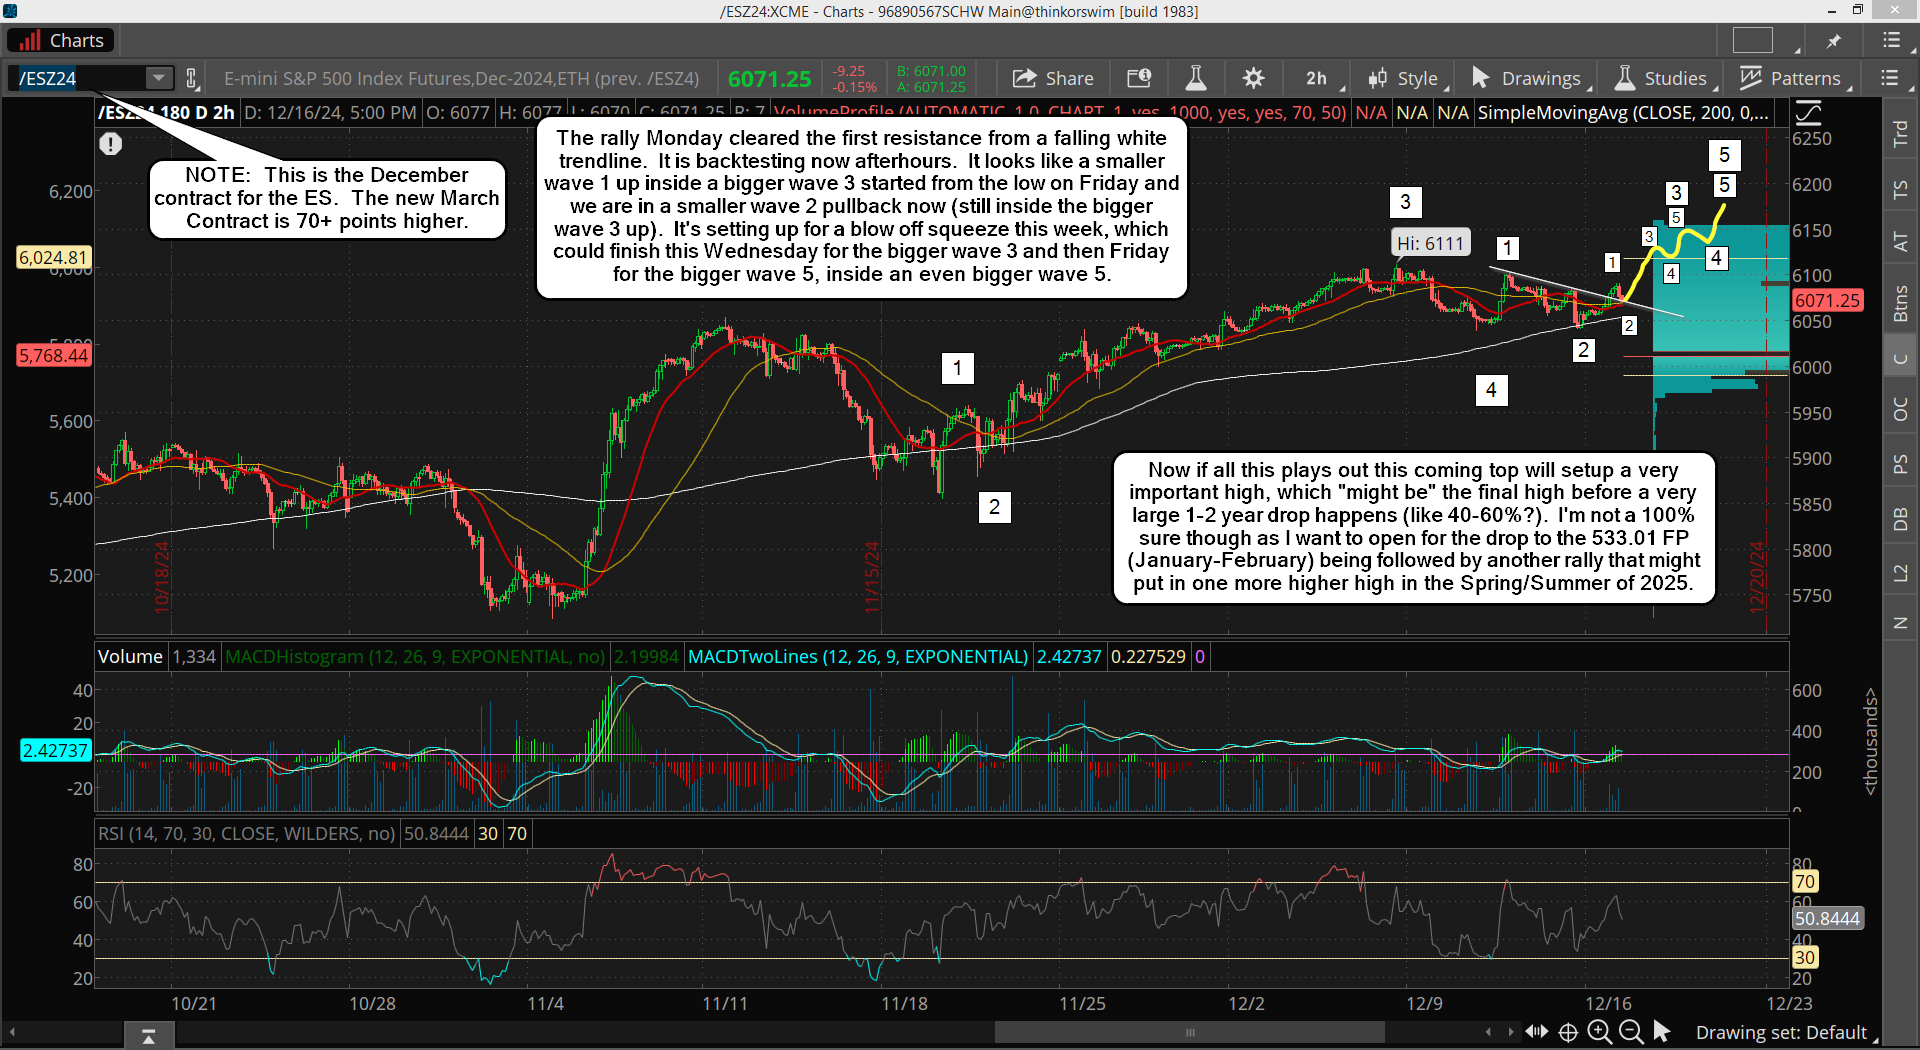
The bottom appears to be in for the pullback, which was a wave 4 of some degree. We are in the final wave 5 up now, which will likely unfold in 5 smaller waves. The move up from the low last week was the wave 1 inside wave 5, and we started the wave 2 from that high of 6050.75, which means this week we should do the wave 3 up inside wave 5 up.

That wave 3 will probably subdivide in 5 waves as well and could last until the end of the month, hard to say for sure. Then a wave 4 pullback inside wave 5 up and a final wave 5 of 5 up to end it all. It might complete before the end of the year but it's looking more like it will drag into the first week of January... again, that's just a "best guess" on the time.

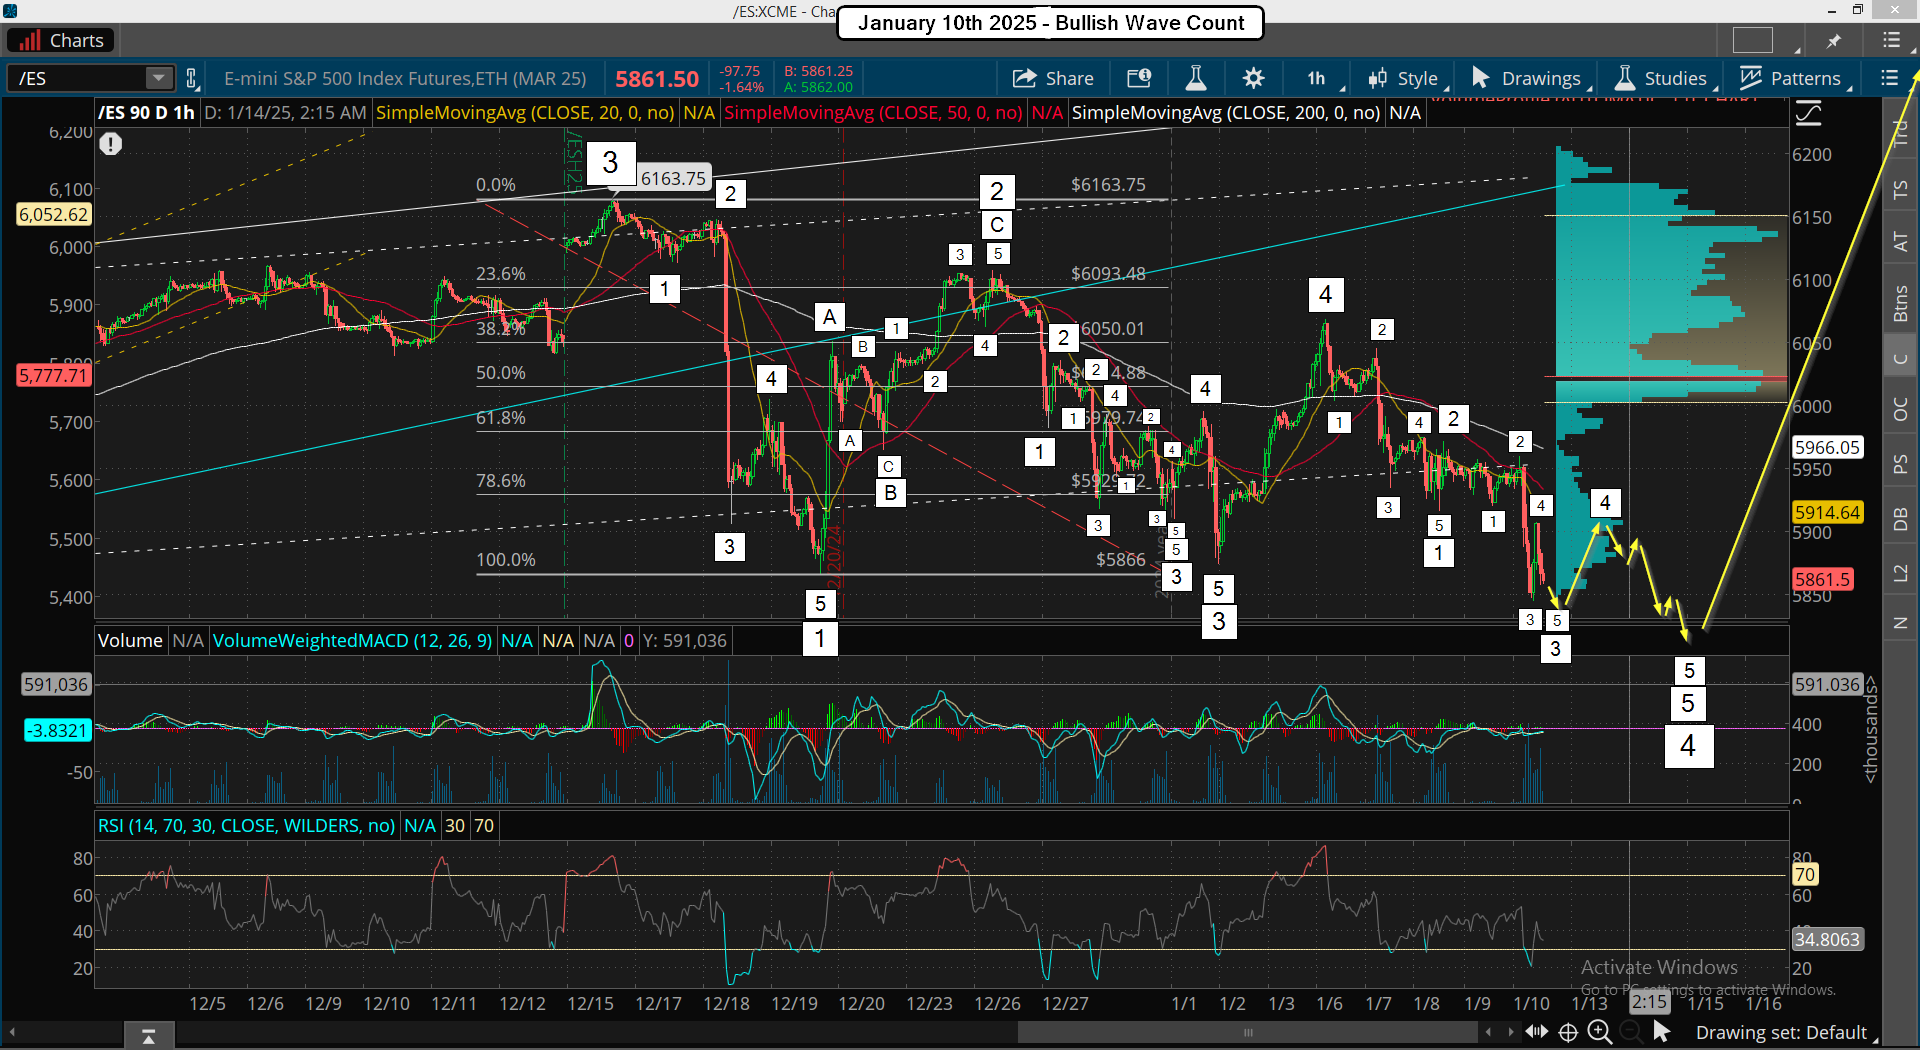
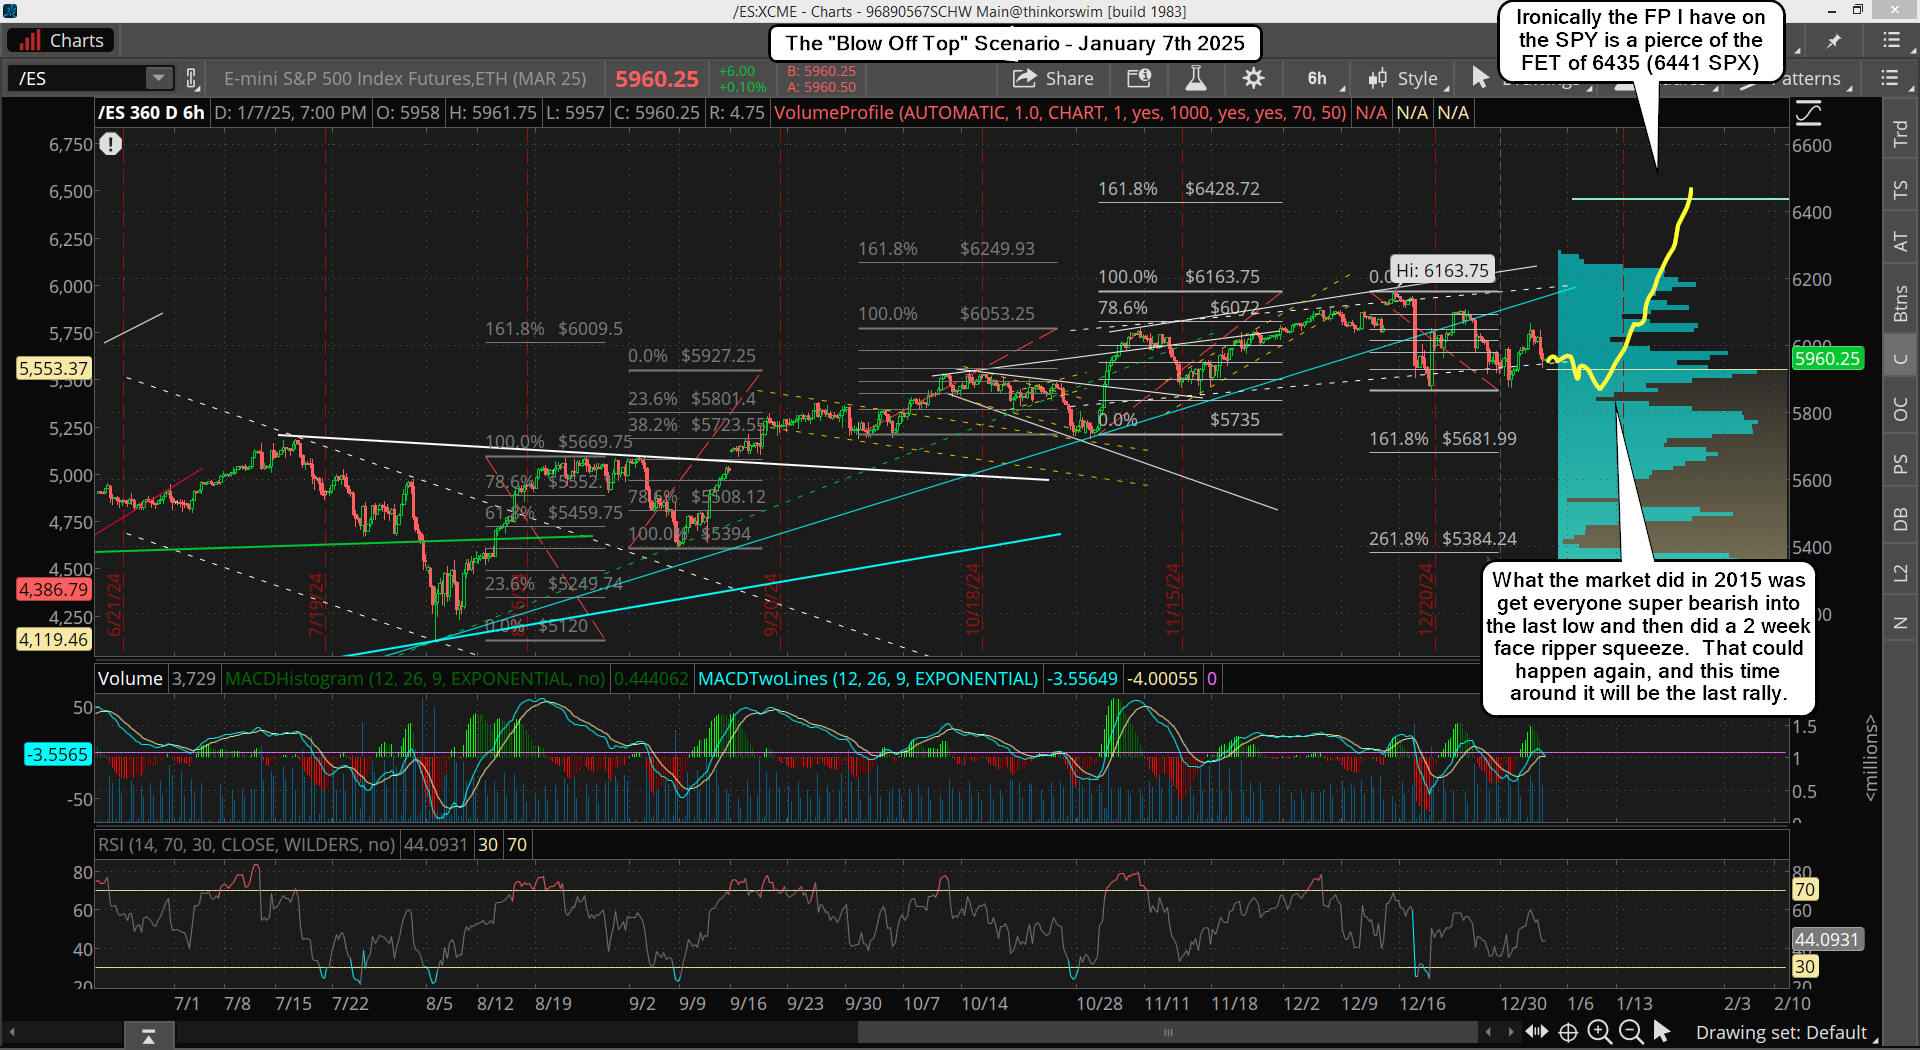
It could be faster of course but I'll be focused on everything, which is the wave count, the technicals, the Fibonacci Levels, and "time windows". On the new March contract of the ES I've calculated 2 more "possible" blow off tops, which are a Fibonacci Extension Target (FET) of 6249.93 and 6428.72, which seems impossible to hit the higher target but I have to be open minded and allow this to play out.

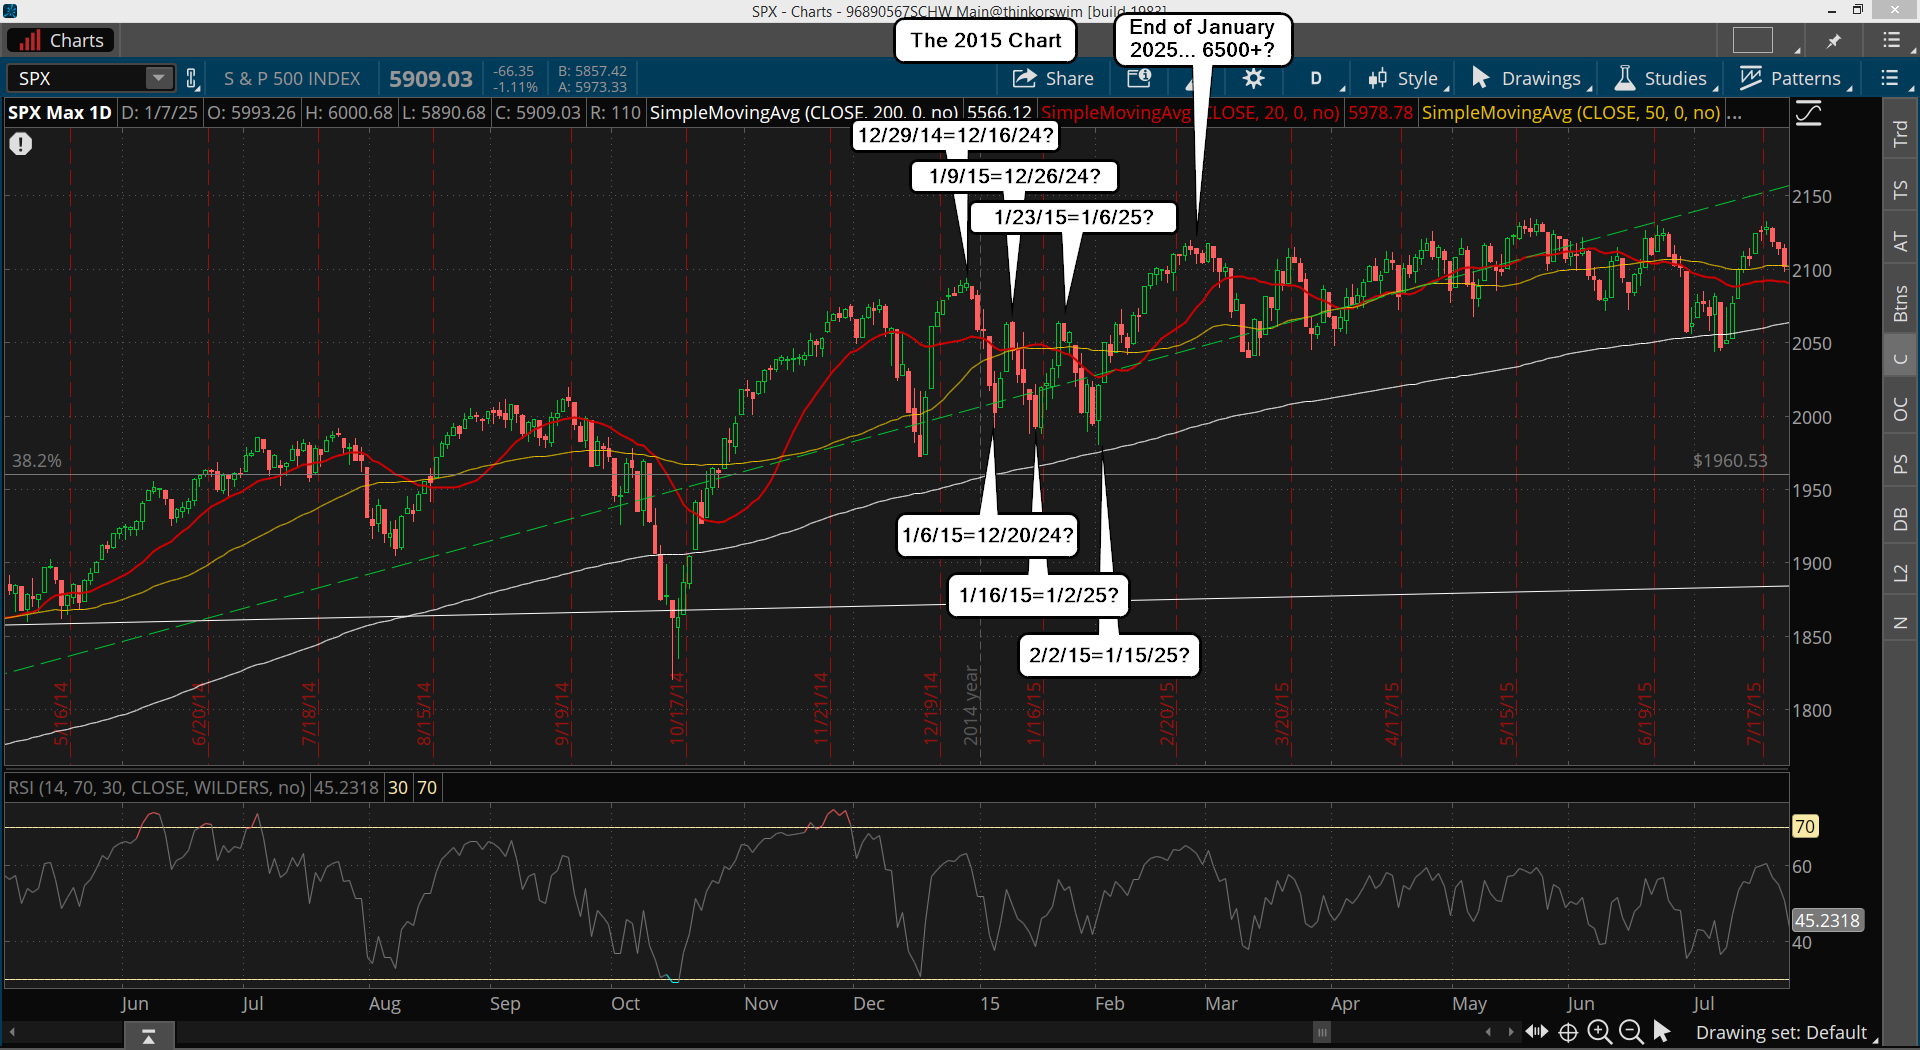
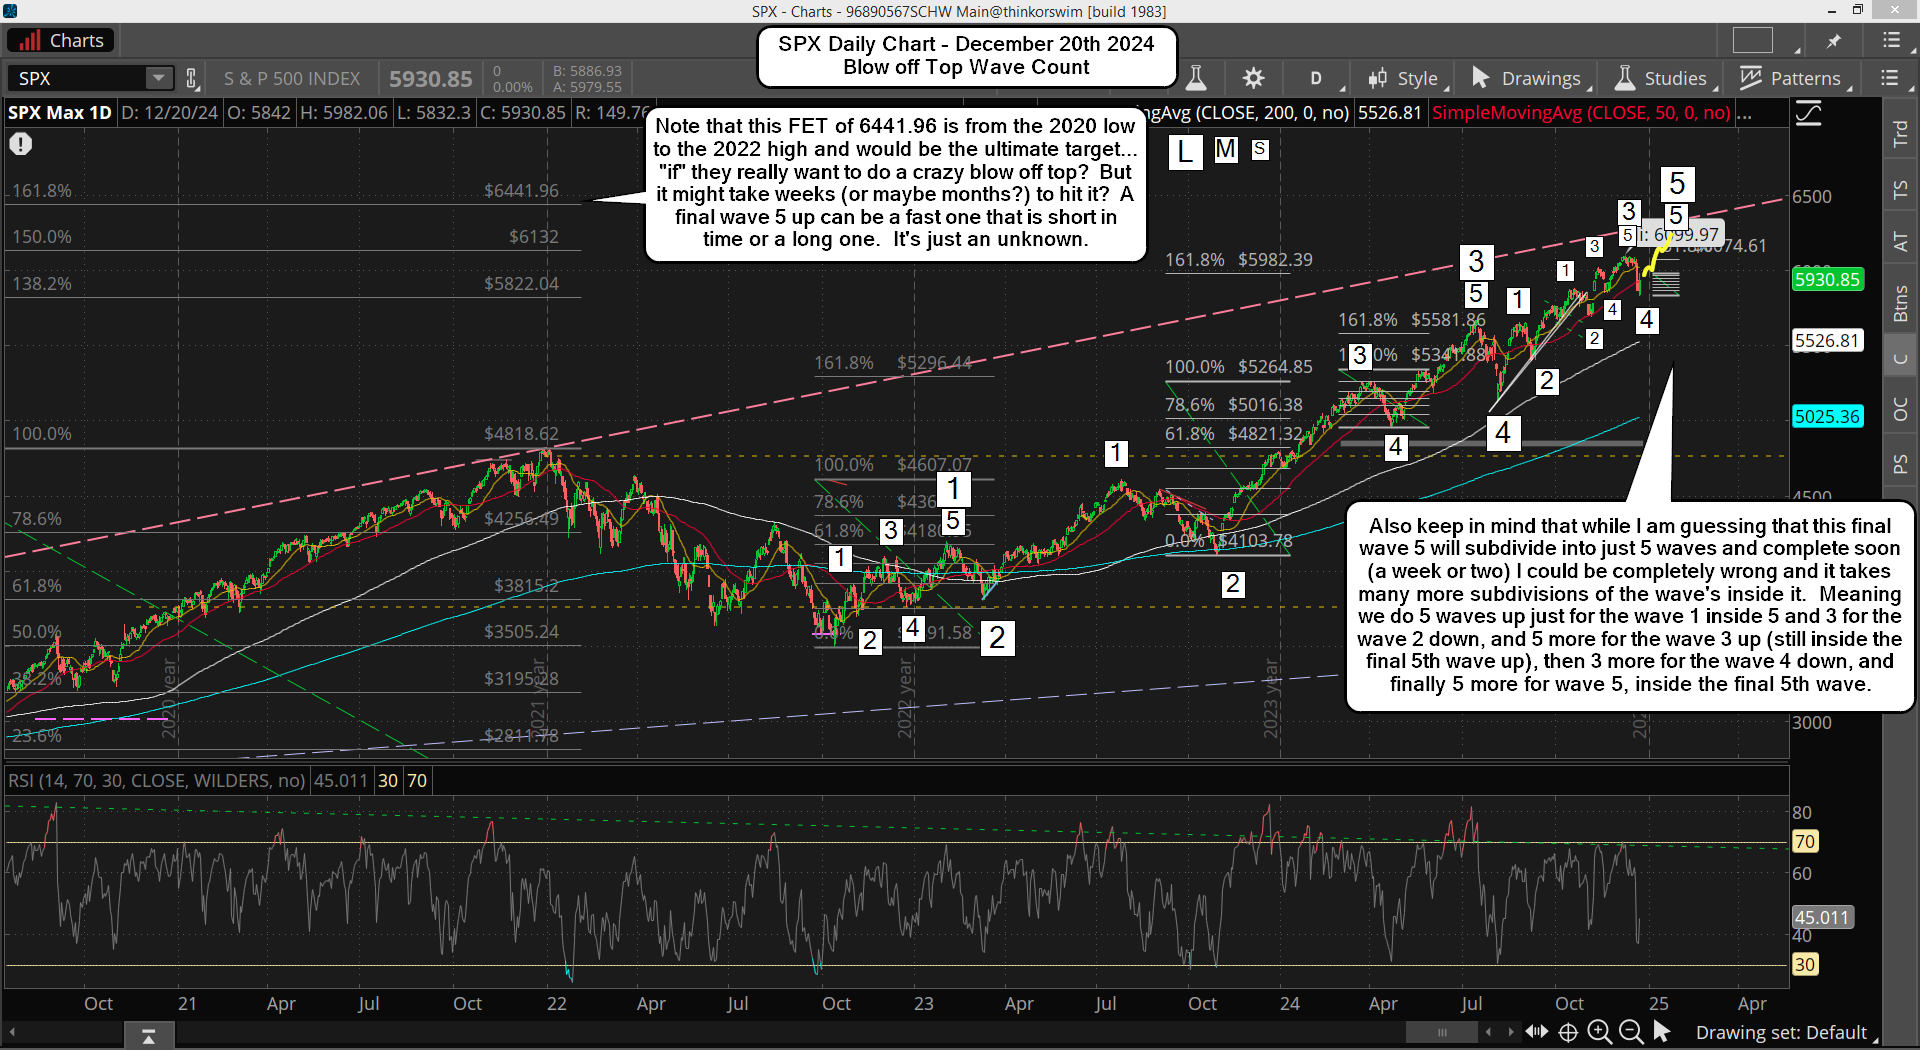
On the SPX Cash those levels are roughly 64 points lower due to the very wide spread between it and the new March contract of the ES Futures, but will narrow over time. Below is a daily chart of the SPX with the wave count on it.

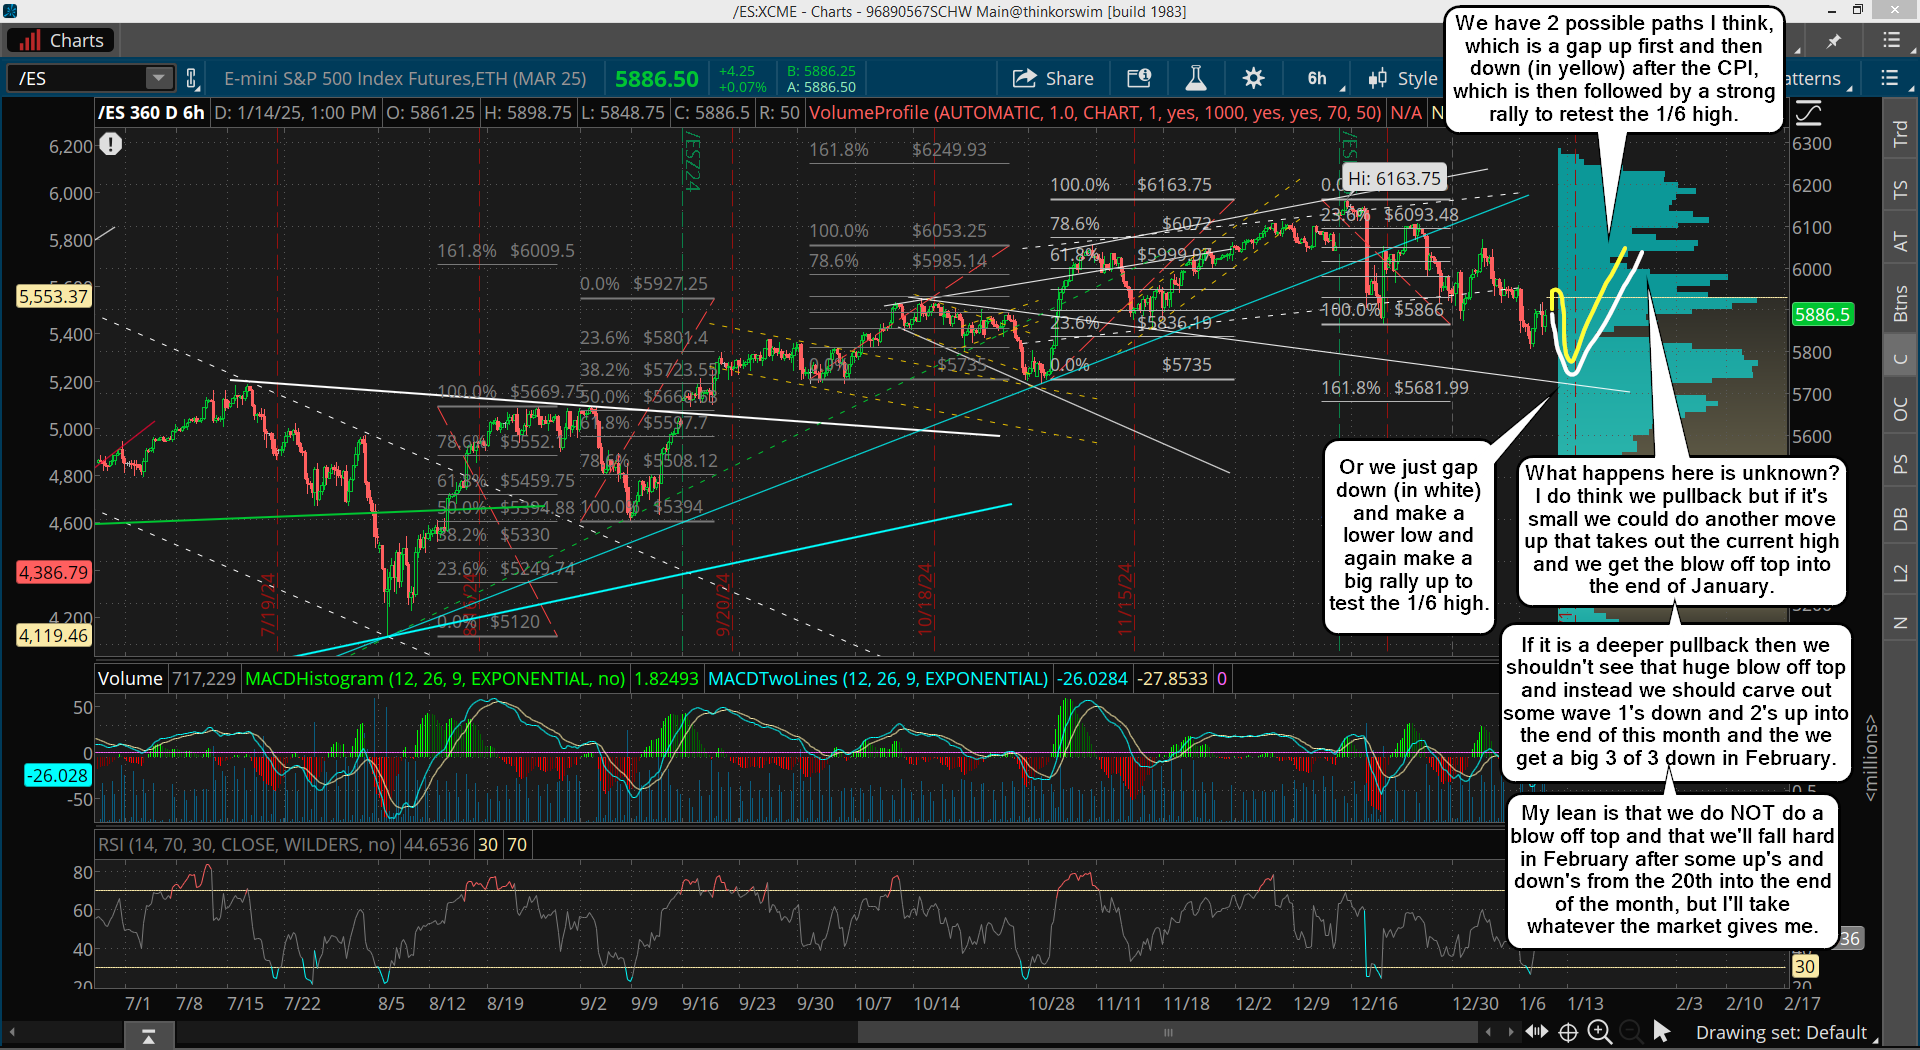
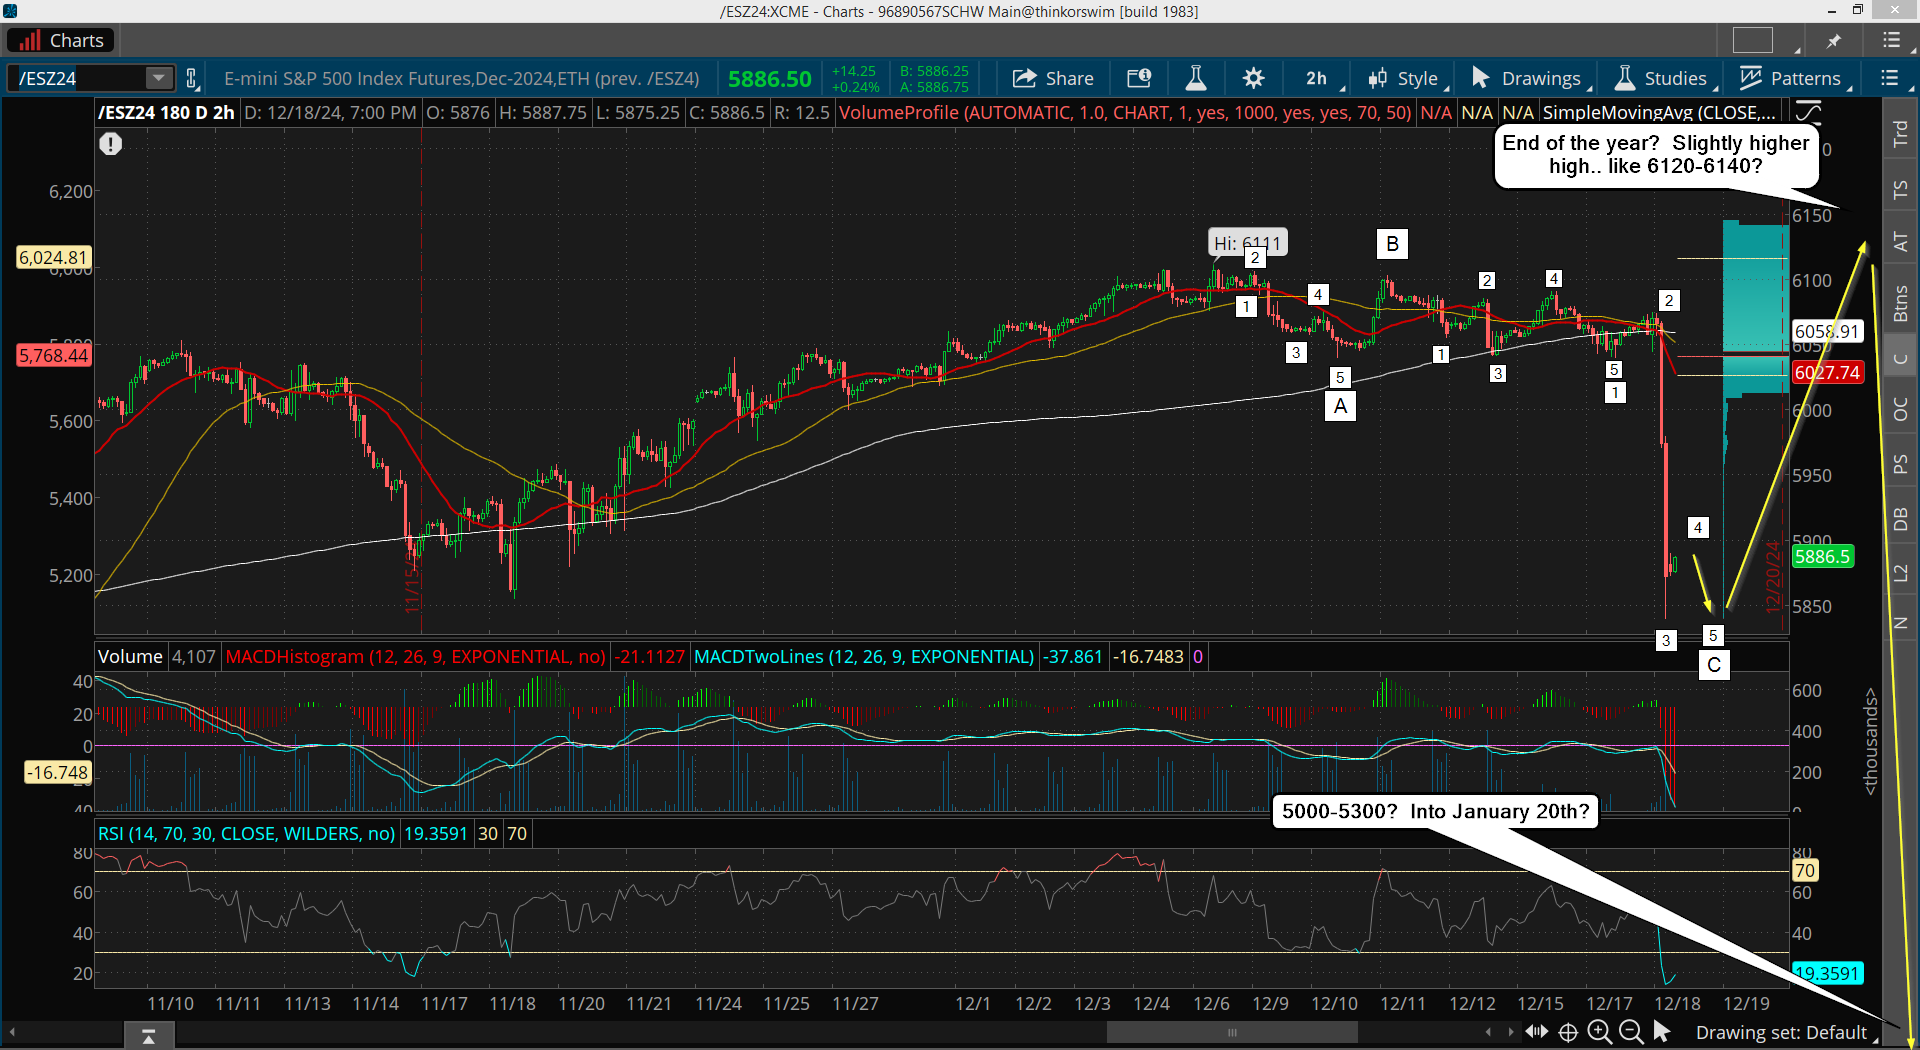
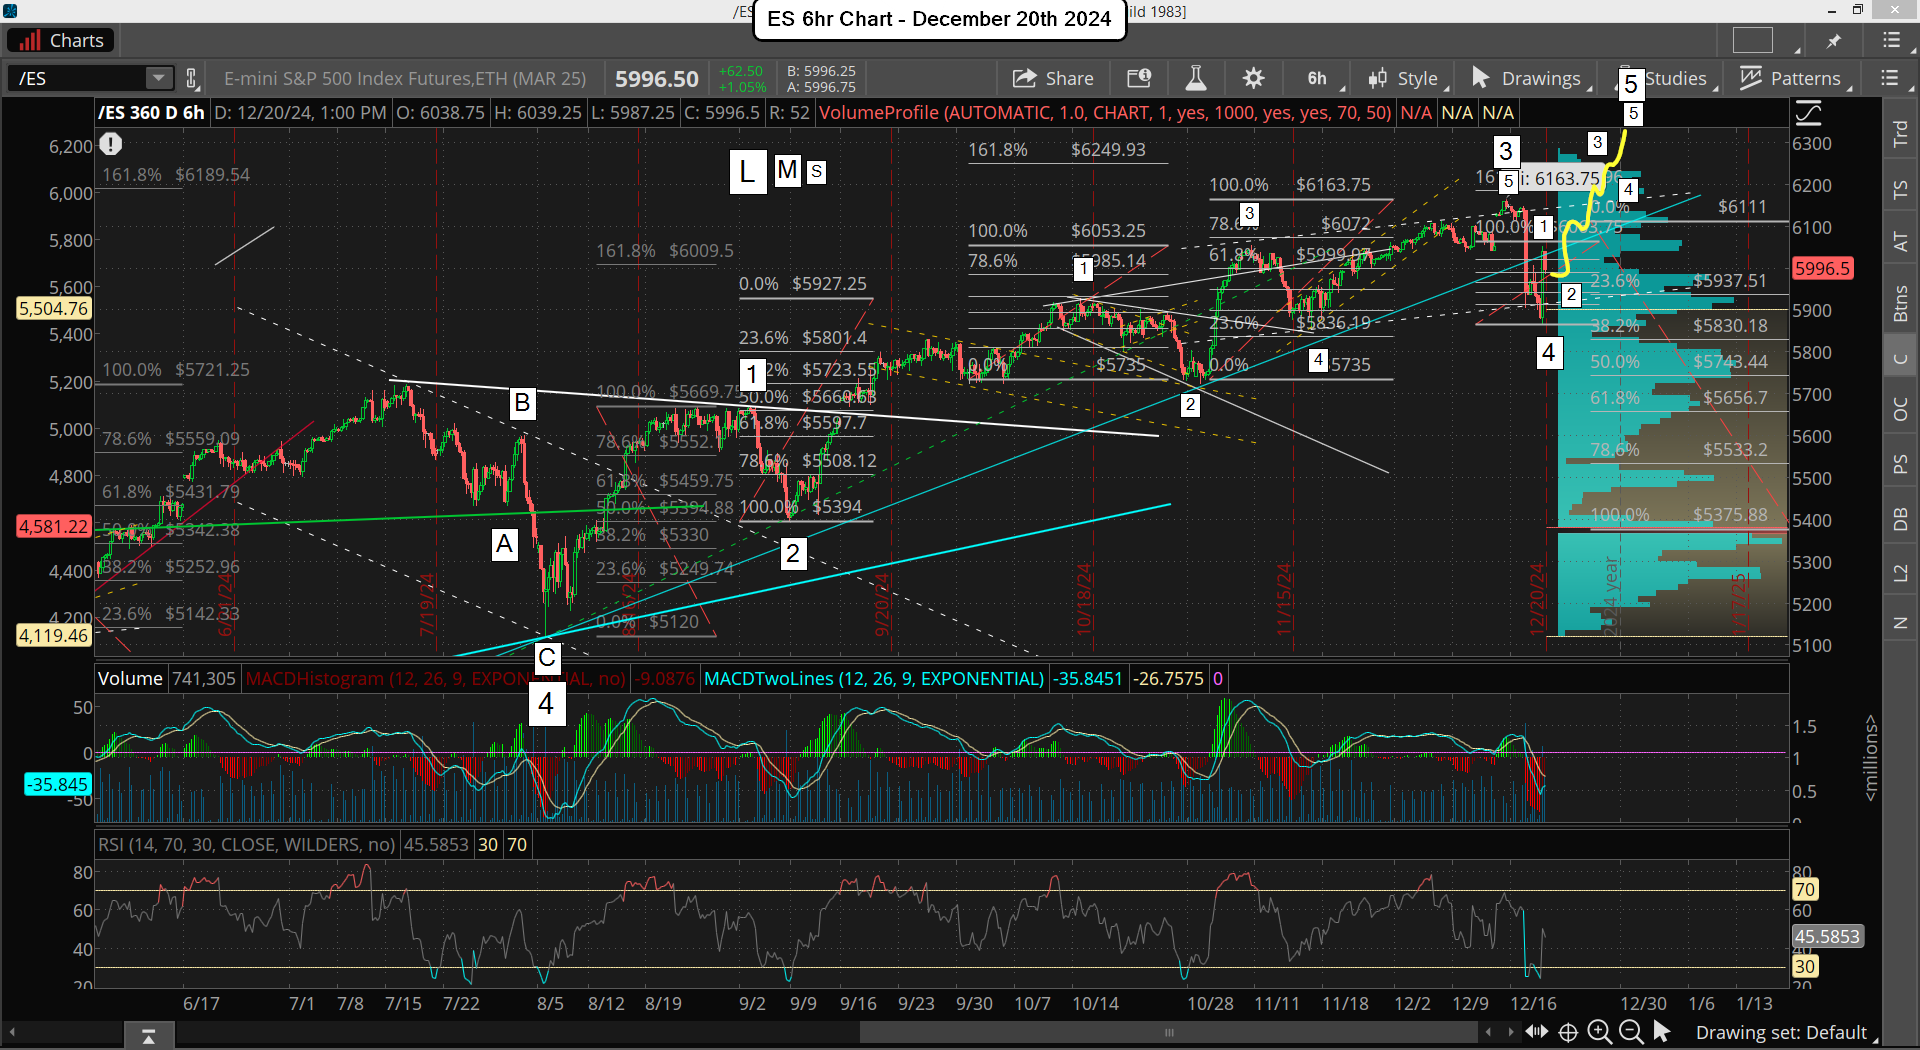
And on the 6h chart of the ES below is what that wave count would look like... "if" we have a blow off in the next couple of weeks?

These last few months of moves up and down make it hard to know for certain the smaller degree wave counts but I think it's right on the bigger ones, which are the most important anyway (at least if you are trying to find the final high). Now it does look like it's going to drag into the first part of January to me (at least), but if we get some kind of crazy huge squeeze this week and into next week then it could end this year, but it's not looking likely to me right now. It just "feels" like it's not going to be an easy top and that it's going to drag out for longer then one expects.

If it's going to drag out longer then we could see the FET of 6441.96 on the SPX hit, which might take several months to happen.  I mean it could drag into April or so if it really starts subdividing a lot.

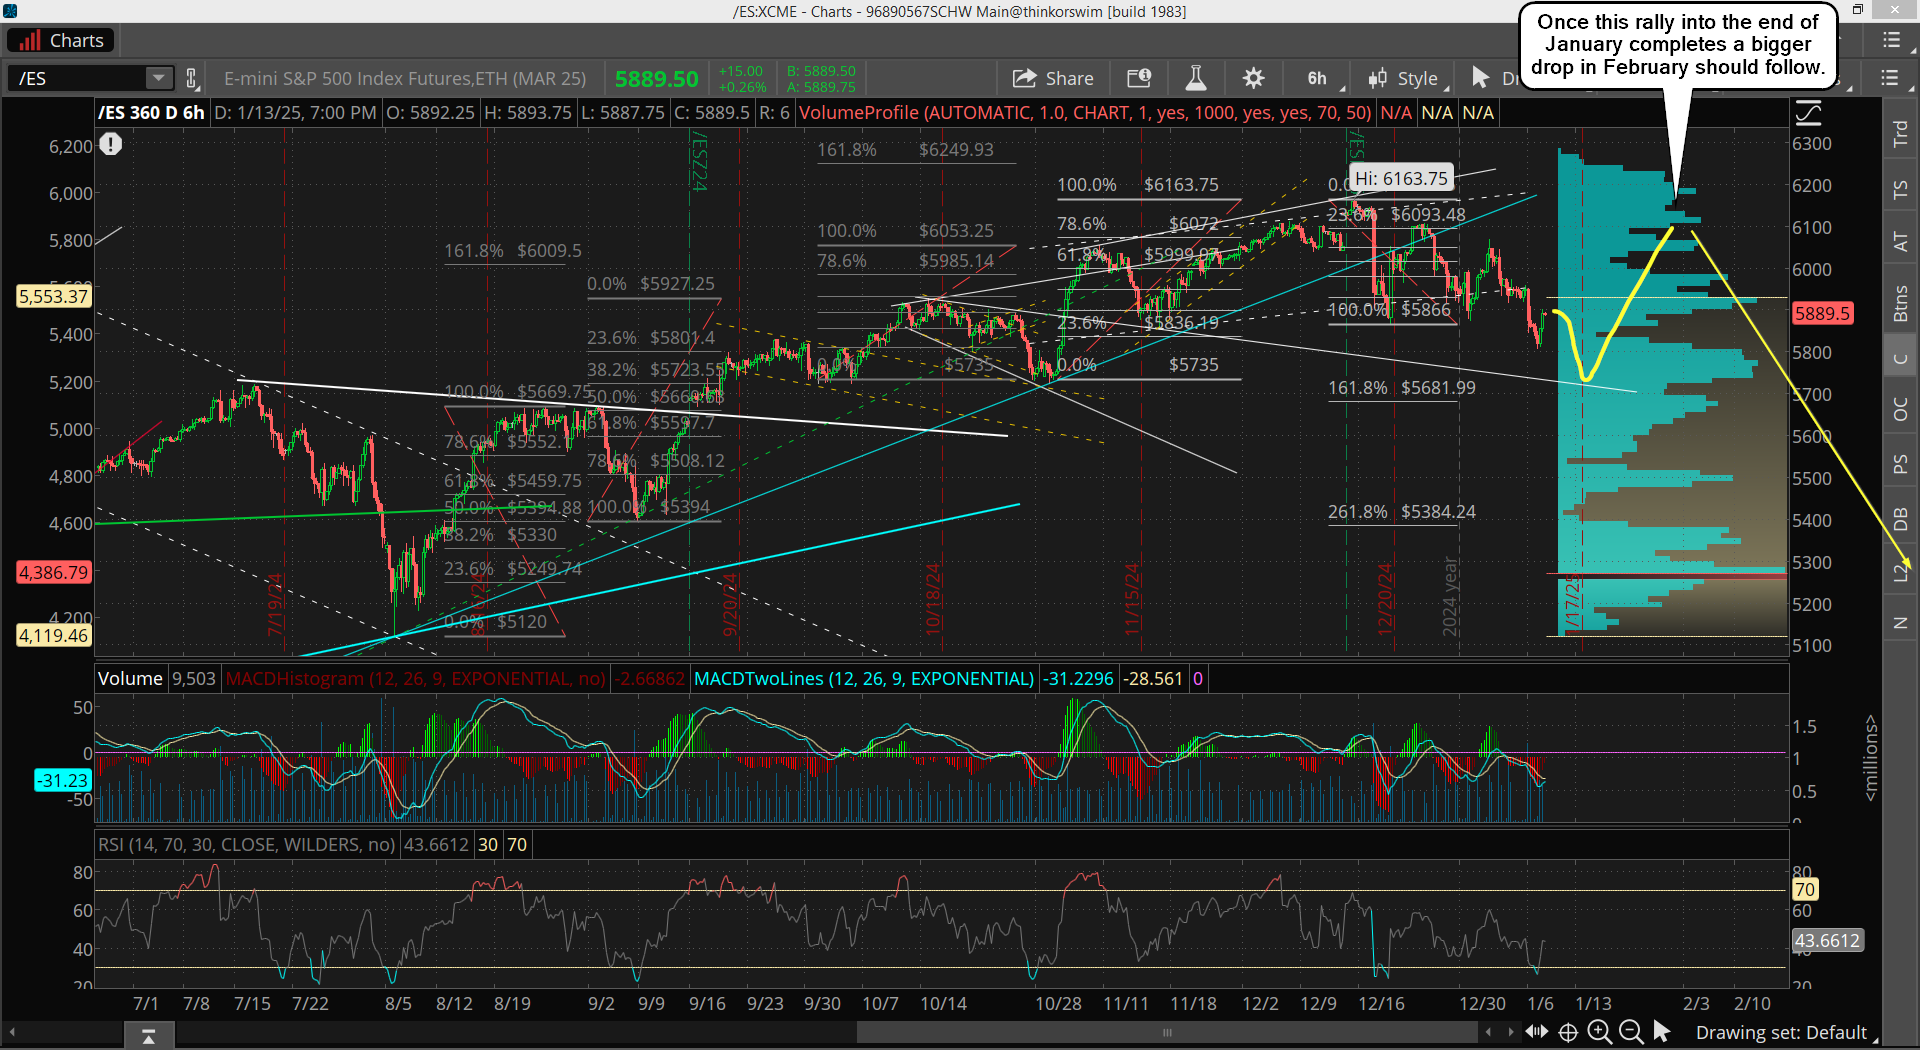
The wave count, starting from the Large Wave 4 bottom on my SPX chart, doesn't look right to me.  I think the Medium Wave 1 up and 2 down are correct but the Medium Wave 3 up seems like it's missing some waves.  What I mean is that it feels like where I have the Medium Wave 5 and Large Wave 5 marked should just be the end of the Medium Wave 3.  Then a deeper pullback should follow (then the recent one we had last week) for Medium Wave 4, followed by a Medium Wave 5 up into March or April.  Below is that chart...

Now again, it's just a "best guess" of course but it makes more since to have the Medium Wave 3 moved to where I show it now on that SPX Extended Wave Count Chart.  It means that the 12/6 high of 6099.97 is just the end of Tiny Wave 5 up inside Small Wave 3, inside Medium Wave 3, inside Large Wave 5.

The drop last week after the FOMC would then be Small Wave 4... NOT Medium Wave 4!  It looks like a small wave correction to me as a medium wave one should be a larger percentage.  If I'm right we'll make a higher high into mid-January to complete Small Wave 5 up inside Medium Wave 3.

Then we should see an 8-12% correction for Medium Wave 4 (in an ABC I'm sure) into February or March.  Lastly we'll see a final blow off rally for Medium Wave 5 up into late March or April..

I'm really leaning toward this Extended Wave Count now, but again I'm open to see a blow off rally happen in the next couple of weeks.  But personally I don't think it will.  I think there's too much negative news out there about some January crash, which means the opposite should happen.  We should rally up in a 5 wave series (Tiny Waves) to complete Small Wave 5 in mid-late January, which then completes Medium Wave 3.

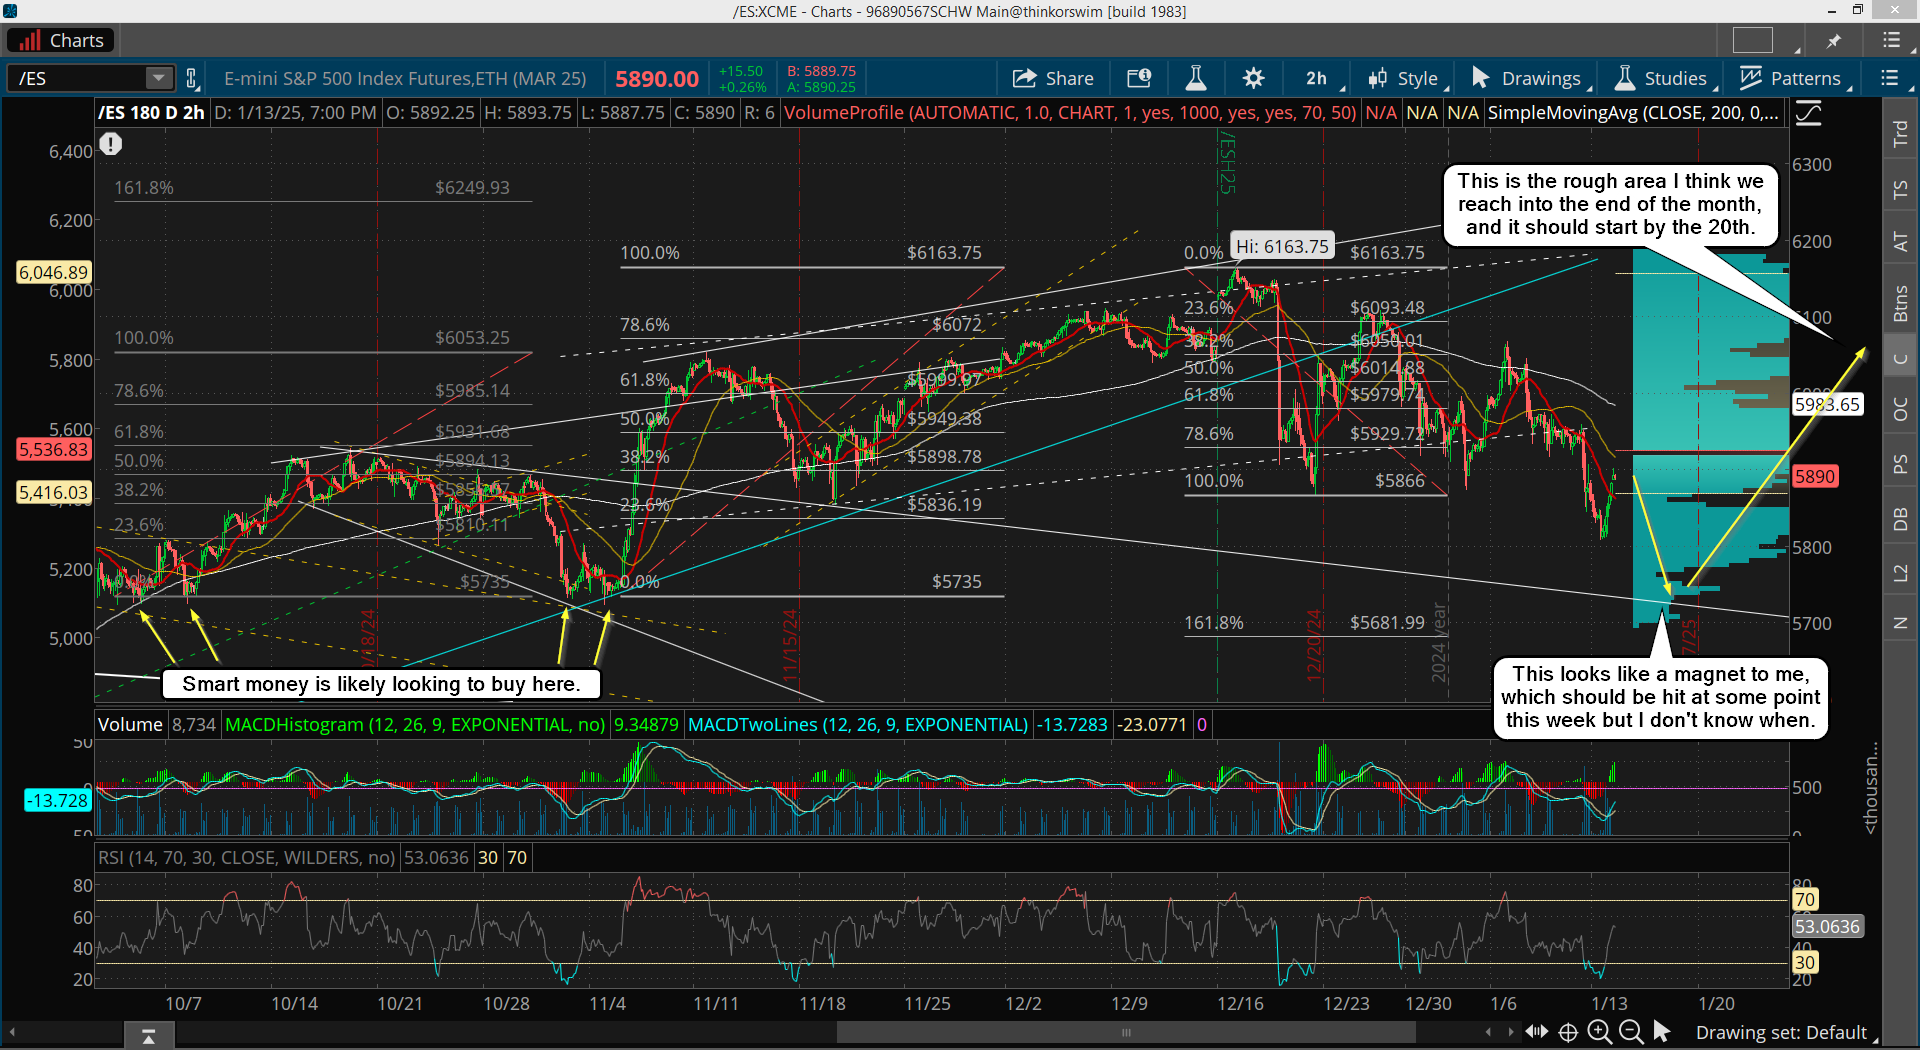
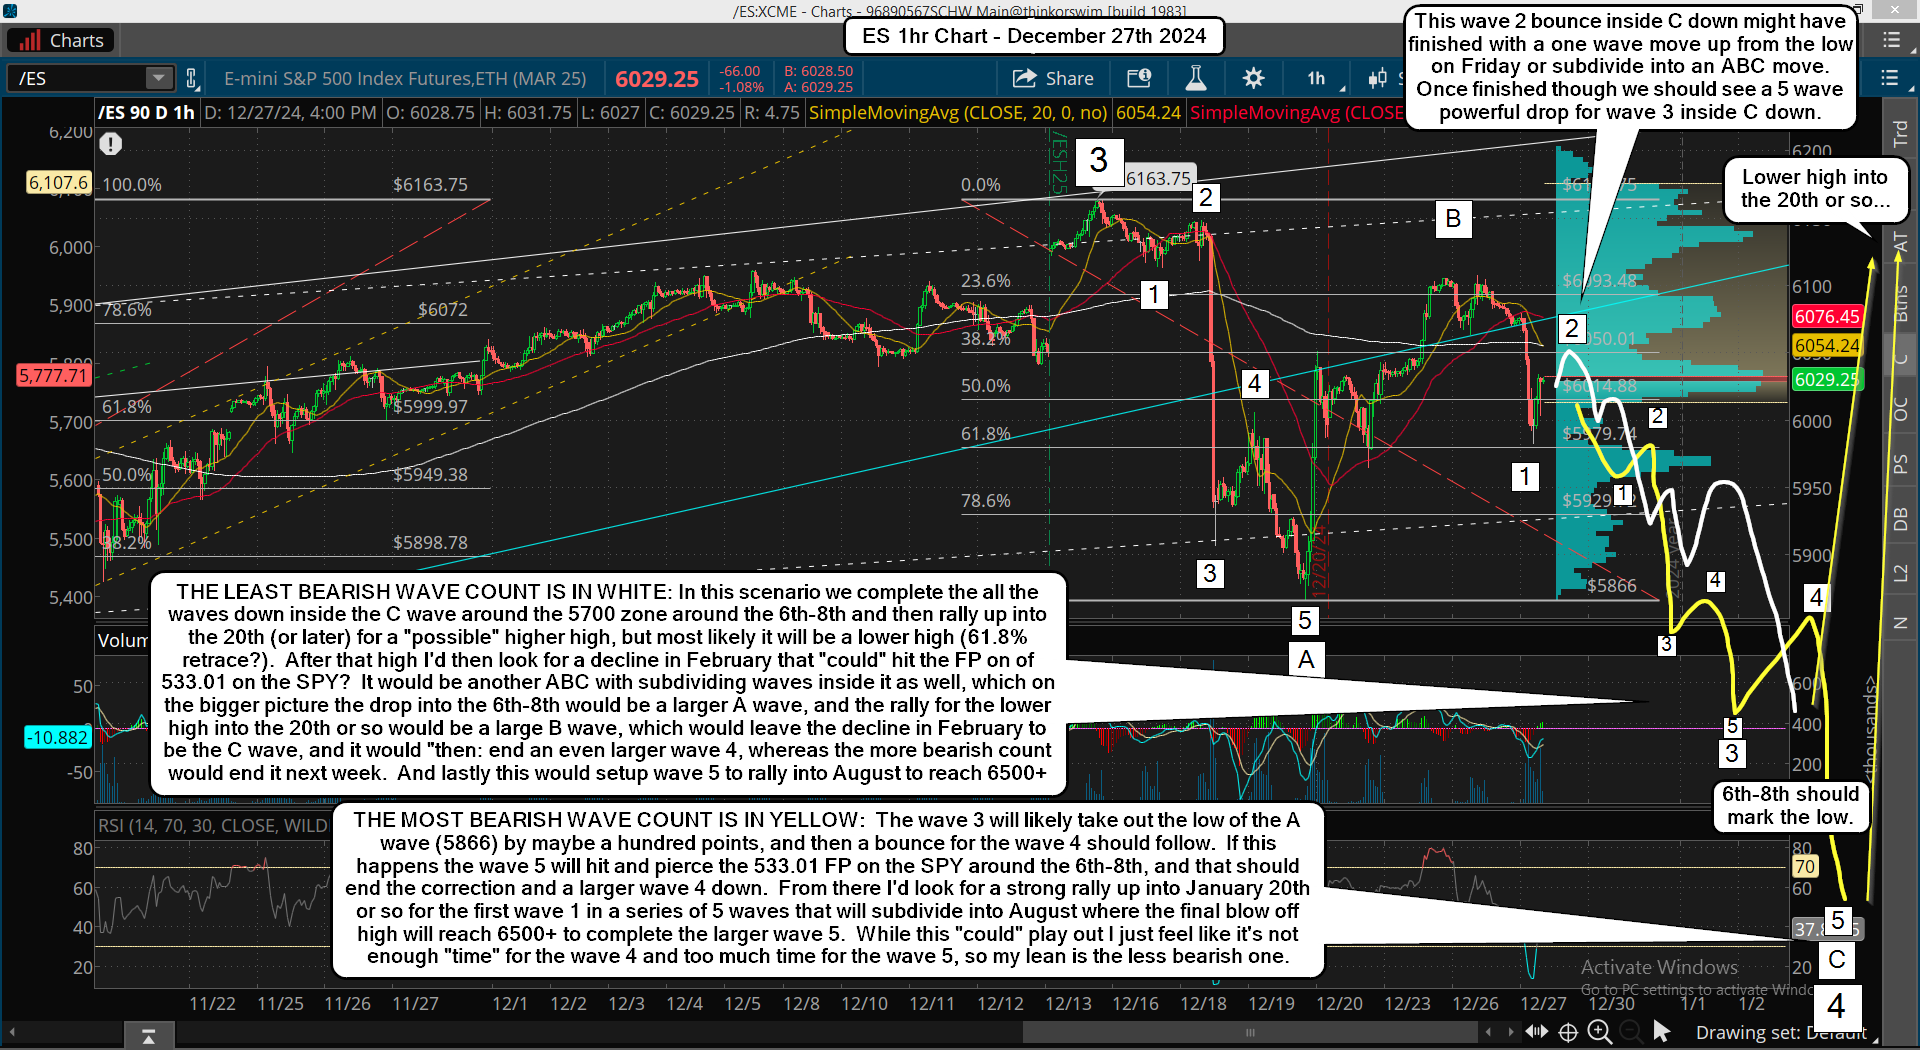
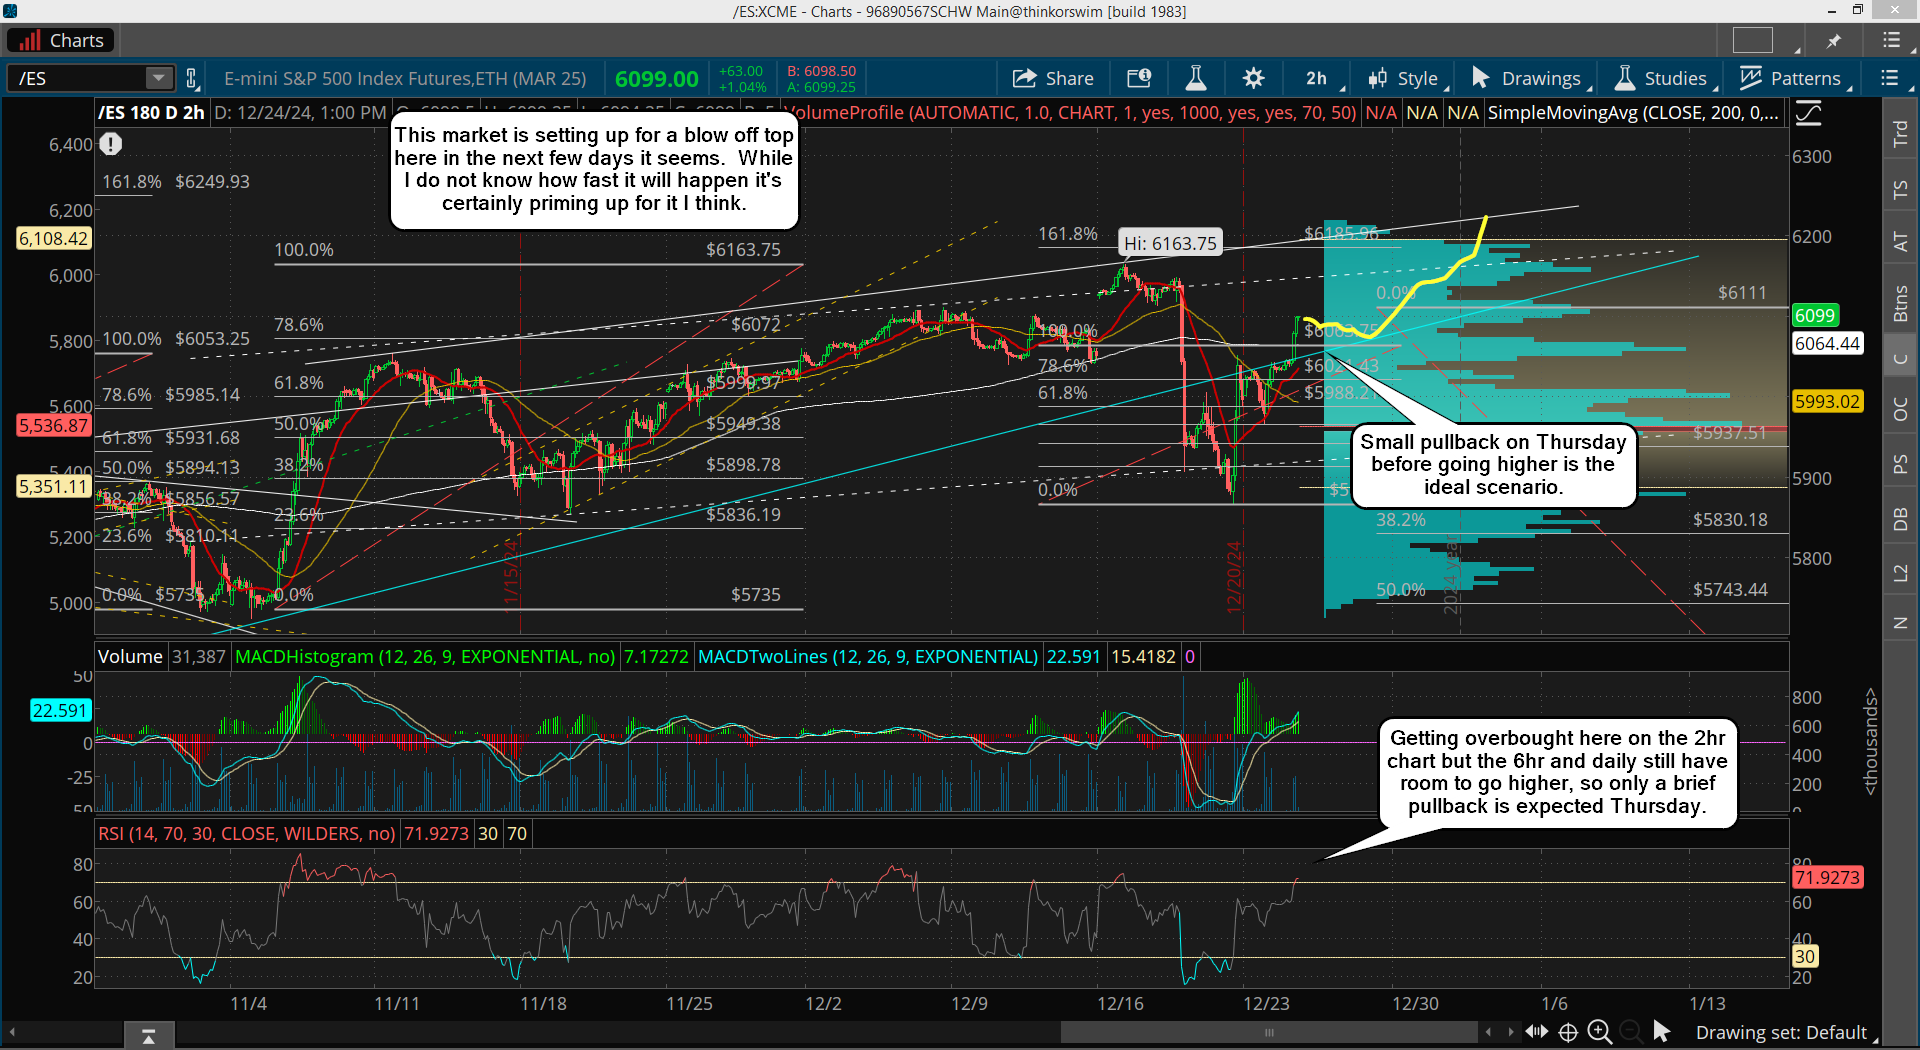
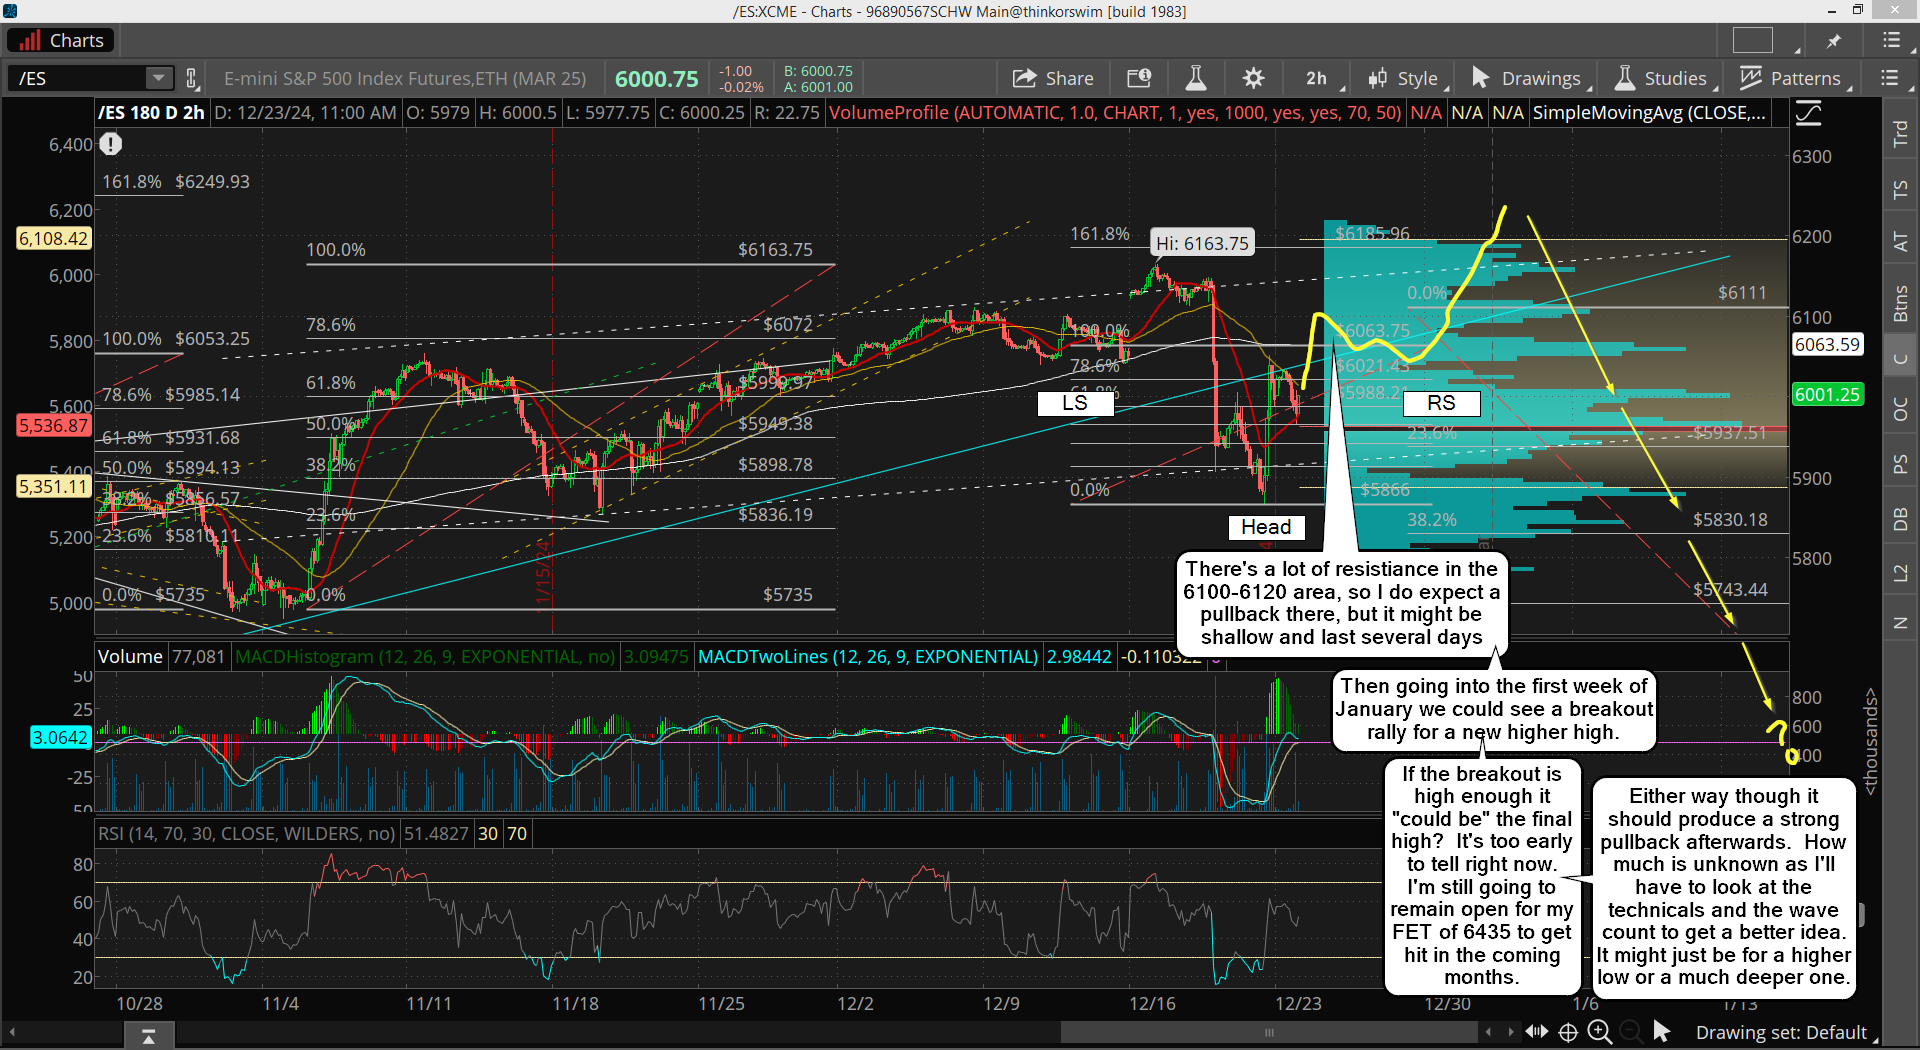
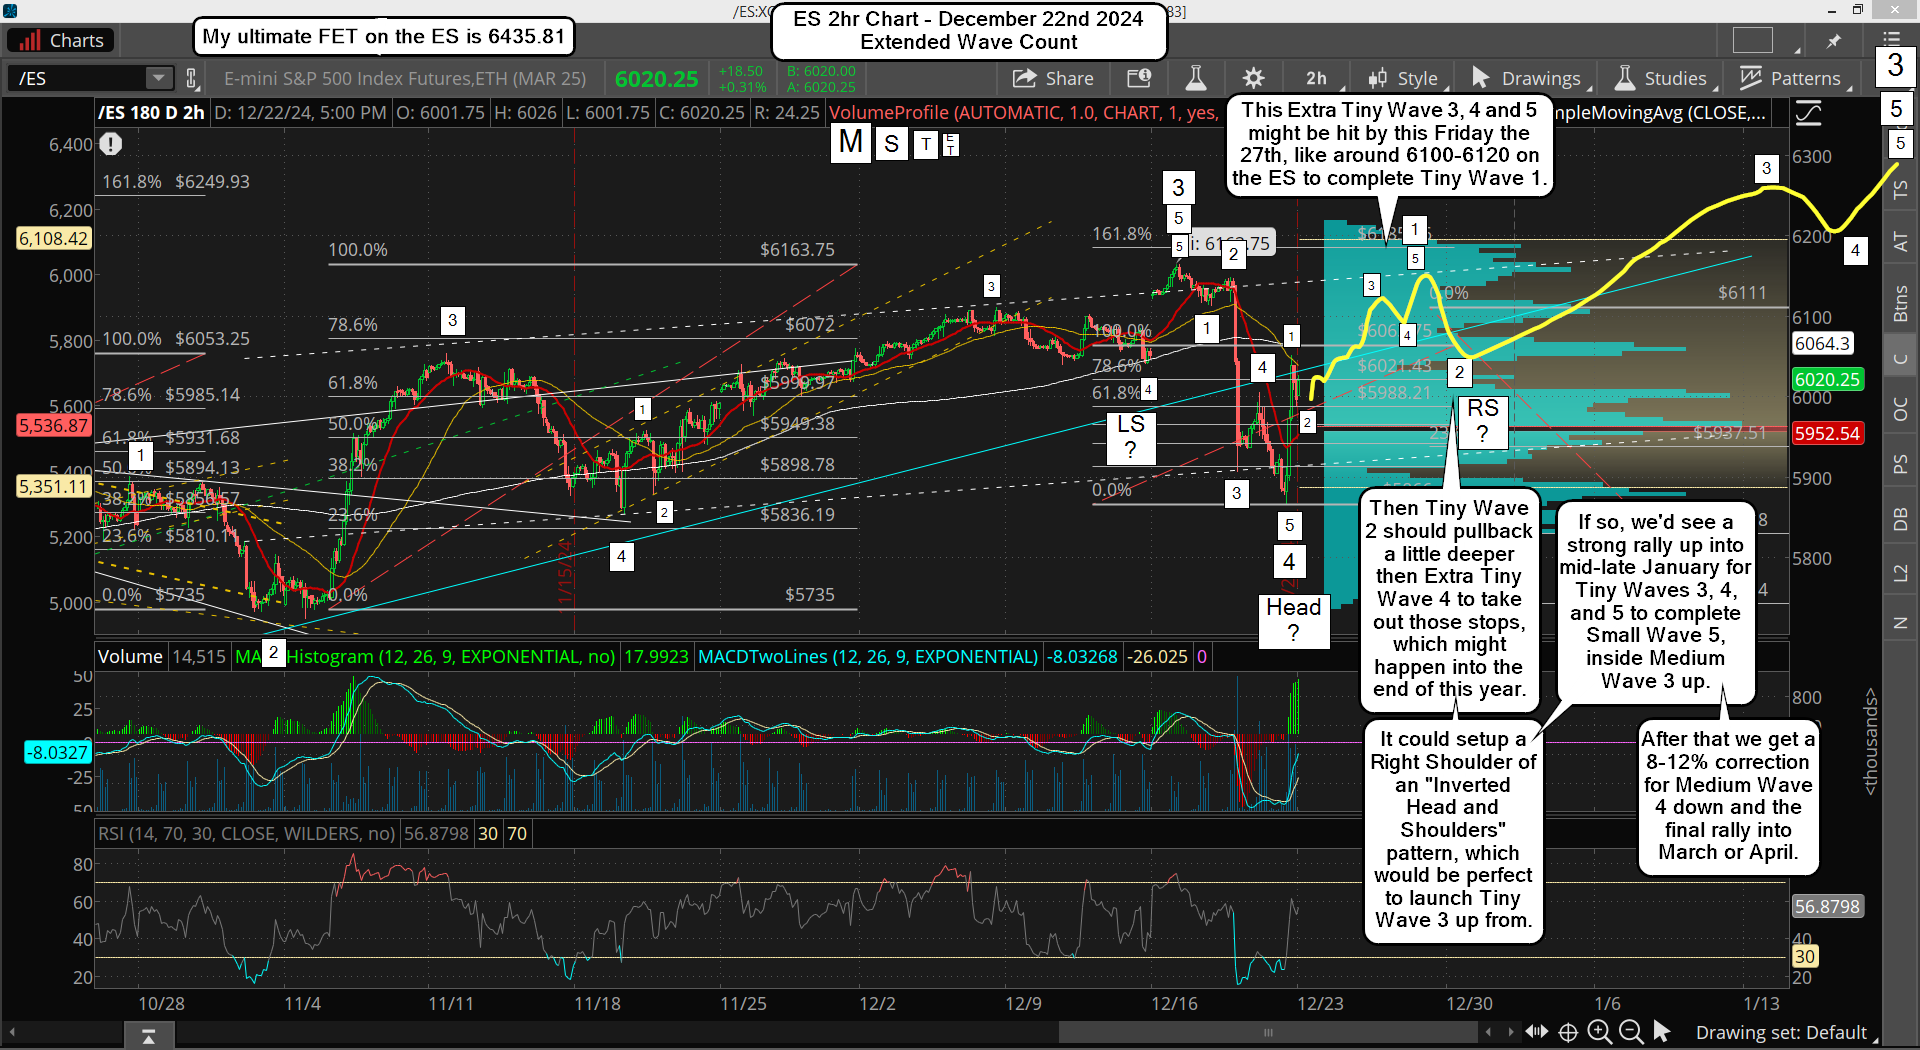
Moving on to the short term.  Below is a 2hr chart of the ES with the possible wave counts marked on it.

In closing, I lean toward the extended wave count as that will do the most damage to the bulls and bears both I think.  I have the FP on NVDA that has yet to be hit (160.22), which likely would be if we get this extended rally.

And I have a new FP on the SPY that has a crazy upside target, which fits right in line with the extend wave count, and would be a little higher then my ultimate FET's on the ES and SPX.  So I have more evidence to suggest we go much higher and drag out in "time" versus what I'd like to see of some blow off crazy squeeze in the next few weeks.

Have a blessed day.

ES Morning Update December 20th 2024

0

A choppy day yesterday as the market is carving out the wave 4 bounce and wave 5 down to complete the C wave. We might see a little more chop for a few days but the down move should be finishing up here soon and then we'll see the Santa Rally that should take the SPX back up to a slightly higher high before the end of the year. Today is Friday and typically there's a late day move up, but might not see it do the biggest squeeze until after Christmas, hard to say for sure. Possibly we see some kind of series of wave 1's up and 2's down play out in the next few days to setup the wave 3 up after Christmas, which will be inside a bigger wave 5 of course. I'll start charting the March Contract of the ES next week as the December one is over with now.

Have a great weekend.

ES Morning Update December 19th 2024

2

WOW! That was one crazy drop yesterday! I talked about a "fake out" move yesterday and I certainly wasn't expected one that big. I wanted a last move up for a higher high to short but was open for a move down instead, which is what we got. I did not short it as I just didn't know which way it was going to go.

But now that we've seen the big flush I think we are going to see a final rally start today (maybe Friday?) that will last until the end of the month (maybe sooner?) where this entire move down is erased and we put in a new higher high... but not the DOW, just on the SPX/ES (probably the Nasdaq too but I'm positive).

I'm looking for 6120-6140 on the SPX into the end of this year and that will be the final top before we fall off a cliff for real, and the first downside target will be the 533.01 FP I suspect, maybe lower? As for today, I'm looking for a double bottom test as it's pretty clear that yesterday was a wave 3 down inside a C wave of some degree.

We just need the wave 4 up (which started yesterday after the low) and the wave 5 down to finish it. Then it's up, up and away into the end of the year. I'm looking for a long today, and bummed that I missed the short but that's life.

Have a blessed day.

ES Morning Update December 18th 2024

0

Up, down, up, down, but going nowhere... that's the market of the last week or so. A big move is coming, but I don't know if it's an up move or down move? With the FOMC at 2pm EST the market should remain in a zone until after the meeting.

My thoughts are the following...

Scenario ONE: The market rips higher after the FOMC and closes the day near the high with some kind of 100+ point move.  Basically it just takes out the 6111 prior high (December contract) by at least 20 points it's a stop run basically.  Ideally we hit 6166 for the ritual number play, which today is also a ritual number day.  But that's not required.

Scenario TWO: The market flushes down into the close after the meeting (how much I don't know... 100 points?) and that puts in the bottom for any correction we've been in since the 12/6 high if 6111 (December ES contract). Then we rally back up for another week or so to reach 6150+ (probably 6200+) as if we do flush lower the final high should be pushed out for another few weeks... meaning we could see the Santa Rally after all.

I want to see Scenario ONE so I can short the pig but I don't usually get what I want. So I have to be on the lookout for Scenario TWO as a flush-out drop lower first as a fake out move and then a final rally up afterwards in the coming few weeks. Bottom line here is that whichever way the market goes first, after the FOMC and into the close, the opposite direction is the next likely true trend move.

Have a blessed day.

ES Morning Update December 17th 2024

0

While the ES has now rolled to the March contract I'm going to continue referring to the December contract for right now. Just add 70+ points to get the targets for it. Ok, so Monday we had a nice rally up as expected and if all goes well we will continue higher into a blow off top this Wednesday (most likely). Here's a chart below of what I think is possible...

As you can see this final move up can happen this week. It will then produce a pullback into Christmas that will be the early part of the expected drop to the 533.01 FP on the SPY. It will unfold in an ABC of course and the A and C waves will have 5 waves inside them. What I think we will see is the wave 1 down and 2 up (the Santa Rally) inside the A wave down.

Then January will have some nice swings in it as the wave 3, 4, and 5 of the A wave down plays out, then the B wave squeeze (probably in front of the inauguration on the 20th) and the C down afterwards and into early February. It could play out much faster of course but that's what I see right now.

Have a blessed day.

ES Morning Update December 16th 2024

0

This most important thing this week is the FOMC on Wednesday, so between now and then we might continue to be rangebound between the all time high and the recent pullback low, which might extend down to 6000 or so. Overall though a hundred point range is a tight one and should lead to a breakout of the zone soon.

I think we'll see one more higher high but I'm not looking for 6300+ at this point. Maybe it's just a few points higher, or even up to 6200, but I don't see much more. It's reminding me a lot of the 2020 high, at least from a pattern point of view. Now I doubt if it follows that move again but it might rhyme with it in some manor.

Back then the first drop was just under 16% and if it followed exactly from the current all time highs that would be equal to 5190 on the ES and 5133 on the SPX. Interestingly my FP on the SPY of 533.01 would put them both around 5400, which would not be a 16% drop but it would be similar for sure. The market never repeats some prior move exactly but it does repeat prior patterns, and that's the pattern I currently see the market the closest too.

Again though, it's all just speculation until we seem a real break to the downside start. It could be right after the FOMC, especially if we get a pop higher on that day which fades small on Thursday and Friday with the high being put in on Wednesday. Then the week after we see a surprise drop happen that shocks everyone. Currently this is just a dream but the market loves to surprise everyone, so don't be shocked if we see a big drop happen before the end of this year.

NOTE:

We are rolling into the March 2025 contract now on the ES, which the December 2024 contract is about 5-6 higher then the SPX cash.  The March 2025 ES contract is now 70 points higher then the December 2024, which is about 75 points higher then the SPX cash.  This makes it hard to keep track of the levels but on this post I'm referring to the December prices.

So with a 75 point spread and gap up on the March contract this will open the door for 6200+ on it, but keep in mind that the SPX will be 75 points lower.

Have a blessed day.

s2Member®