Friday, December 27, 2024
Home Blog Page 5

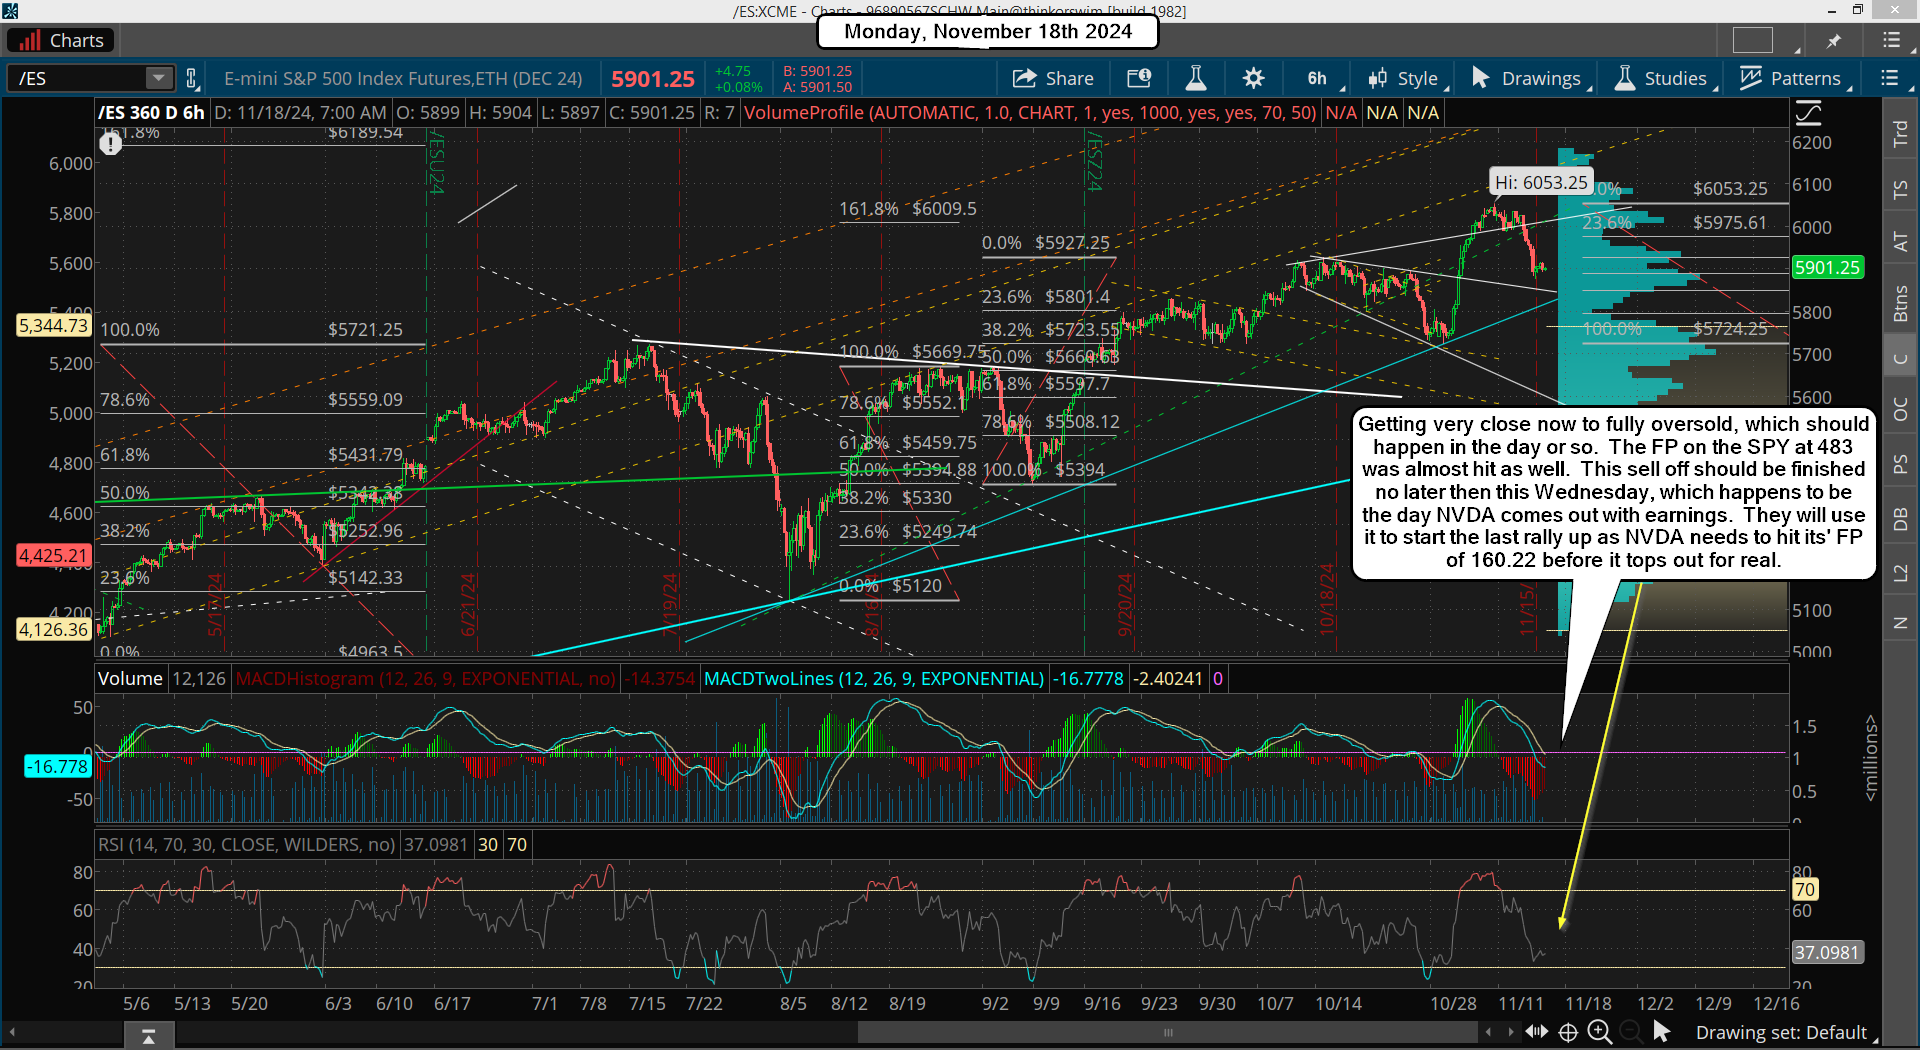
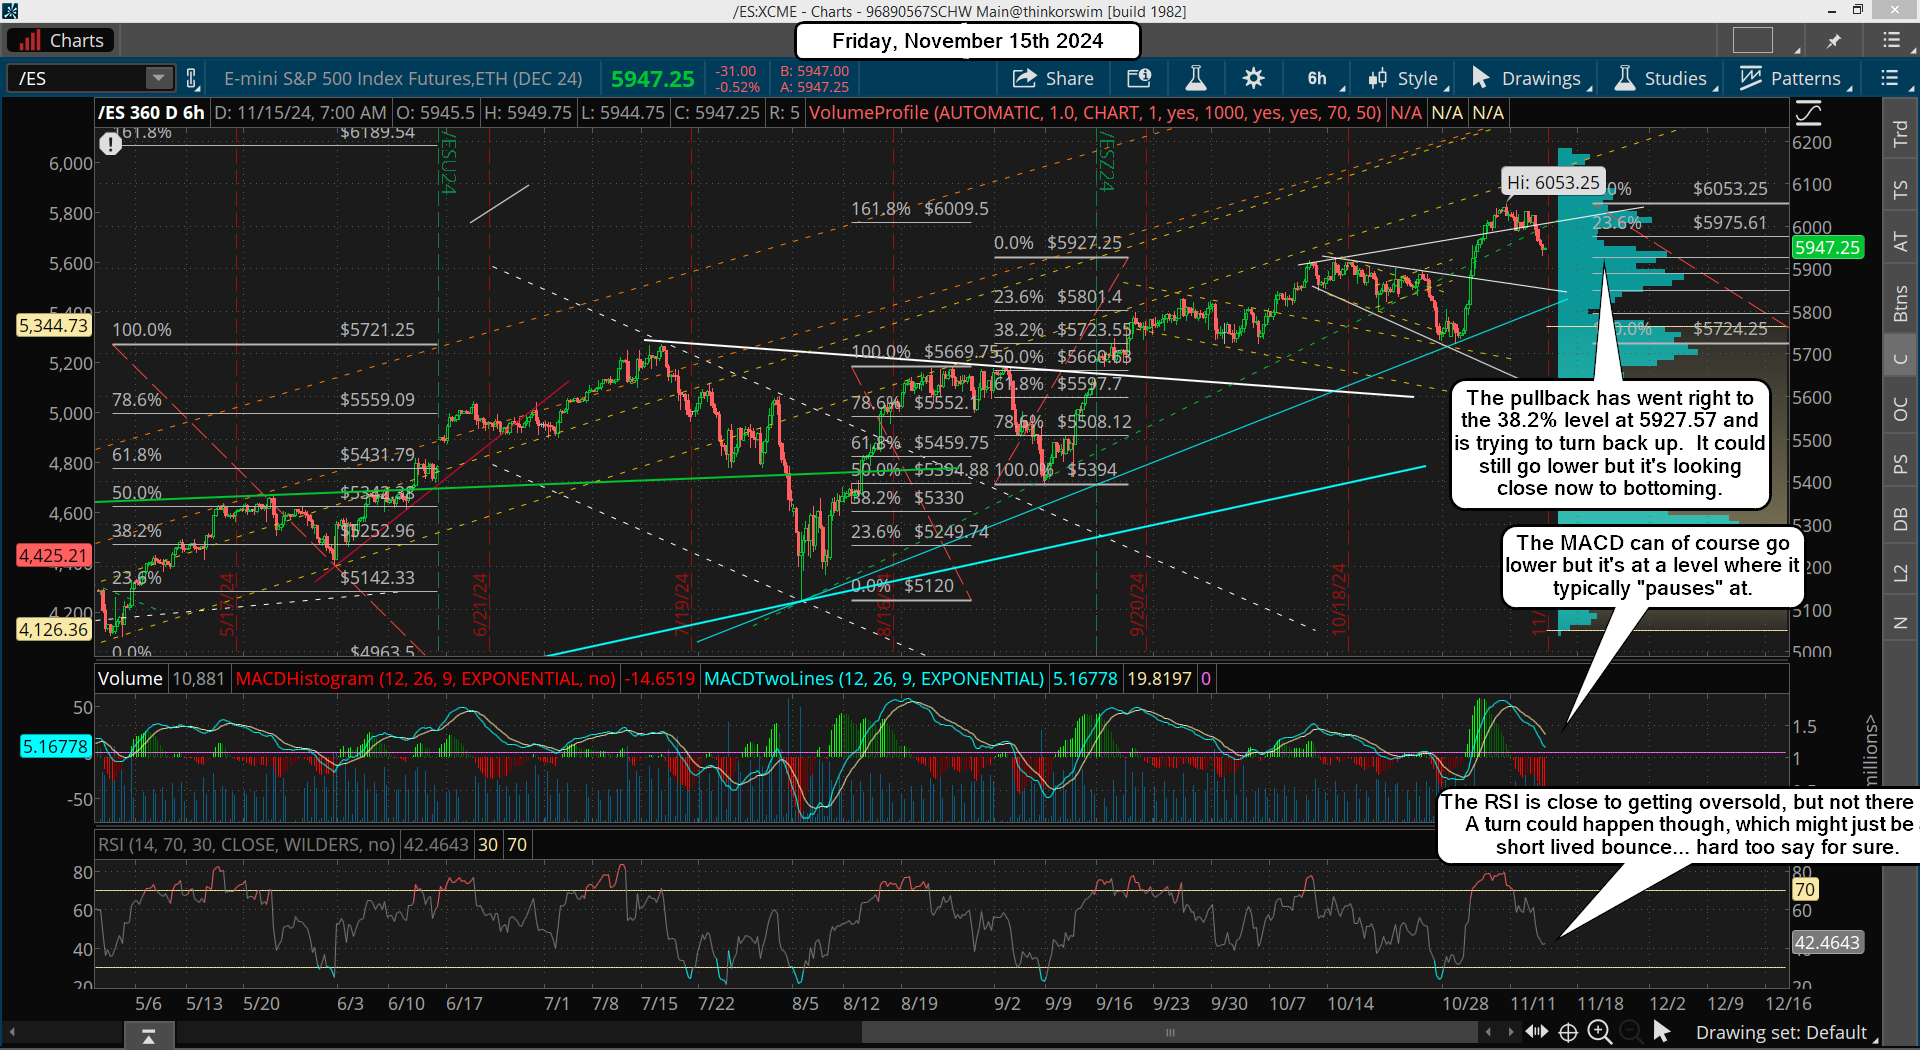
ES Morning Update September 3rd 2024

0

I hope everyone had a good holiday weekend... I know I did. I enjoyed just taking a nap on my swing on the porch was the hot weather has broke and it was pretty comfortable outside in the shade. Moving on... this week will be a short one since the market was closed yesterday.

We did not breakout and make a new all time high into the end of the month but we did close out near the higher range, and I've pointed out many time that the market will commonly produce "turns" around the end of any given month. Since we were up near a high it suggests we will turn down this week, but I still don't think we are ready for a big drop. Most likely we'll just see the right shoulder created that I've talked about many times last week as likely.

I still think a new all time high is coming before the bigger drop, so if we get a pullback this week it's likely just a buying opportunity before another rally into mid-late September. It's very possible that we reach my FET on SPX and/or ES before we finish this strong multi-month rally. In fact, it's looking like we could bottom for that bigger drop in late October right before the November election.  Here's a chart...

Have a blessed day.
ES Morning Update August 30th 2024

4

Yesterday almost broke though the falling white trendline but it held again, so change in the forecast. However, I do want to point out that between now and Sunday (in the futures), if we make a higher high on the DOW and SPX (I don't think the NDX can do it), then we will likely have topped as this is a turn window. But it requires a new high to trigger.

I don't think it will but it certainly could happen, and if it does I'd look for a pullback next week for the first leg down and a rally back up into the 18th for a lower high (the B wave?), and then the nasty C wave down afterwards. If this happens I'll adjust but right now it's looking like we'll breakout early next week and skip the "end of the month" turn window. Not much else to say, so have a great 3 day holiday weekend.

Have a blessed day.

ES Morning Update August 29th 2024

0

No breakout from NVDA yesterday so it's looking like the market is going to put in a low into this coming 3 day holiday weekend. That's perfect for a medium wave 4, inside a large wave 5 up. Next week I'd expect to see medium wave 5 up start, inside large wave 5, and hopefully that takes us into mid-September where we put in some final top before we drop hard into the election. Nothing more to add as we close out this week. Everything points to a breakout next week. We shall see.

Have a blessed day.

ES Morning Update August 28th 2024

0

Since there's nothing going on but chop I want to cover something else this morning, that I just find interesting. It's on the SPX chart and it's a rising white trendline from the 1929 high to the 2000 high, which is shown below...

Notice how close we got to hitting it at the 2022 high, which fell shy by about 300 points but looks really close when you zoom out on the monthly chart. Now guess what? We are again around 300 points or so shy from hitting it, so it's possible that they will hit this this time around. The first half of September is very bullish, so if there's ever a time for them to juice the market it will be during this period.

The bullish pattern is there, and still forming as we go into the end of this month, so all the bulls have to do is to keep holding the support zone until they get the right spark to breakout. That could be any day now, but it certainly should do it next week after Labor Day. Below is a close up chart of that same rising white trendline...

Notice that my Fibonnaci Extension Target (FET) is at 5982.39, and the rising white trendline will be in that zone into mid-September. Maybe it's all too obvious but it sure looks like we are going to top out into the September 18th FOMC meeting.

Have a blessed day.

ES Morning Update August 27th 2024

0

Not much to add as the market continues to build a sideways base under the falling white trendline. It could breakout as it's technically forming a bull flag or even a "cup and handle" pattern. Both are bullish of course but I still lean toward a pullback, which is based a lot on the fact that early to mid-September is very bullish from the Seasonality Chart, so I think we rally nicely next week, which suggests this week should pullback... or go sideways more to further build that bull flag.

Either is fine I think as both pattern will allow one more move up into the FOMC in September. Again, shorting here is not wise as while we might pullback we could also go sideways. Better to wait for the last rally up to short or (if we get a decent pullback?) go long on a good move down.

P.S.  NVIDIA earnings are out Wednesday so that should be a market mover.  Will it be the pullback I'd like to see, or a breakout to new highs?  We shall see.

Have a blessed day.
ES Morning Update August 26th 2024

0

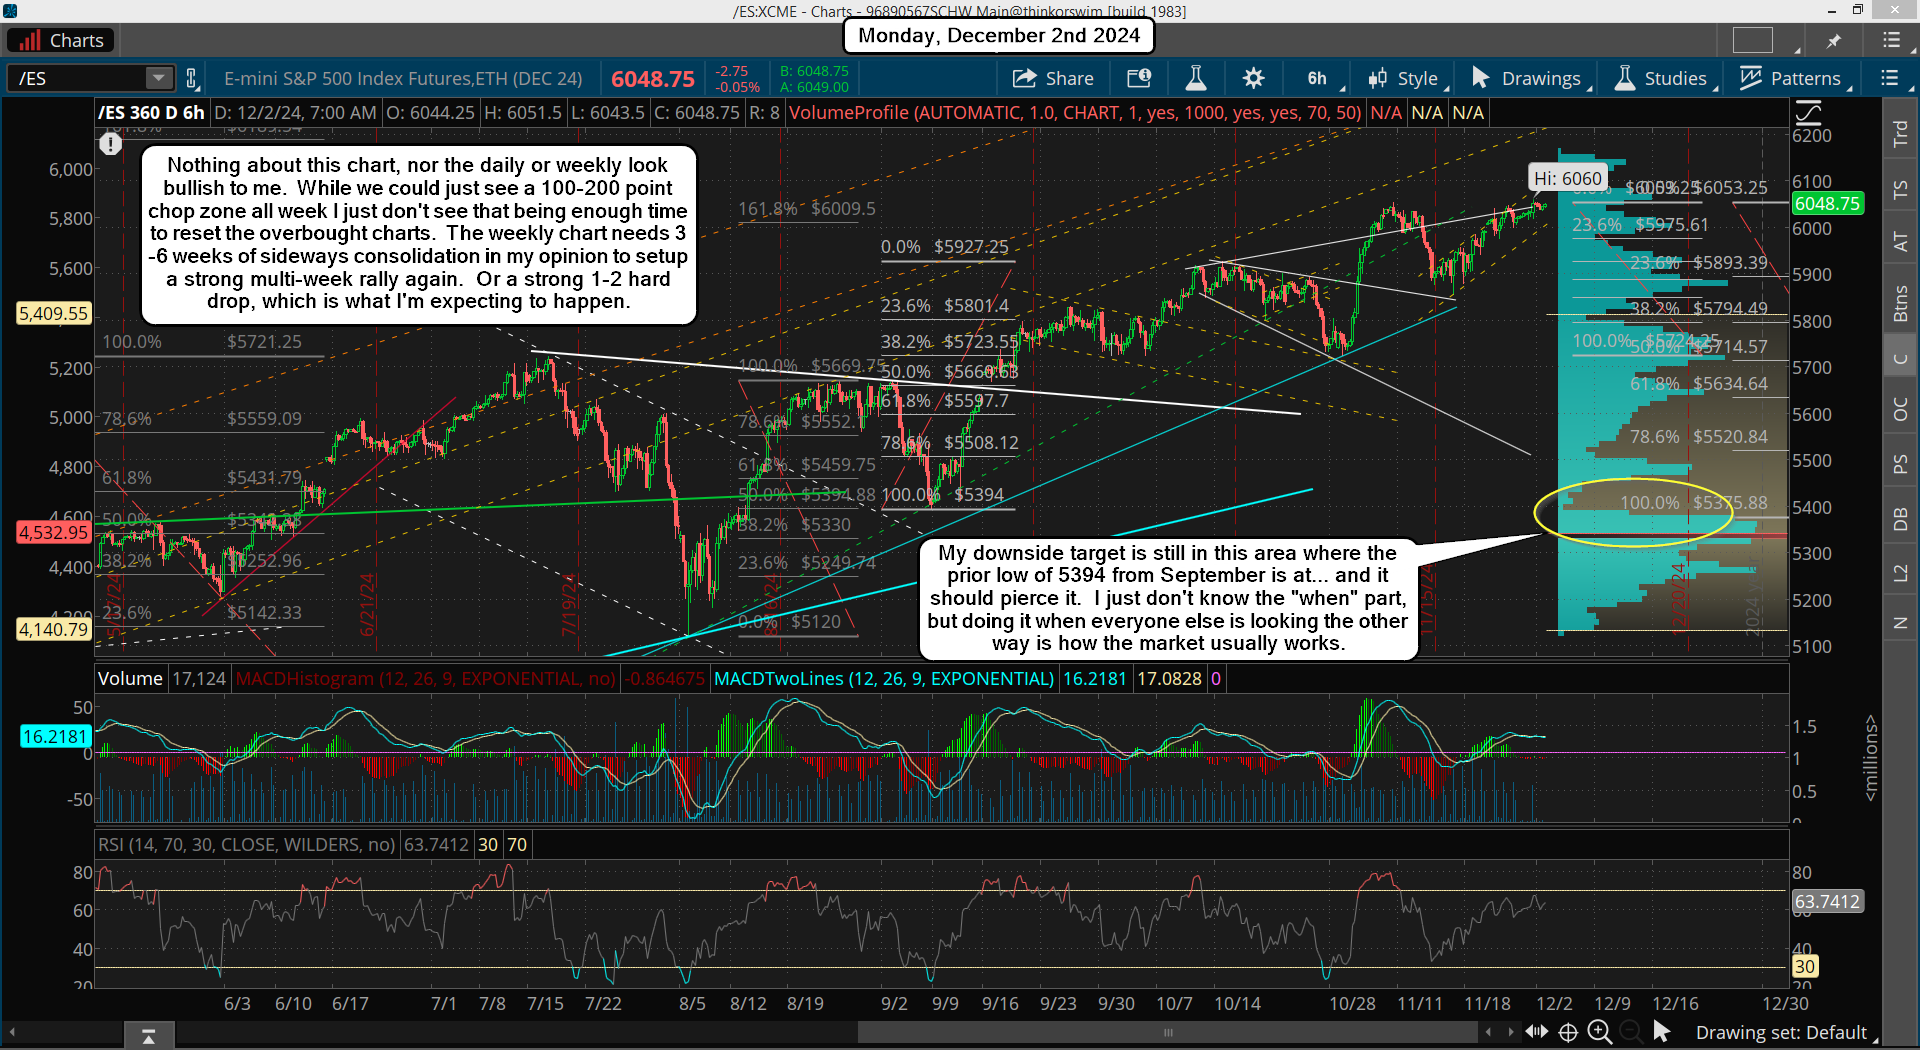
Last week I covered the wave count that we should be in "if" we don't make another higher high, but today I'm going to cover what the wave count should be if we are going to make a new high. Let's look at it below...

It was bugging me for a long time that the A wave down into the 8/5 low only had 3 waves inside it, and most A and C waves have 5 waves inside them, not 3... so this new wave count makes more sense because wave 2's and 4's usually have 3 waves inside them, and with this new labeling as that decline being a large wave 4 it fits perfect with the 3 medium waves inside it that make the ABC.

Next let's look at technicals and patterns to see if there's some more supporting prior history that could project the future.  Below is the daily chart from the last move up into the 2021-2022 top as that's what it looks the most like right now.

Now does that look like the current daily chart?  I think it does, and while they never make a perfect repeat in time or price the overall pattern and prior position of the MACD's and RSI look very close to where we are today.  That chart is below...

Interestingly the Seasonality Chart has a strong move up the first half of September, which would also line up with the last wave up to complete the large wave 5 and a new all time high.

Now let's not forget that we have another FOMC Meeting on September 17-September 18, and many others are predicting the Fed will do a cut, or say they are going to do one soon.  History tells us that when the Fed's cut rates after the market has been rallying up during rates of increase the market always tanks.

You might think that cutting rates would fuel another strong rally higher but that's not what history shows.  It shows the market rolling over shortly after rates are cut, and when you add those high odds of that happening at this next meeting, and prior patterns similar to late 2021, plus MACD's and RSI's that are similar, you have the makings of an important top and big drop afterwards.

Looking at the weekly chart above, it too is getting weaker on the MACD's and close to overbought again on the RSI... while making a triple negative divergence.  And let's not forget that many of the big firms, banks, brokers, fortune 500 companies, etc... end their tax year at the end of the 3rd quarter, which is September 30th.  That's another reason to expect them to sell out their longs to close out their profit for this tax year.  It's a common reason that many big drops happen into October of any given year.

Have a blessed day.
ES Morning Update August 23rd 2024

1

I didn't do a post yesterday as there wasn't anything to add, but we did finally get a pullback started, so assuming the current high holds (and I think it will) we should start a decline into next week. Ideally it unfolds in 5 waves so that it's my wave 1 inside a C wave down. The zone to look at is the 5500 area, down to as low as the 5400 zone. Somewhere in that area is where I would expect to see this first pullback end at. Then an ABC up into the first week of September for the wave 2 in the C down.

That "squeeze" could hit the falling white trendline, and if it does, it will look super bullish to everyone as the pullback will be the "right shoulder". I covered all of that on my update from Tuesday, August 21st 2024, and so far we are looking good for following that path. As for today I don't have much to add as we could drift a little lower in the first half of the day and then do the typical bounce into the close.

Meaning, I don't think we'll drop too much deeper today as most likely that will be saved for next week. For me there's nothing to do but wait for the August 30th-September 4th period to look for that last squeeze up, as that should be the ideal short.

Have a great weekend.

ES Morning Update August 21st 2024

0

A whole lot of nothing yesterday as bulls take a breather. A pullback of some degree is near and could start anytime now. But the most important period is around the Labor Day weekend where an important "turn" should happen. If the current high hold then the new falling white trendline will be resistance on the rally back up after the expected pullback. While it's really hard to know for certain where this rally will end it's possible that it's ending now and that we'll start down soon and bottom around the end of the month with a fast short squeeze up right after the Labor Day weekend for a lower high then this first rally up. Here's what I mean...

As you can see the pullback will make a nice right shoulder of an inverted head and shoulder pattern. It will look very bullish as the next move up would trick a lot of bulls into looking for new all time highs from that pattern. But if it fails it will turn into a nasty wave 3 of C down, and catch a lot of bulls off guard. The best inverted head and shoulders patterns work when the market is near a bottom, not the all time highs. The October 27th, 2023 low was a beautiful right shoulder with the head on October 13th, 2022 and the left shoulder on February 22, 2022. That was a large inverted head and shoulders pattern from a low, which the right shoulder pierced the 200 days SMA, so odds were high it would breakout, and it did.

There was another inverted head and shoulders pattern closer to the low, which had the same head of course and a left shoulder on June 21st, 2022, and two right shoulders, one on December 22nd 2022 and the other on March 13th, 2022. The weekly chart was oversold at both right shoulders, but that's not the case right now as you can see below...

My point here is that "if" we do pullback for a right shoulder into the end of this month the technicals don't support the inverted head and shoulders being successful and breaking out hard. It's near an all time high and the MACD's are overbought still, and the RSI is close to overbought too. I don't know whether this will play out or not but it certainly could and something to watch for sure.

Have a blessed day.

ES Morning Update August 20th 2024

0

The market continued higher again yesterday so I have to think the odds of any decent pullback are getting slimmer by the day and the odds of a choppy sideways move into the expected high between August 30th and September 4th have greatly increased. I don't really have much more to add as everything points to a double top or slightly higher high in the next 2 weeks, but what happens between now and then isn't going to be easy to figure out. I still think we'll get some kind of pullback, but it might be a one day event, hard too say for sure. It's a waiting game for the coming high now and I'm not too worried about the in-between.

Have a blessed day.
ES Morning Update August 19th 2024

0

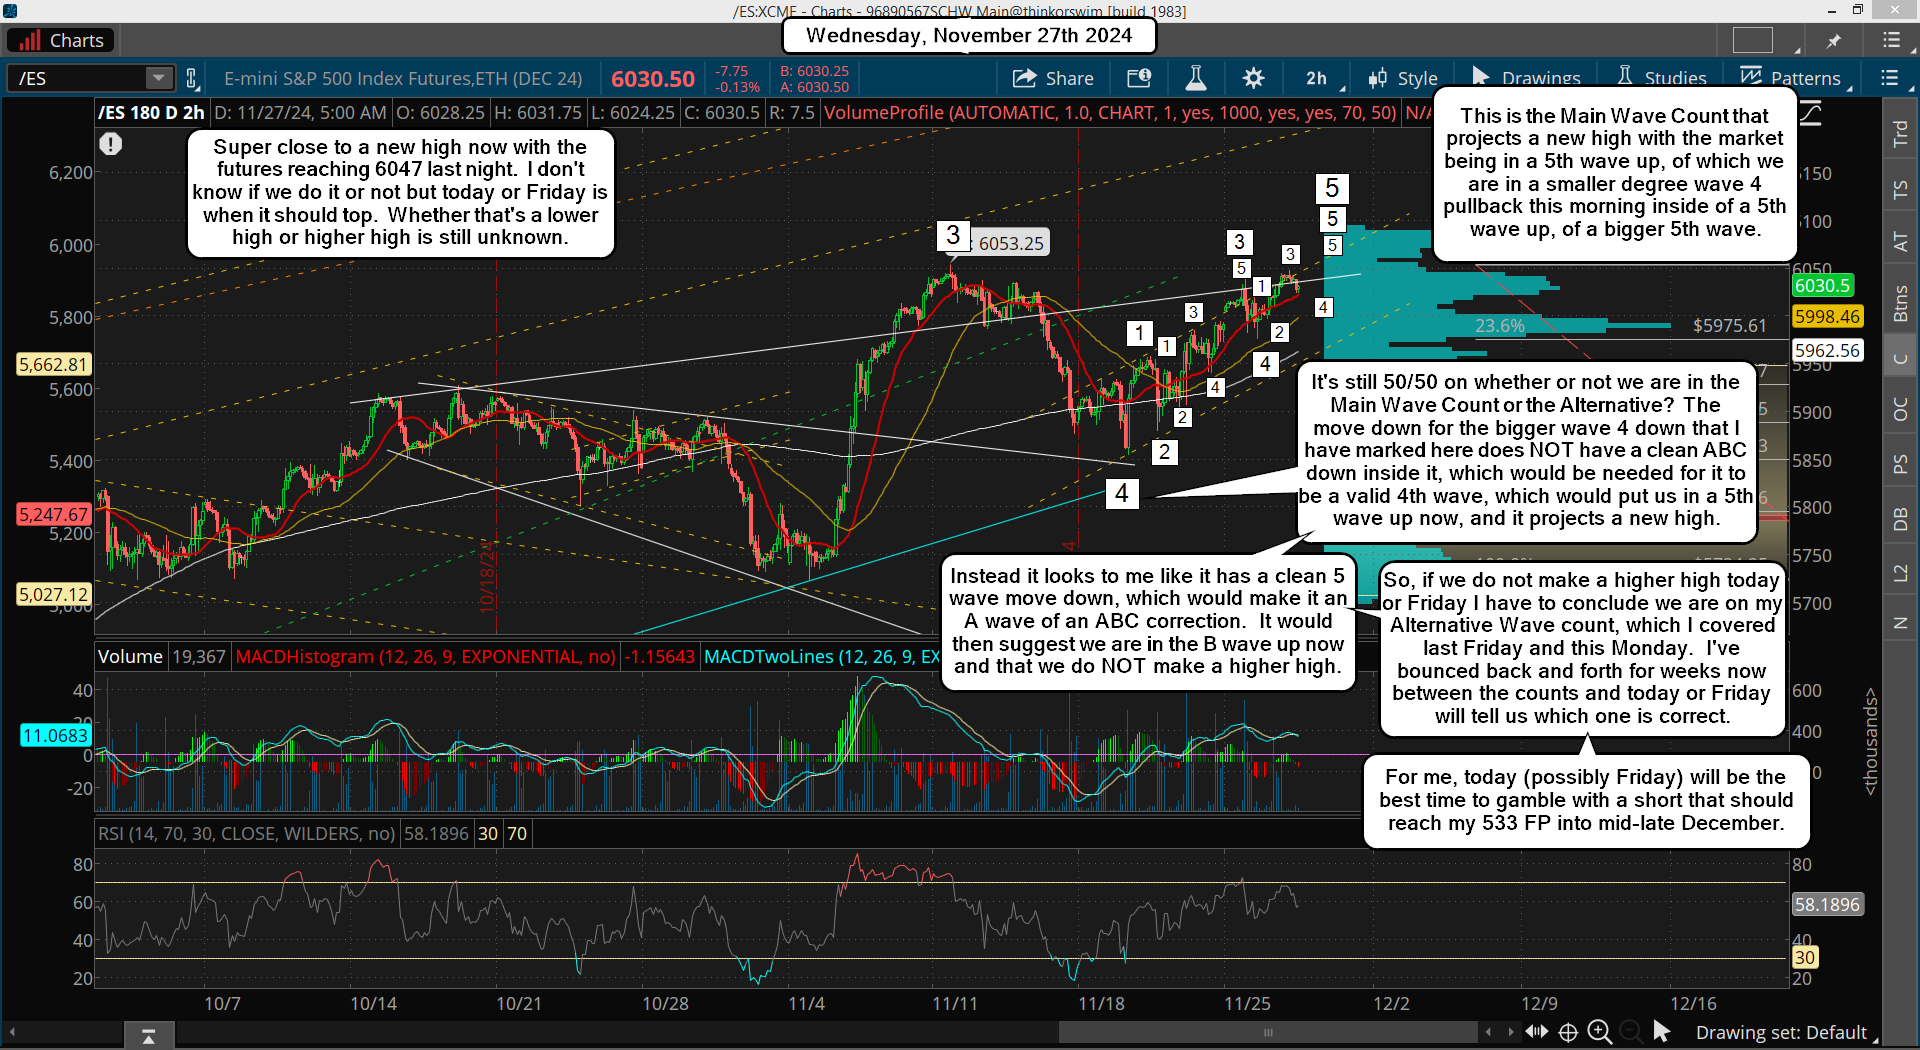
Friday went a little high but not much overall. I posted an updated wave count on Friday and so far it's still looking accurate. This week we should pullback early for a medium wave 4 of the large B up, which on the chart I projected it to around the 5400 area as that's about the 50% retrace mark from the low to the high with this rally, and a move back to that area would be deep enough I think to get more bears onboard to squeeze again into the end of the month, and I don't think there's current any bears left.

They were squeezed out last week as we went higher then most expected, even me. I was only looking for 61.8% but we hit 78.6%, so that was more the expected. It's also possible that we just chop sideways this week for the wave 4 pullback, which is fine too as bulls just need "time" to cool off the short term overbought charts.

The market never makes it easy so if they go sideways that will frustrate bulls and bears both, and it will form a handle for a "cup and handle" pattern, which opens the door for that last move up into Labor Day to make a higher high on the ES/SPX (most likely) but lower high on the NQ/NDX. One of these pattern will very likely play out... the sideways chop is the most frustrating, but don't rule out a fast pullback to make the right shoulder of an "Inverted Head and Shoulders" pattern and suck in some more bears.

I do not know which one will happen but since the wave 2 pullback was a fast and scary drop I have to lean toward the sideways pattern for the wave 4 as wave 2's and 4's commonly flip in how they unfold. But if it repeats the fast pullback I'd expect it to happen between Monday to Wednesday of this week as that's about all the bearish period that I see for now.

Have a blessed day.

ES Morning Update August 16th 2024

2

Yesterday surprised with another big squeeze. I was really thinking that it wouldn't go very much into the low 5500's but it just kept going. It's looks, acts and feels like it wants a new all time high but that's exactly when it fails. I've been here before too many times thinking exactly this but then out of nowhere a surprise pullback happens.

And I'm sure the pullback will be met with buying by bulls that missed the long, which then means the pullback must be deeper to shake them out. I don't see any bears left at this point as this squeeze was brutal. I remain bearish her short term... meaning into early next week. And bullish medium term... meaning into the end of this month. And lastly I am very bearish for the month of September and October. As for today, it's OPEX, so it I wouldn't expect much downside. Usually it's a flat to slightly bullish day.

Have a great weekend.

ES Morning Update August 15th 2024

0

We rallied yesterday a little more and almost hit the 61.8%, so we are close enough now for a top for this rally. It could still grind a little more into Friday since it's OPEX and we all know how the market loves to just chop during this week to make all the puts expire worthless. That could happen for sure, or we get a mild pullback today and back up on Friday for a lower high, which then sets up next week for a deeper move down.

When it comes it should be short lived as there's one more move up to make a double top or slightly higher high into the end of this month. Next week should be the period where the pullback happens and the last week of August should be the rally week for the double top. Then a large pullback should start that goes into October most likely. But we'll cross that road when we get there. For now I'm just looking for a pullback into next week.

Have a blessed day.
ES Morning Update August 14th 2024

0

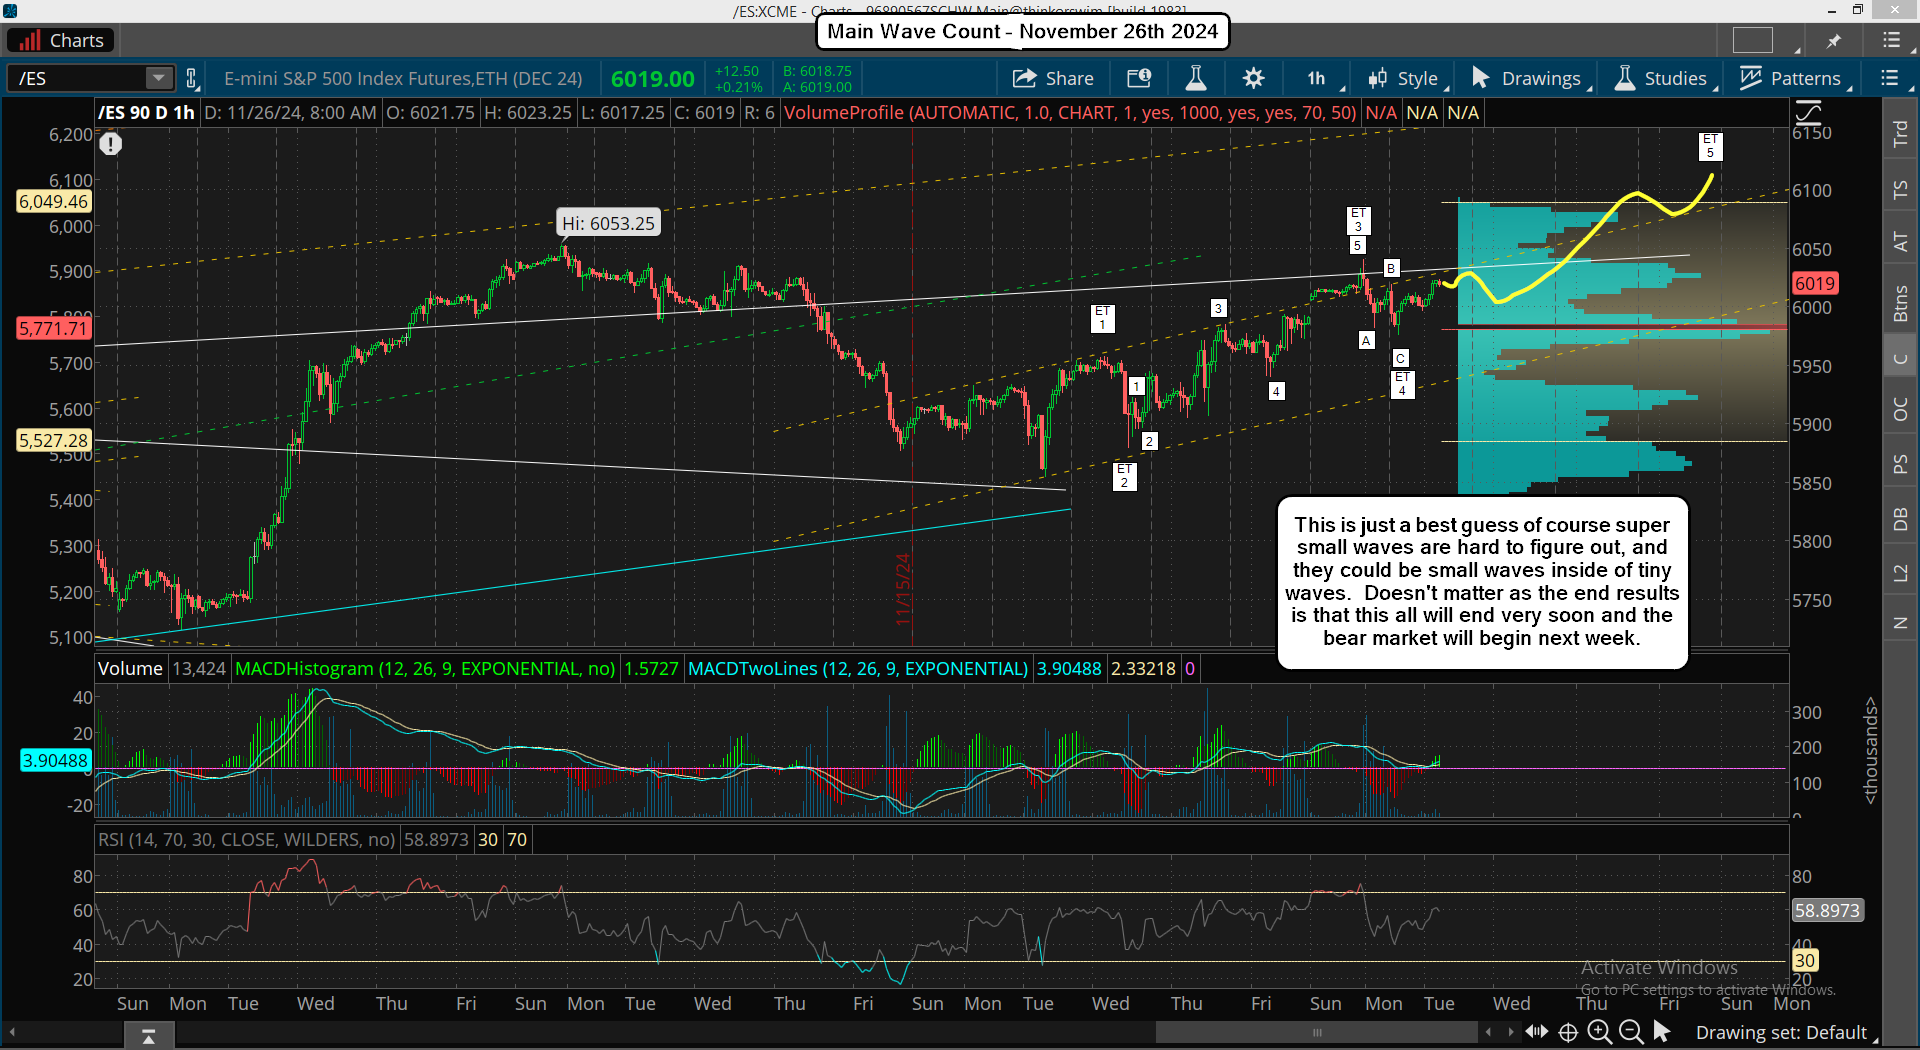
I was looking for a small pullback yesterday and then a strong rally, but the pullback never happened and instead the market squeezed hard all day long. Today we have the CPI, which should produce some traps on both the bulls and bears. The move up yesterday was a wave 3 of some degree so I have to think that if we get a pullback from the CPI it will only be a wave 4 and that a wave 5 up will follow to complete the rally up from the low, which will likely turn into an ABC with the wave 3 up yesterday being one that is inside the C wave.

Here's a chart from yesterday...

My target is roughly 5500, give or take a little above or below it, which should finish the ABC up and I'll then call it an A wave, which should be followed by a deep pullback for the B wave. Lastly will be the bigger C wave up to a double top into the Labor Day weekend. Now, I do not know when we are going to hit the 5500 target, but it should be this week, and possibly today.

If the CPI number scares the market too much then we might need until Thursday or Friday to make that last move up, but I tend to think they will shake off anything bad from it and it will therefore be short lived (the pullback I mean, which again should only be a wave 4 inside a C wave up, inside a larger A wave). I'll be patiently wait for the 5500 zone for a short this time as I missed the long yesterday. I knew it was coming but I was wanting that small pullback first and the market never gave it to me. It is what it is I guess.

Have a blessed day.

ES Morning Update August 13th 2024

0

Yesterday the market consolidated with a couple of brief dips. This is normal in front of the CPI and with it coming out tomorrow I tend to think we'll get a dip of some kind today. I posted a chart of my thoughts yesterday in the chatroom, which I still think is the most likely scenario. Here's that chart...

As you can see I changed it a little but the end result is the same, which is a rally into Labor Day, which should be a slightly higher high or lower high. I think we need to pullback to the 5330's for a small wave 2 before we start the next big move higher, and I'm sure they will use the CPI for the breakout squeeze to get it going.

It should be a small wave 3 up inside a medium wave 3 up, and there's not much resistance until the 5550-5600 area. So that's my target before is slows down and start another grind sideways to build another base for the last move up into the end of this month. That's all I see for now.

Have a blessed day.
ES Morning Update August 12th 2024

0

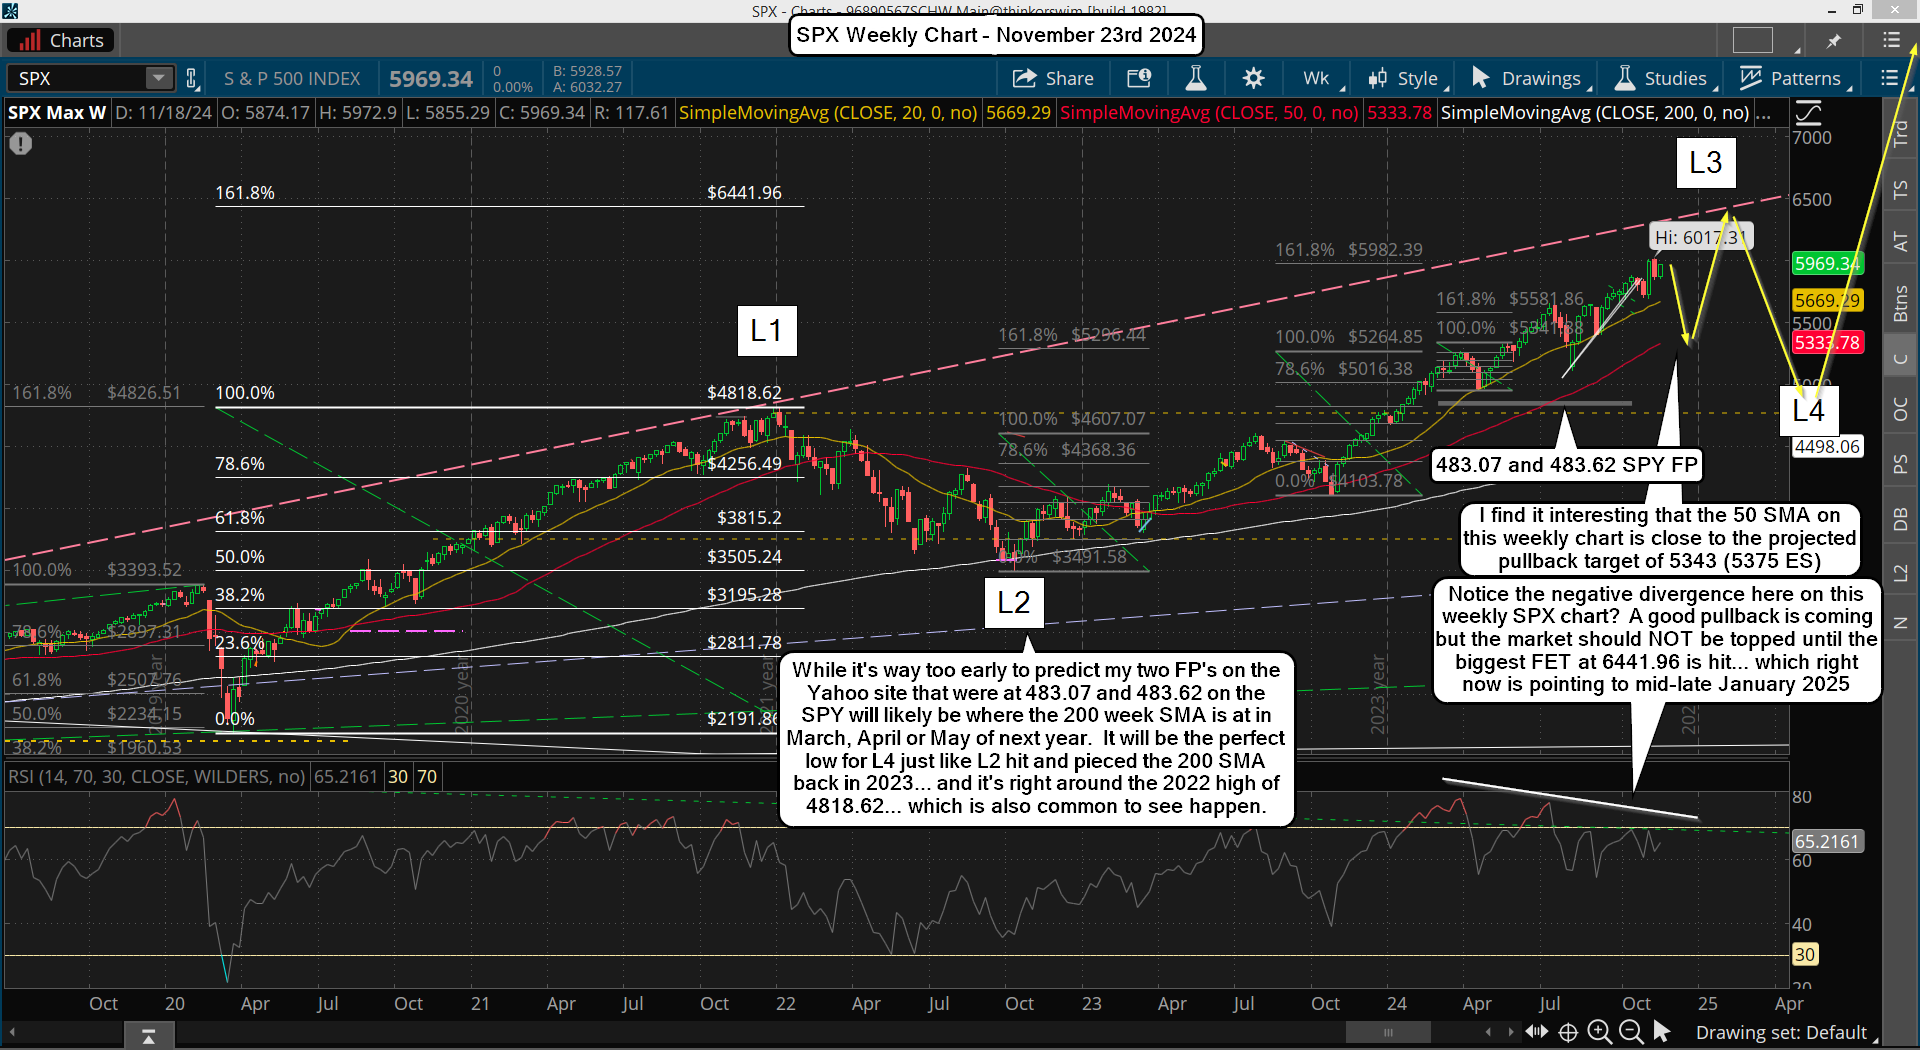
This week the market will be focused on the CPI out on Wednesday, which should do the typical wild swings to trap both sides before the next big move, which I think will be up. Meaning we should have one more move down this week for either a higher low or lower low, but don't know which one?

If we rally up toward the rising green trendline in front of the CPI then of course we'll pullback after it, but if we do that pullback in front of it then we should rally up after it. I've added a new rising white trendline on my chart, which will be support on any move down. I don't know how they will do it but I'll be looking for the pullback for a long entry, which should happen this week... either before or after the CPI. Once it's finished though I'll be looking for a strong rally into Labor Day around the end of this month, which could make a slightly higher high. Here's a chart...

Now if the coming pullback is a higher low then I'll just mark the larger A wave completion at the 5120 current low on 8/5, which will be a 3 wave decline then. If we go lower then it will be a 5 wave decline for the larger A wave and that will mark the low. My lean is for a higher low with the larger A down having already ended, but that's just a guess. And looking at the technicals I lean toward a top in front of the CPI with the decline afterwards, but it could be a low in front of it too. Again, that's just a guess based on the technicals, which look like we will grind higher first and roll over around the CPI this Wednesday. Here's the daily chart...

In conclusion I think we go a little higher into the CPI and then pullback for a higher low Wednesday or Thursday. It could drag into Friday but I doubt if they close the weekly candle down... meaning we should see a late day squeeze on Friday if it starts off weak. The rally that should follow will likely last into the Labor Day period where a higher high could happen on the ES/SPX but I don't think we get one on the NQ/NDX.

Have a blessed day.
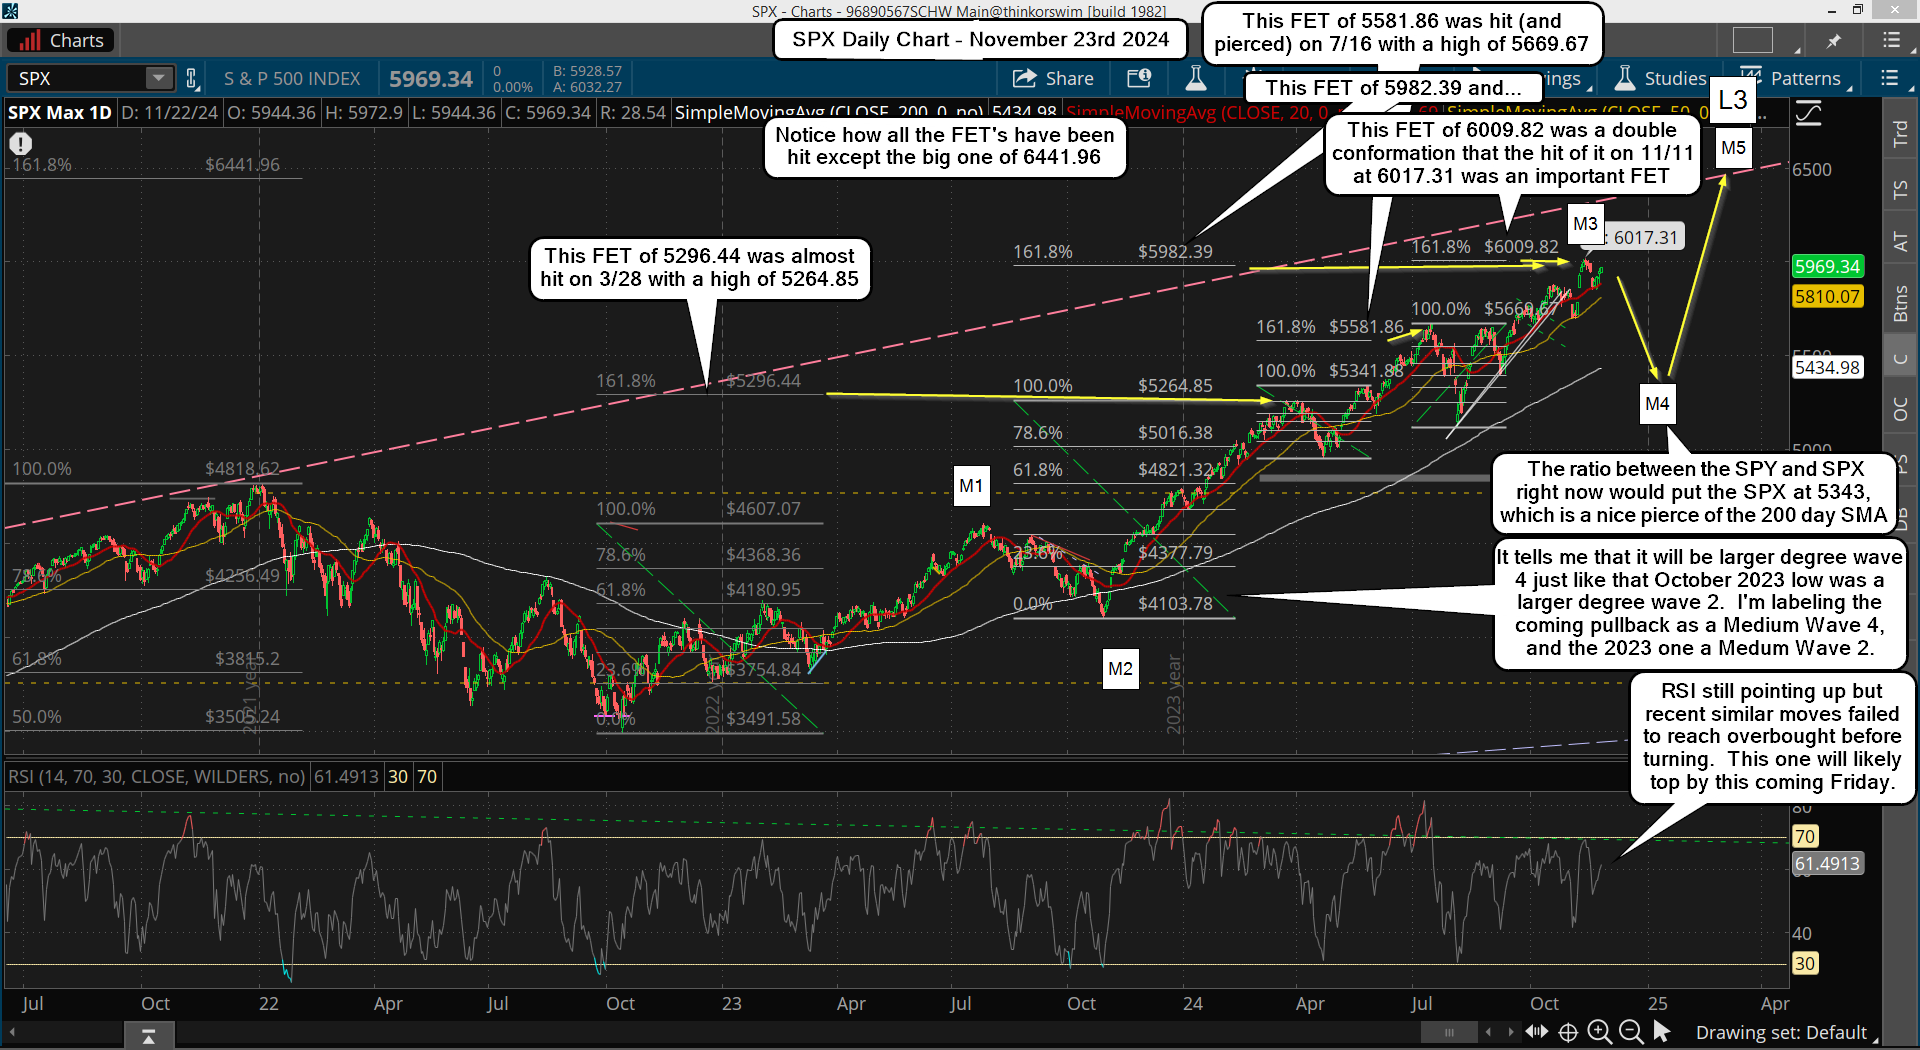
ES Morning Update August 9th 2024

0

So far the market is looking good for a "turn" late next week as the larger B wave appears to still be unfolding. The "turn" could be the high for the B wave or the low, I don't know which? I posted a chart yesterday on twitter and in my chatroom, with my thought on it, and here's that chart again...

I think we are in the RED path and while it shows a wave 2 down happening today that's just a guess and it might not play out exactly that way. The point I was making is that the market should subdivide in 5 waves for the C wave inside the larger 4 wave up. Currently we are in the wave 1 up and the wave 2 down might not start until we are higher, or it could start now but be very small in depth.

Now since today is Friday we could see some amount of a pullback happen early today and the typical late day rally to start the wave 3 up. And that wave 3 might subdivide into 5 even smaller waves too... who knows for sure? The point here is that the larger 4 wave up is still in play and should last into next week some time.

Again, I don't know if it's a high or low but I lean toward a low because I think there's too much "time" left, and that it won't that that much to complete a wave 2, 3, 4, and 5 inside C of wave 4 up. We have the CPI out next week on August 14th, and from now until then is about all the "time" needed to complete all those remaining waves. Possibly the CPI will cause the last squeeze higher and/or the last drop for the wave 5 down? Just a guess of course as I'll be focused on the technicals mostly, and the wave counts, but everything is lining up for late next week for all the action to happen.

Have a blessed day.
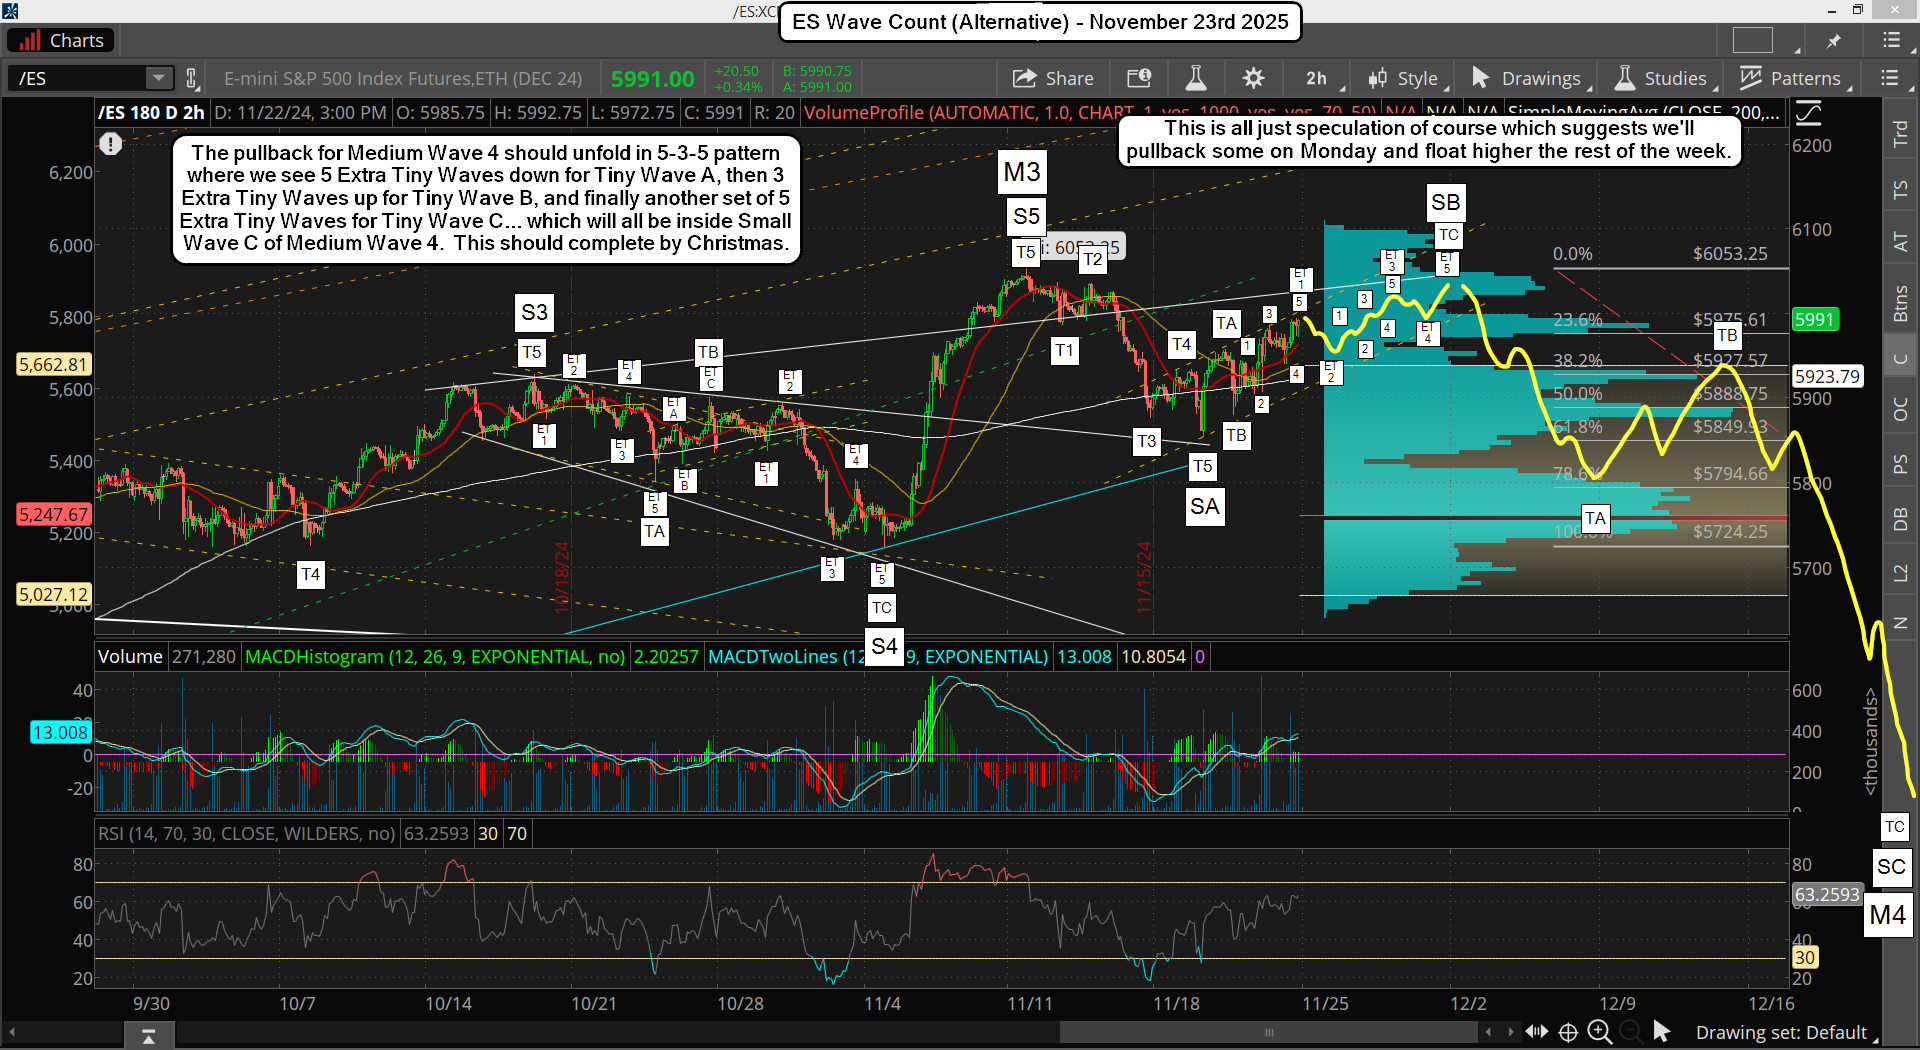
ES Morning Update August 8th 2024

2

We have 2 possible scenario's in play now. The first one projects a bottom sooner, like possibly this Friday It is where the rally up has finished and we are in the last move down now. I believe it is a wave 4 inside a larger A wave down and if the low is taken out we could see a flush down to the FP on the SPY of 483, but again... I don't have any history to track how accurate FP's from Yahoo are, so I'll just be keeping it in the back of my mind and watching the price action and the technicals.

Time of day is important too as we all know the common pattern the market does late on Fridays. Meaning that if we are at a new lower low late in the day but not to the FP that could be all we'll get? Now since this correction is unfolding in a 5 wave decline it's a strong clue that we won't make another new higher high on the next big rally as a 5 wave decline will only be a bigger A wave and NOT a completed ABC to end the correction. It will suggest we'll rally up late August and into September for a bigger B wave to setup a C wave down for October. Here's that chart...

The other scenario is that the wave 4 up isn't finished yet and that it's going to subdivide into an ABC where the rally the last few days was the A part and the B part started yesterday. Once it finishes the C wave up will go into late next week like around the 16th or 19th. From there we'll get the final 5th wave down to possibly hit the 483 fake print and complete the bigger A wave. After that we would still rally the rest of August and a lot of September for the bigger B wave, which still sets up October for the big drop. Here's that chart...

One of these scenario's is likely to play out in my opinion. And the first move up from the bottom of the bigger A wave will be a powerful one, but that will only be part of that bigger B wave as it will subdivide into many, many smaller waves to frustrate bulls and bears alike. Time will be the key to watch and focus on as I think it will last at least a month, probably longer.

We'll likely squeak out a slightly higher high on some of the indexes but not all, which will fool everyone into thinking it's over and we are off to 6000+, but I don't see that happening if we make a 5th wave down this week or next. Now if we don't then the correction might have finished as there will only be an ABC move and therefore the low we saw on Monday ended it all. We'll just have to wait and see.

Have a blessed day.

ES Morning Update August 7th 2024

0

So far, so good. The market is acting as I expected. This relief rally will last 1-2 weeks from my estimate, and that's based on looking at the past. There will be another move down at some point but the "when" part is something I don't know. It could be as early as this Friday or as late as next Friday, and why I think it will make a lower low it could just make a higher one... but a retest will happen as the technicals say it will.

You can look at the 10/3/22 low, bounce and then lower low on 10/13/22 as one example, or the 10/4/23 to 10/27/23 move. The current technicals look like both of those periods, which produced a lower low. But it also looks similar to the 4/19/24 to 5/2/24 move, which produced a higher low.

Either way odds are very strong that another move down is coming in 1-2 weeks, and may lean of course is that old FP on the SPY will be the target, but that's not guaranteed of course. I still don't have any history of FP's on Yahoo to go by, so it's hard to know for sure if they were real with no long track record, which I have with Think or Swim. I'm just patiently waiting to catch the long and will go with the technicals and patterns. If the FP is hit that will just be a bonus but I won't count on it. Time wise it I'm looking at next Friday.

Have a blessed day.
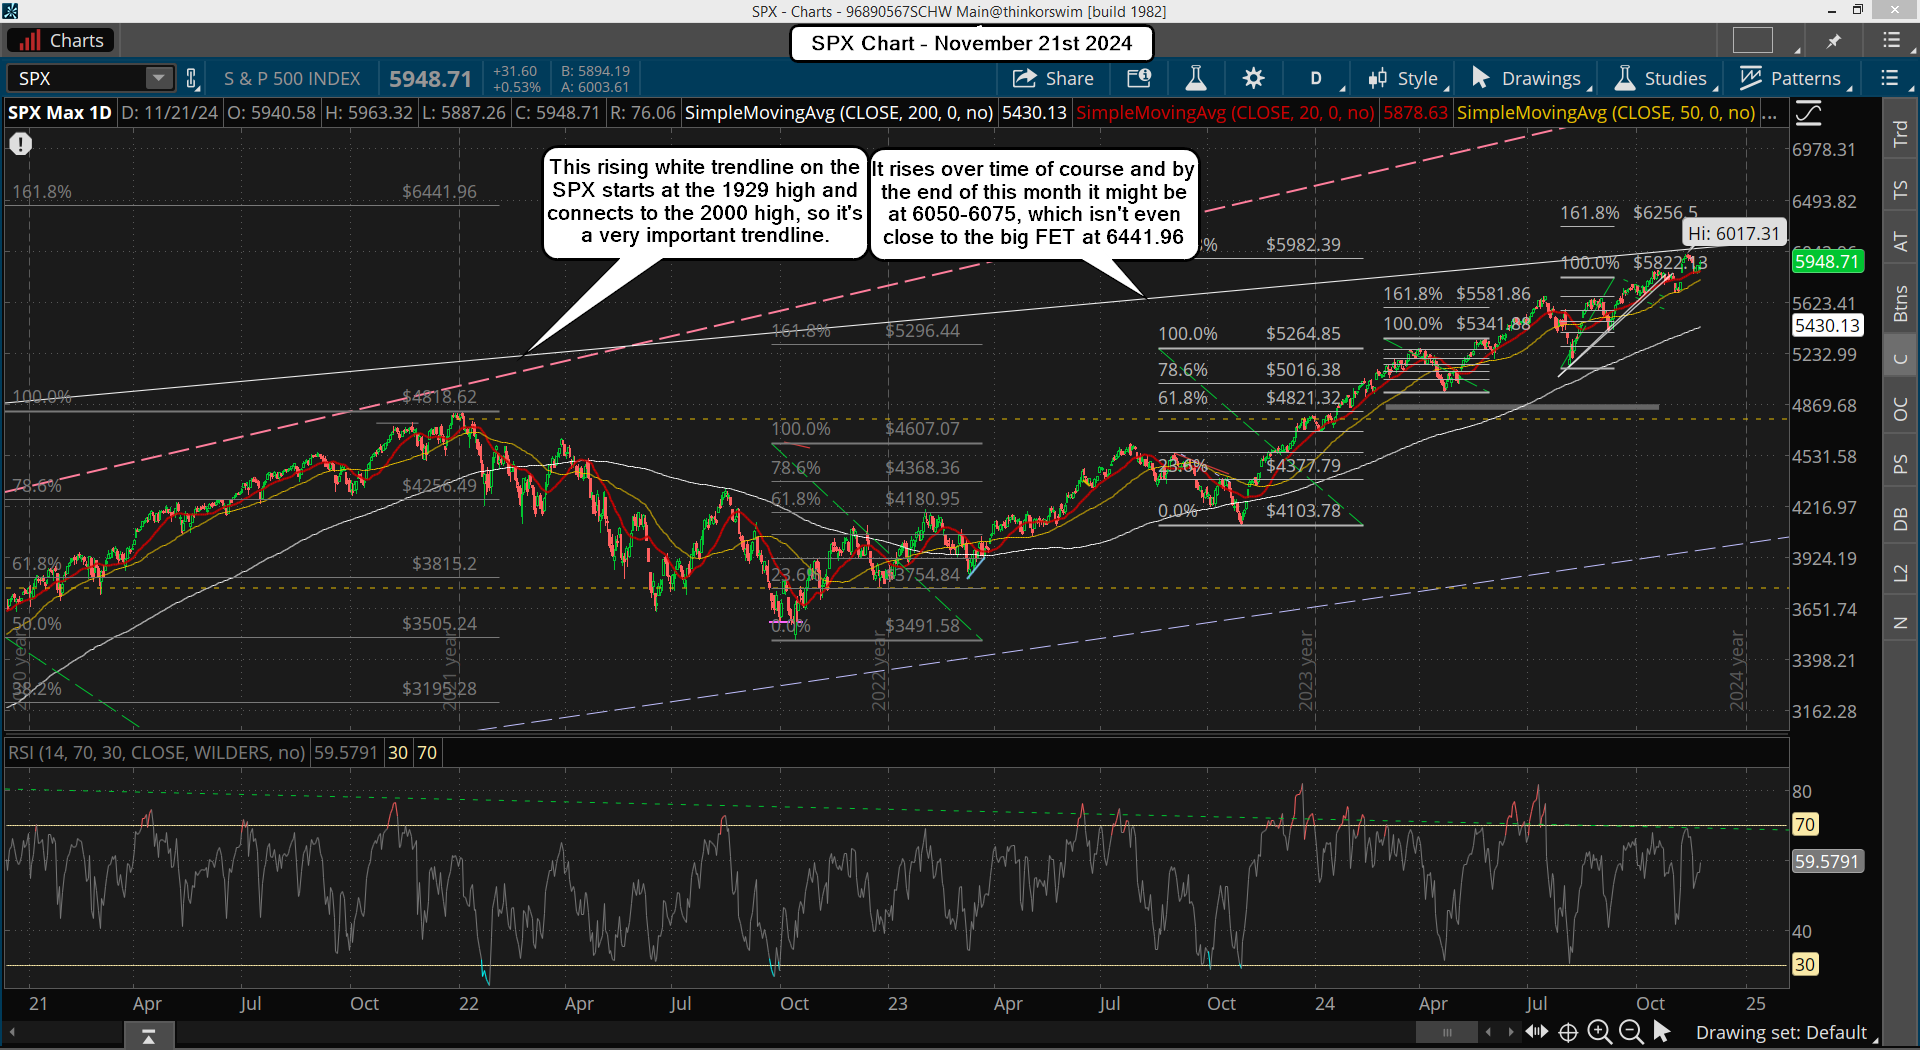
ES Morning Update August 6th 2024

0

WOW, WOW, WOW... that's all I can say about yesterday. But now that the market has calm down a little with the VIX closing at 38.57 from spike high of 65.73 the technicals should get back in align and give us some clues on the future. Everything I spoke of yesterday is still valid as the weekly chart and monthly are still around the same. The daily is just closer now to fully oversold then it was on Friday, so the technicals still point to a strong rally coming.

However, I don't think the current one is going to last very long. We should rollover one more time to make a lower low in price on the ES (hopefully we hit the FP on the SPY) and a lower high on the VIX. This might happen by this Thursday or Friday, but it could also drag out into the end of next week. This drop caught a lot of people by surprise so the first relief bounce will be sold by trapped bulls. The next drop should take out any remaining bulls and lure in tons of bears looking for a crash.

I don't think there were many bears on this drop as it caught everyone by surprise, so this "lack of bears" will limit the first move up as they don't have enough of them short to produce a long lasting squeeze. SkyNet needs to have a maximum number of bears short to get a week plus super squeeze This first rally should last a few days I think and then run out of steam. How high will it go? I don't know but big resistance overhead is the rising green trendline. Maybe we get there, maybe we don't, but I have no interest in any trades on the long side until I see a lower low in price and a lower high on the VIX for a positive divergence in the market. Only then do I see a multi-week rally, as right now I think it's going to be nothing but wild swings up and down to shake out both sides.

As far "turn date" the 16th-19th is a turn window, and that's the end of the week of OPEX, so it could be a high or a low... I don't know? If we bottom by the end of this week then I'd look for next Friday to top out the big squeeze, which is my "lean" as it's common to see a low on the Thursday or Friday the week prior to OPEX and then rally that week to make all the puts expire worthless. I could be wrong of course as it could flip and be a high this Friday and a low next Friday but I'd just allow it to play out which every way it wants too as I'm looking for a great long setup, and it's not here yet in my opinion.

Lastly, here's something interesting... it will be 666 days from the October 13th, 2022 low into this Friday, August the 9th. Possible low I'm thinking, but we'll see.

Have a blessed day.
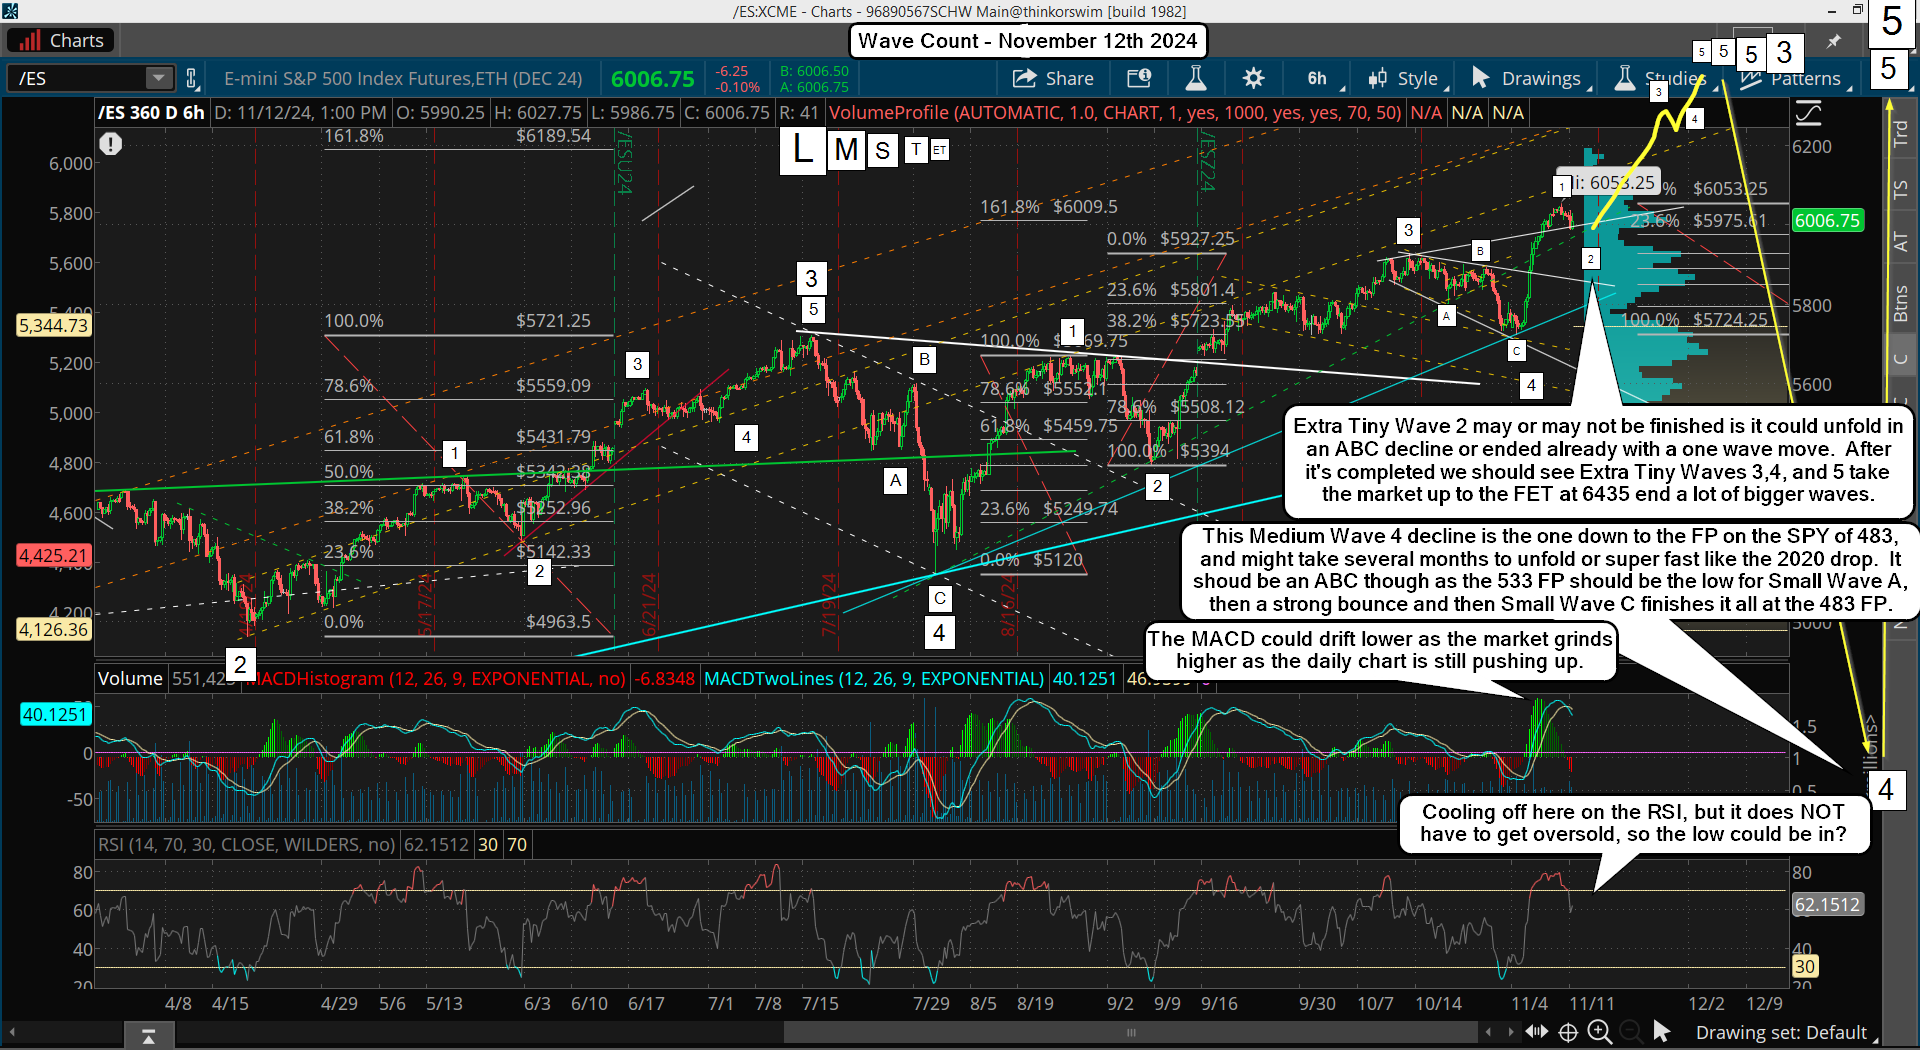
ES Morning Update August 5th 2024

3

Friday's nasty drop looks and feels like a capitulation move to me. The VIX almost hit 30 but closed at 23.39, which left a nice topping tail candle on it. I doubt if there's much more to go on the downside for the market (if any) as many indicators tell me a low is near. If Monday goes a little lower it's just the last buying opportunity in my opinion. Here's that VIX chart...

As you can see on the VIX chart every time in the past that we saw a topping tail spike happen it was followed by a strong rally that lasted for many days. Do I think that means a new high is coming? Probably not as there's still a lot of bearish pressure on the market from the weekly chart, but a sharp multi-day squeeze seems likely this week.

Possibly we see a "one day wonder" followed by a full reversal the next day, and then a "multi-day" wonder? When I looks for similar patterns from the past the 9/21/21 low and the 10/1/21 low looks a lot like the setup in the market now. If I had to pick which date I'd say we look the closes to the 10/1/21 low as the MACD's on the daily chart are at a similar point and so is the RSI. Even the RSI on the weekly chart looks like that 10/1/21 period.

The rally from back then produced a new all time high and topped out about 2 months later on 1/3/22. Could that pattern repeat? It's possible for sure, but there's no way to be a 100% certain of course. For now though I'm just looking for a strong rally up for several days, which should be sold as trapped bulls exit. Then "if" we repeat the prior pattern there will be one last pullback, like the 10/7/22 to 10/13/22 period, which will make a higher low and setup an "inverted head and shoulders" pattern. It's from that point forward that the market could start a big squeeze to new all time highs.

Have a blessed day.
s2Member®