Saturday, April 19, 2025
Home Blog Page 9

ES Morning Update August 12th 2024

0

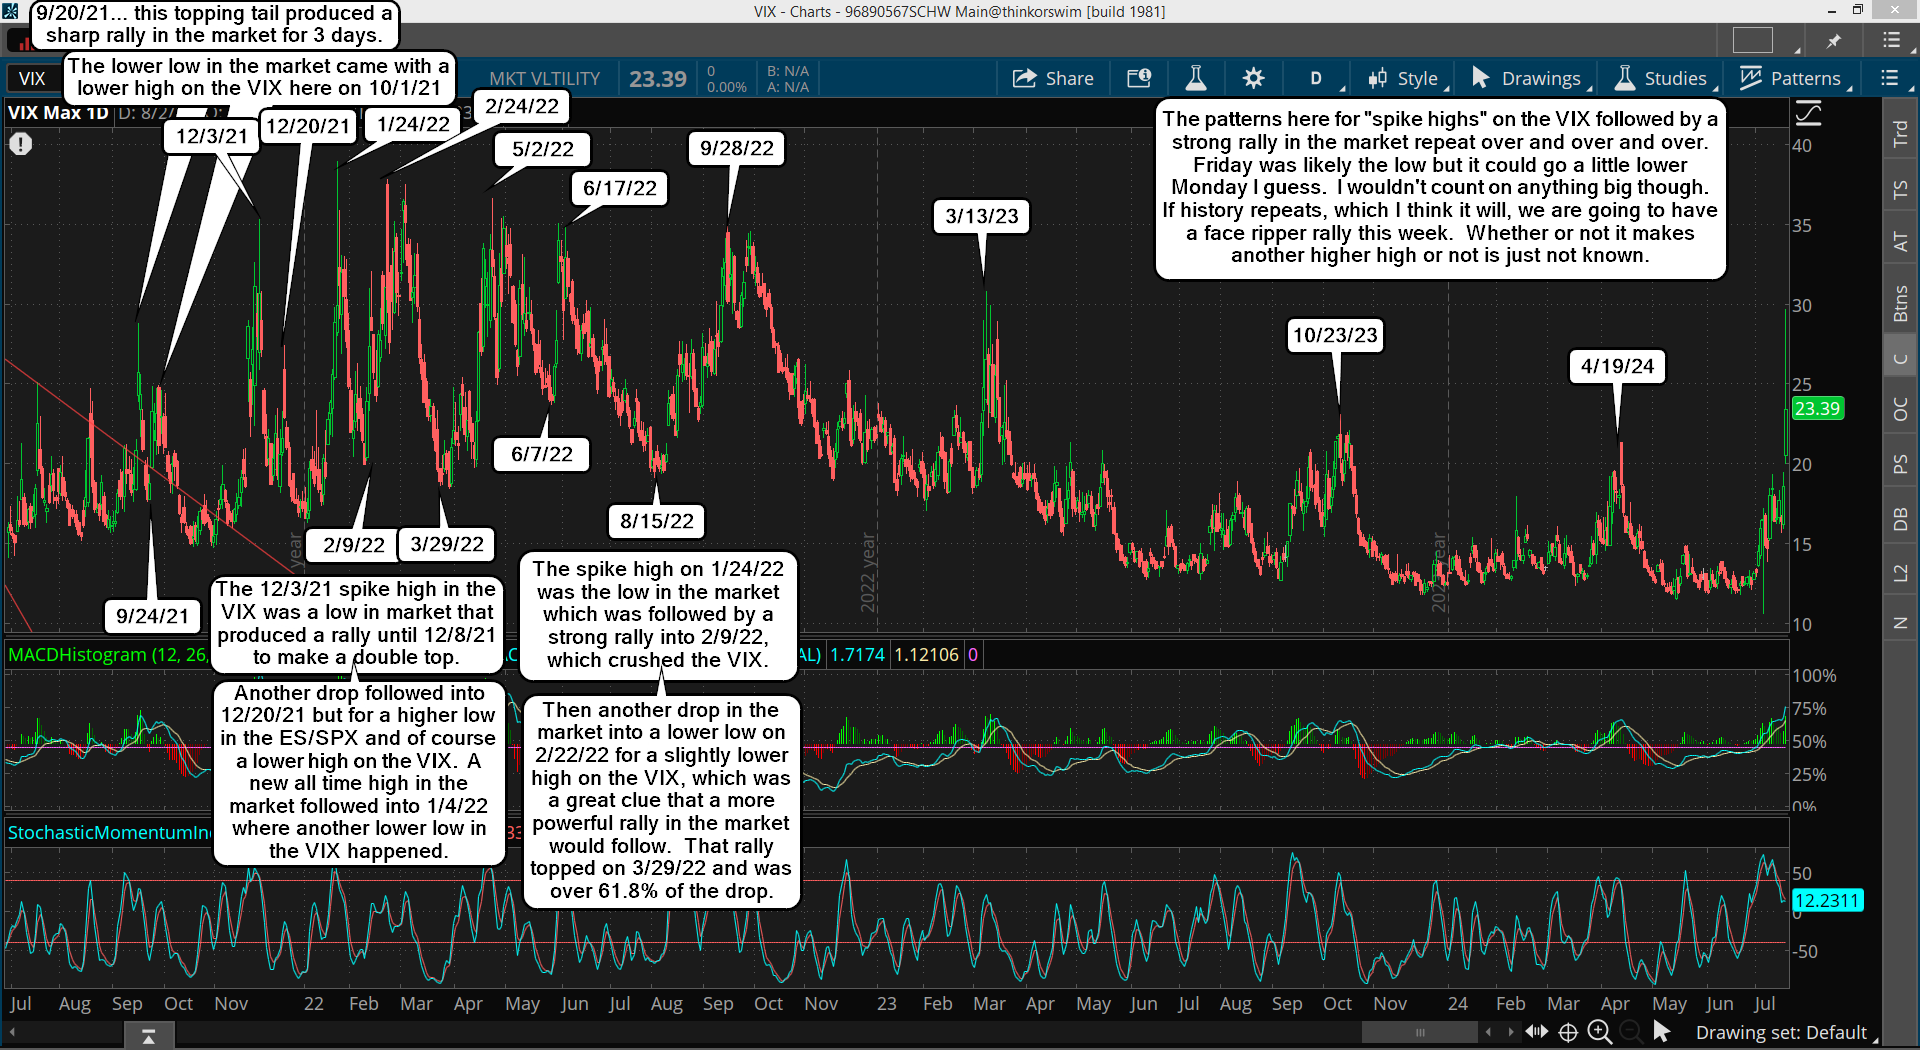
This week the market will be focused on the CPI out on Wednesday, which should do the typical wild swings to trap both sides before the next big move, which I think will be up. Meaning we should have one more move down this week for either a higher low or lower low, but don't know which one?

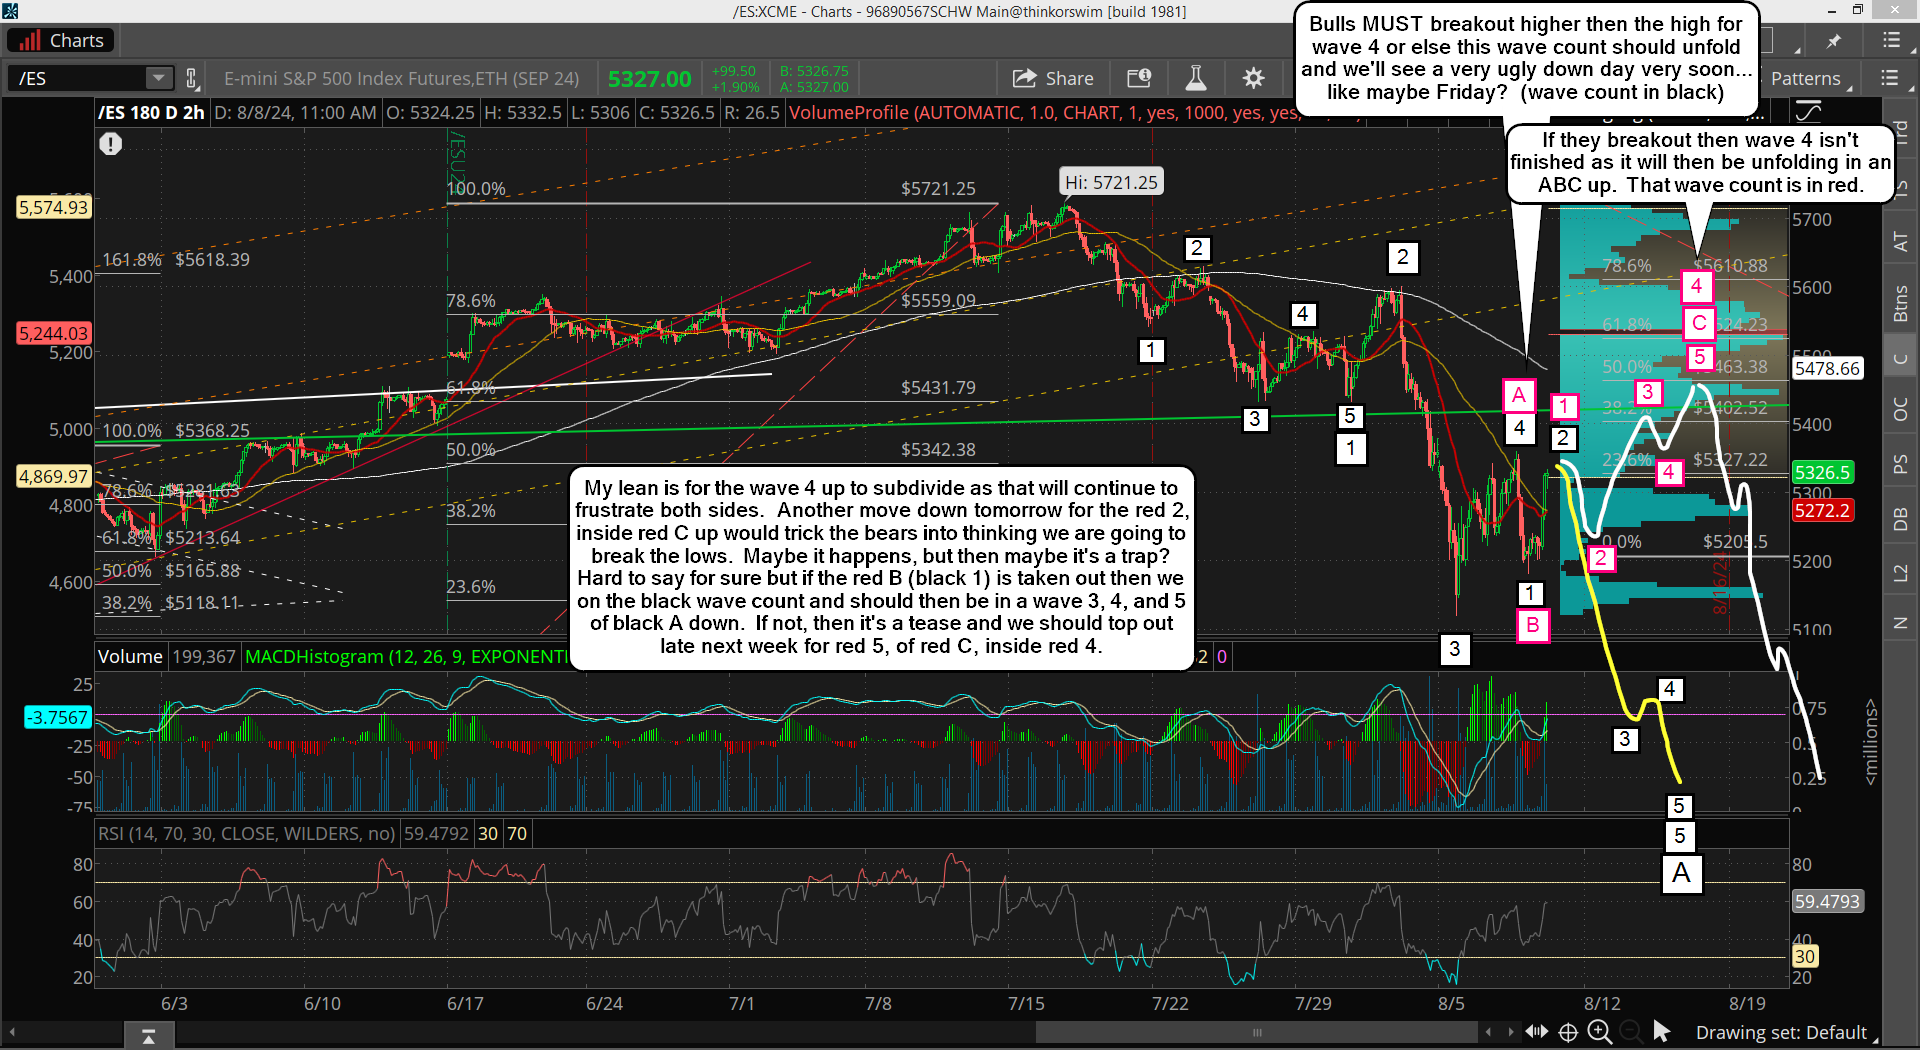
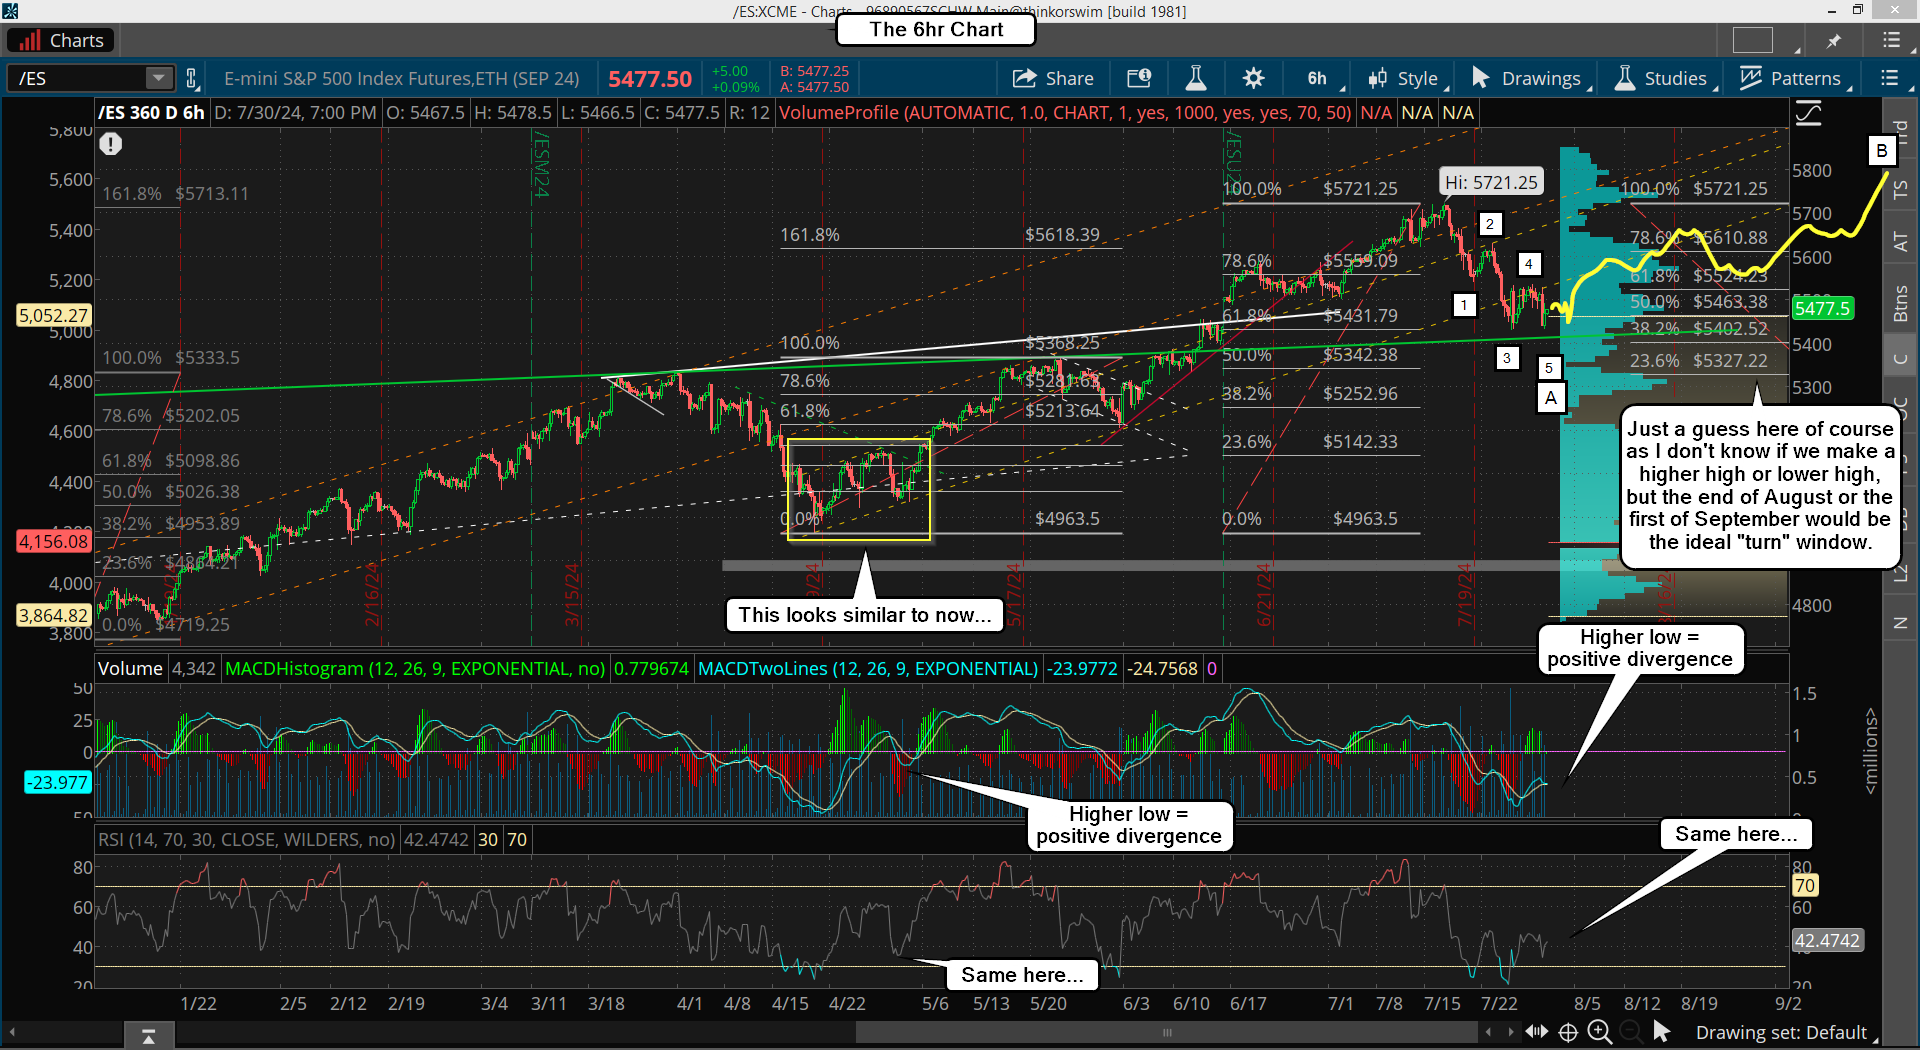
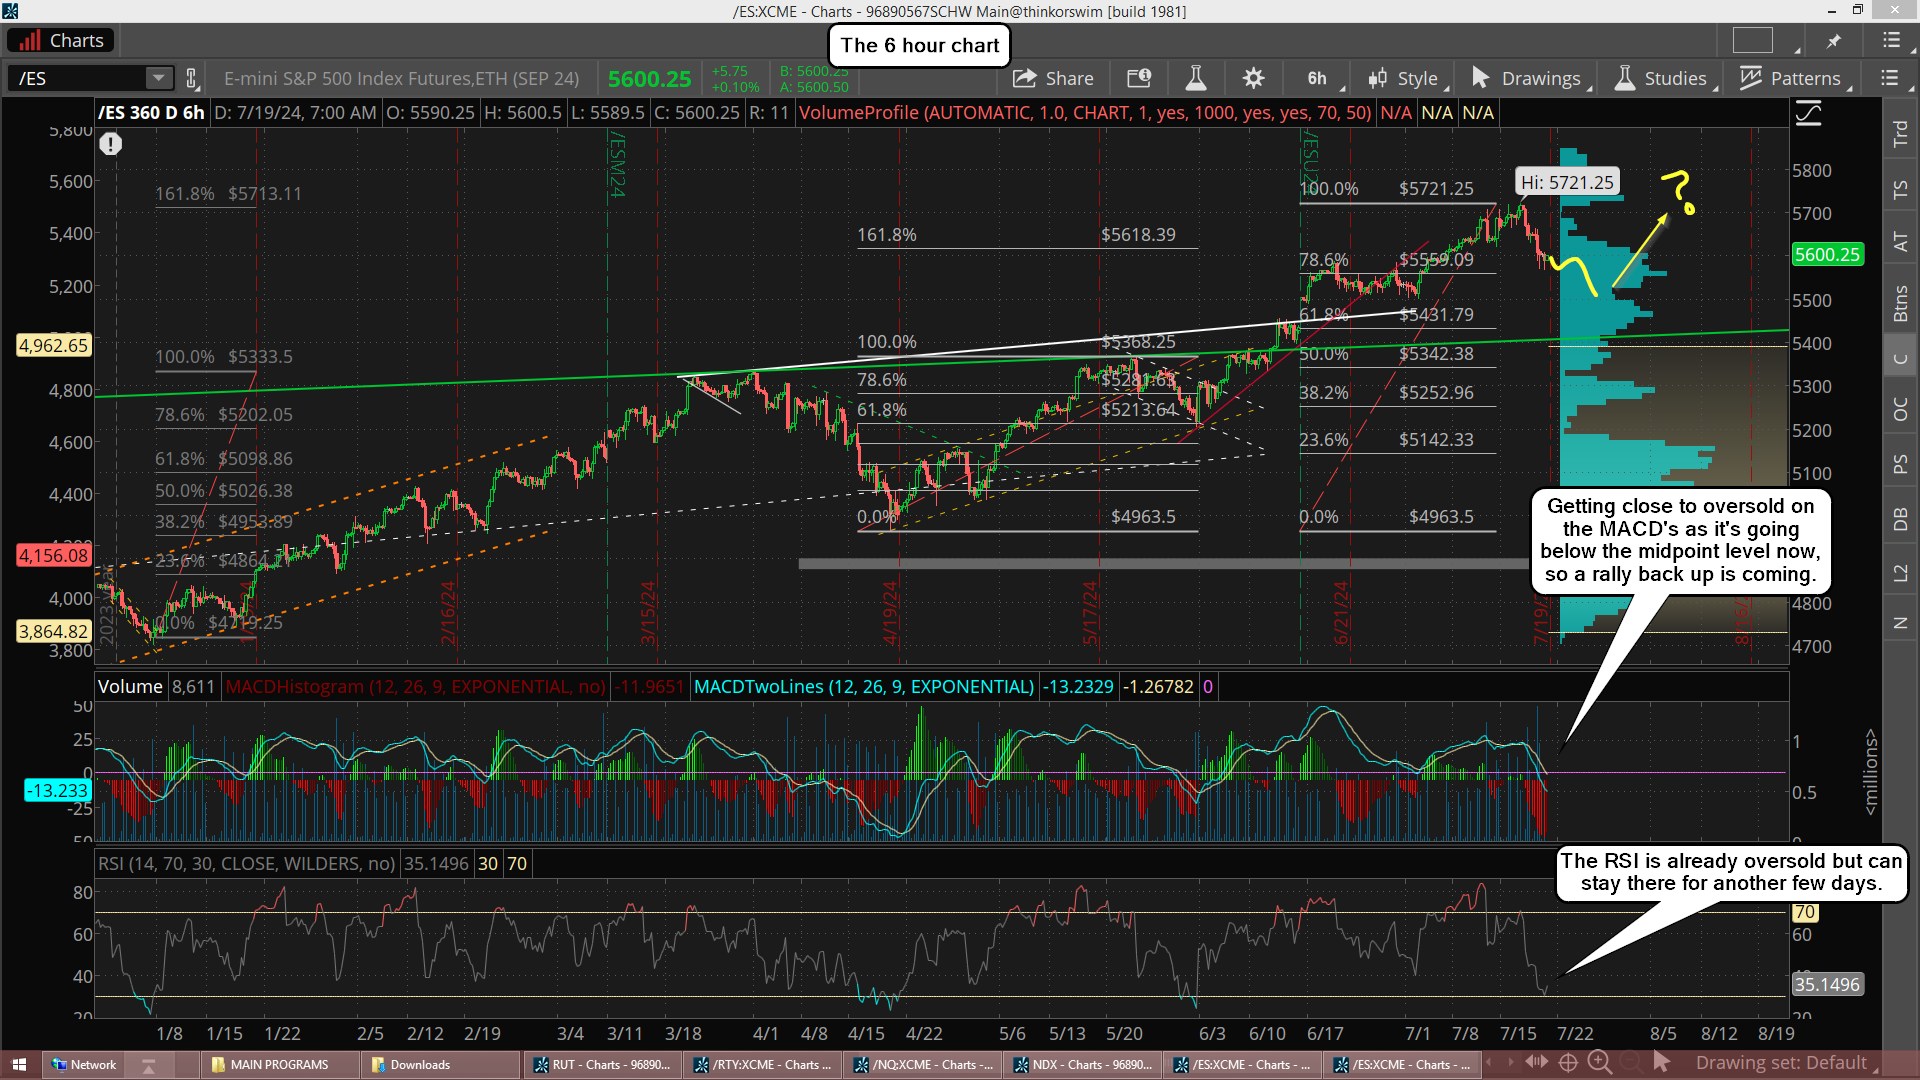
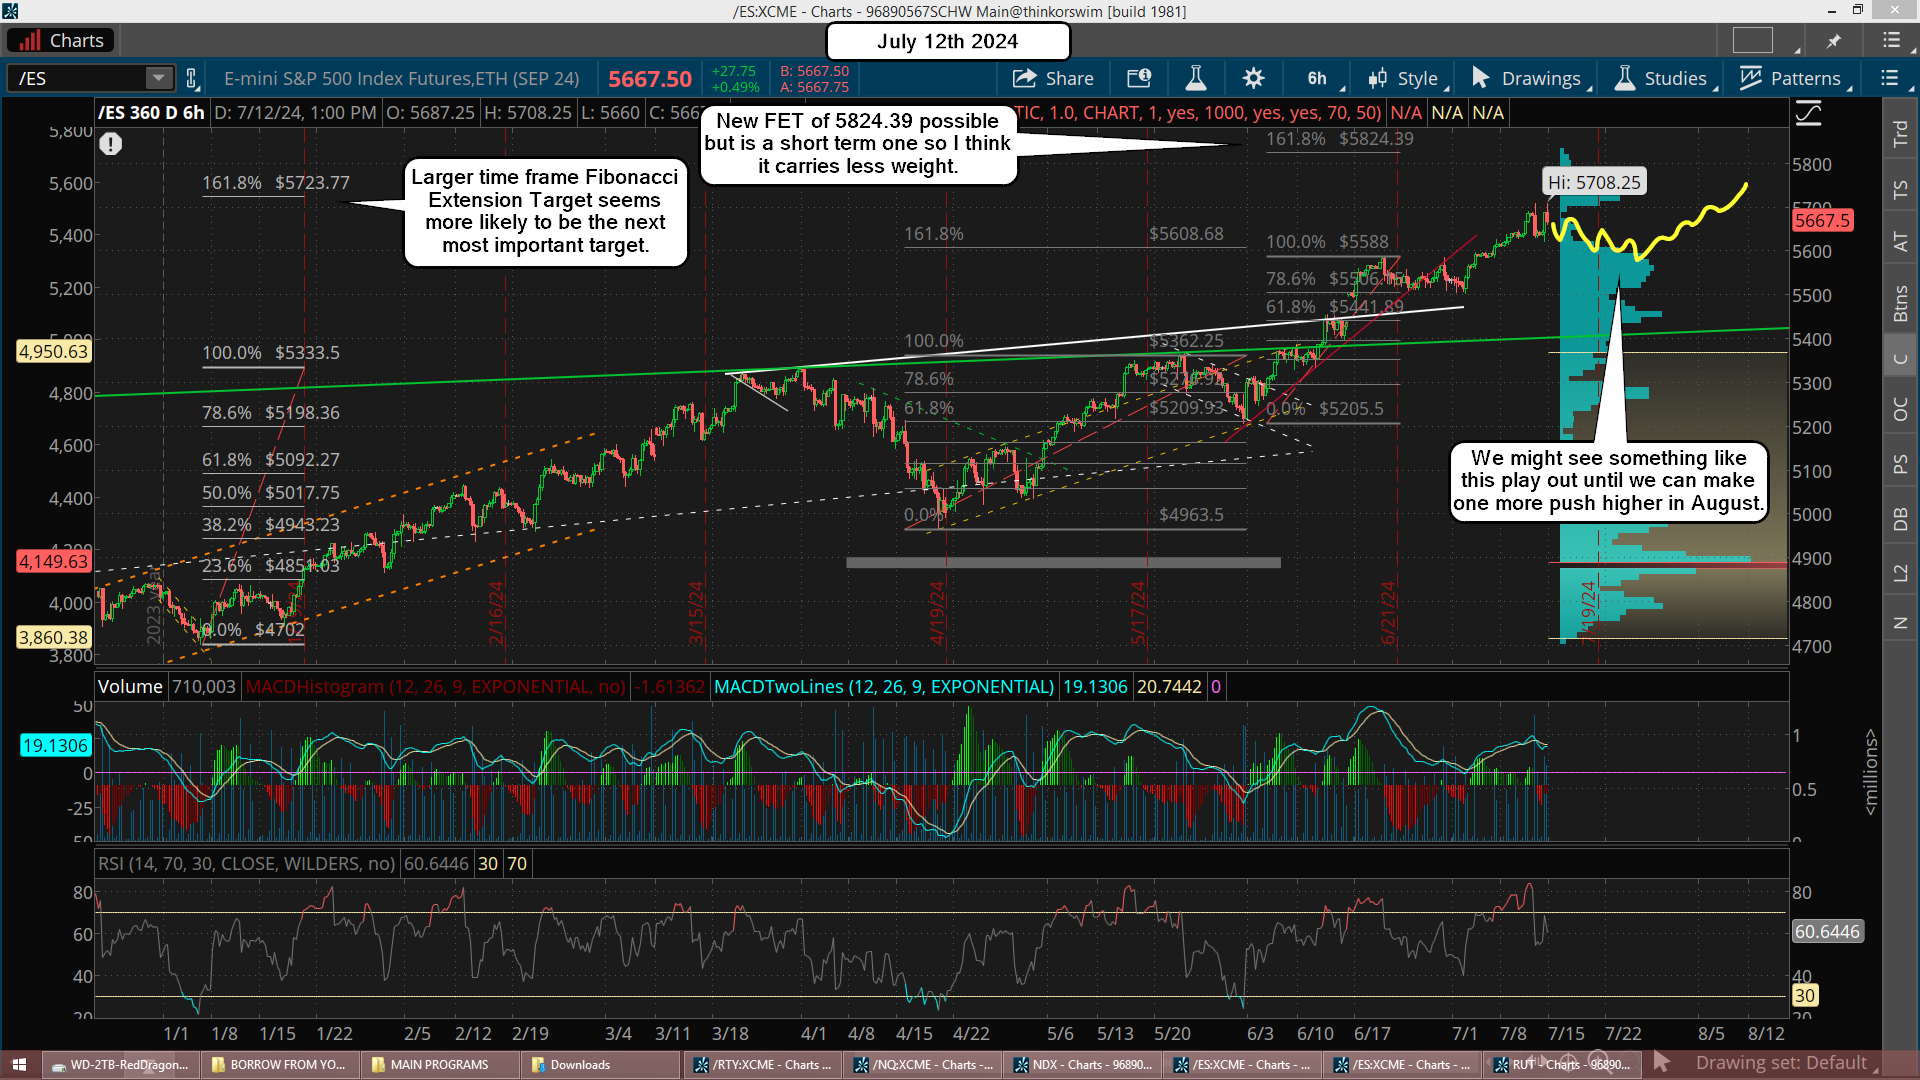
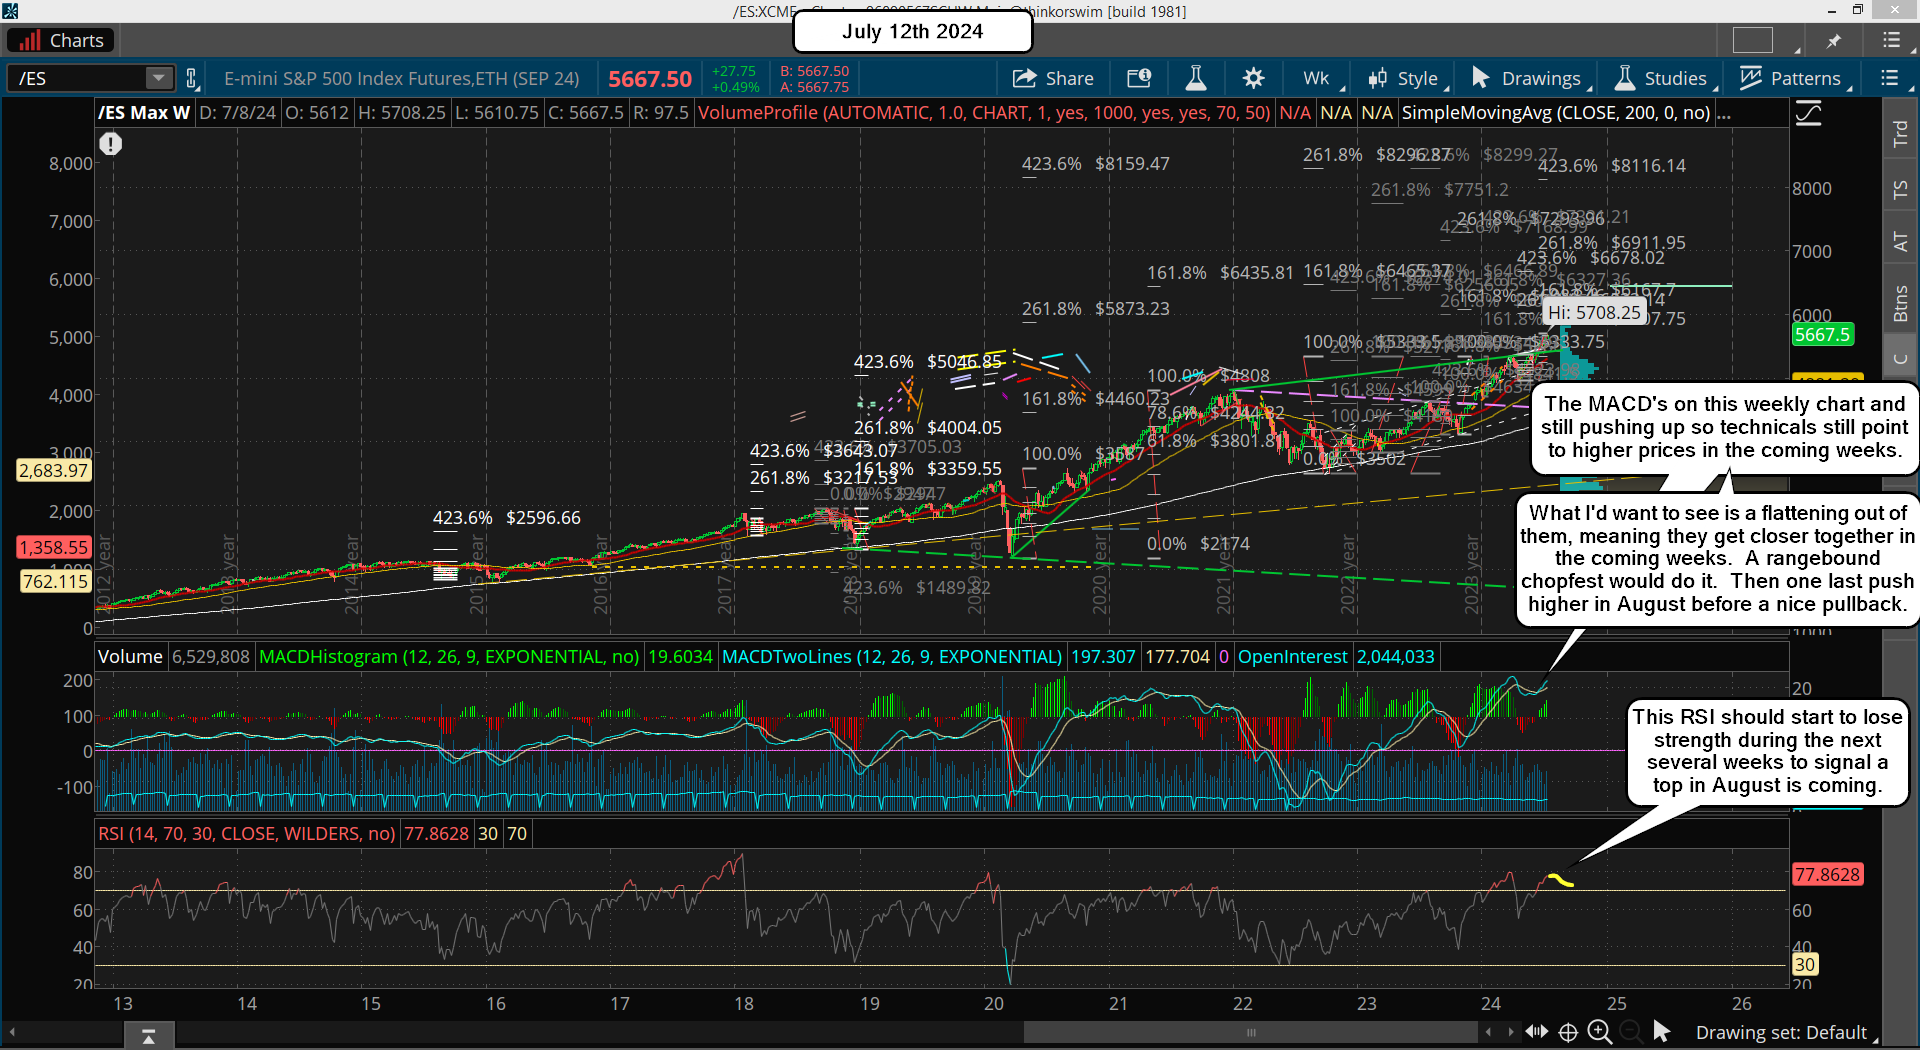
If we rally up toward the rising green trendline in front of the CPI then of course we'll pullback after it, but if we do that pullback in front of it then we should rally up after it. I've added a new rising white trendline on my chart, which will be support on any move down. I don't know how they will do it but I'll be looking for the pullback for a long entry, which should happen this week... either before or after the CPI. Once it's finished though I'll be looking for a strong rally into Labor Day around the end of this month, which could make a slightly higher high. Here's a chart...

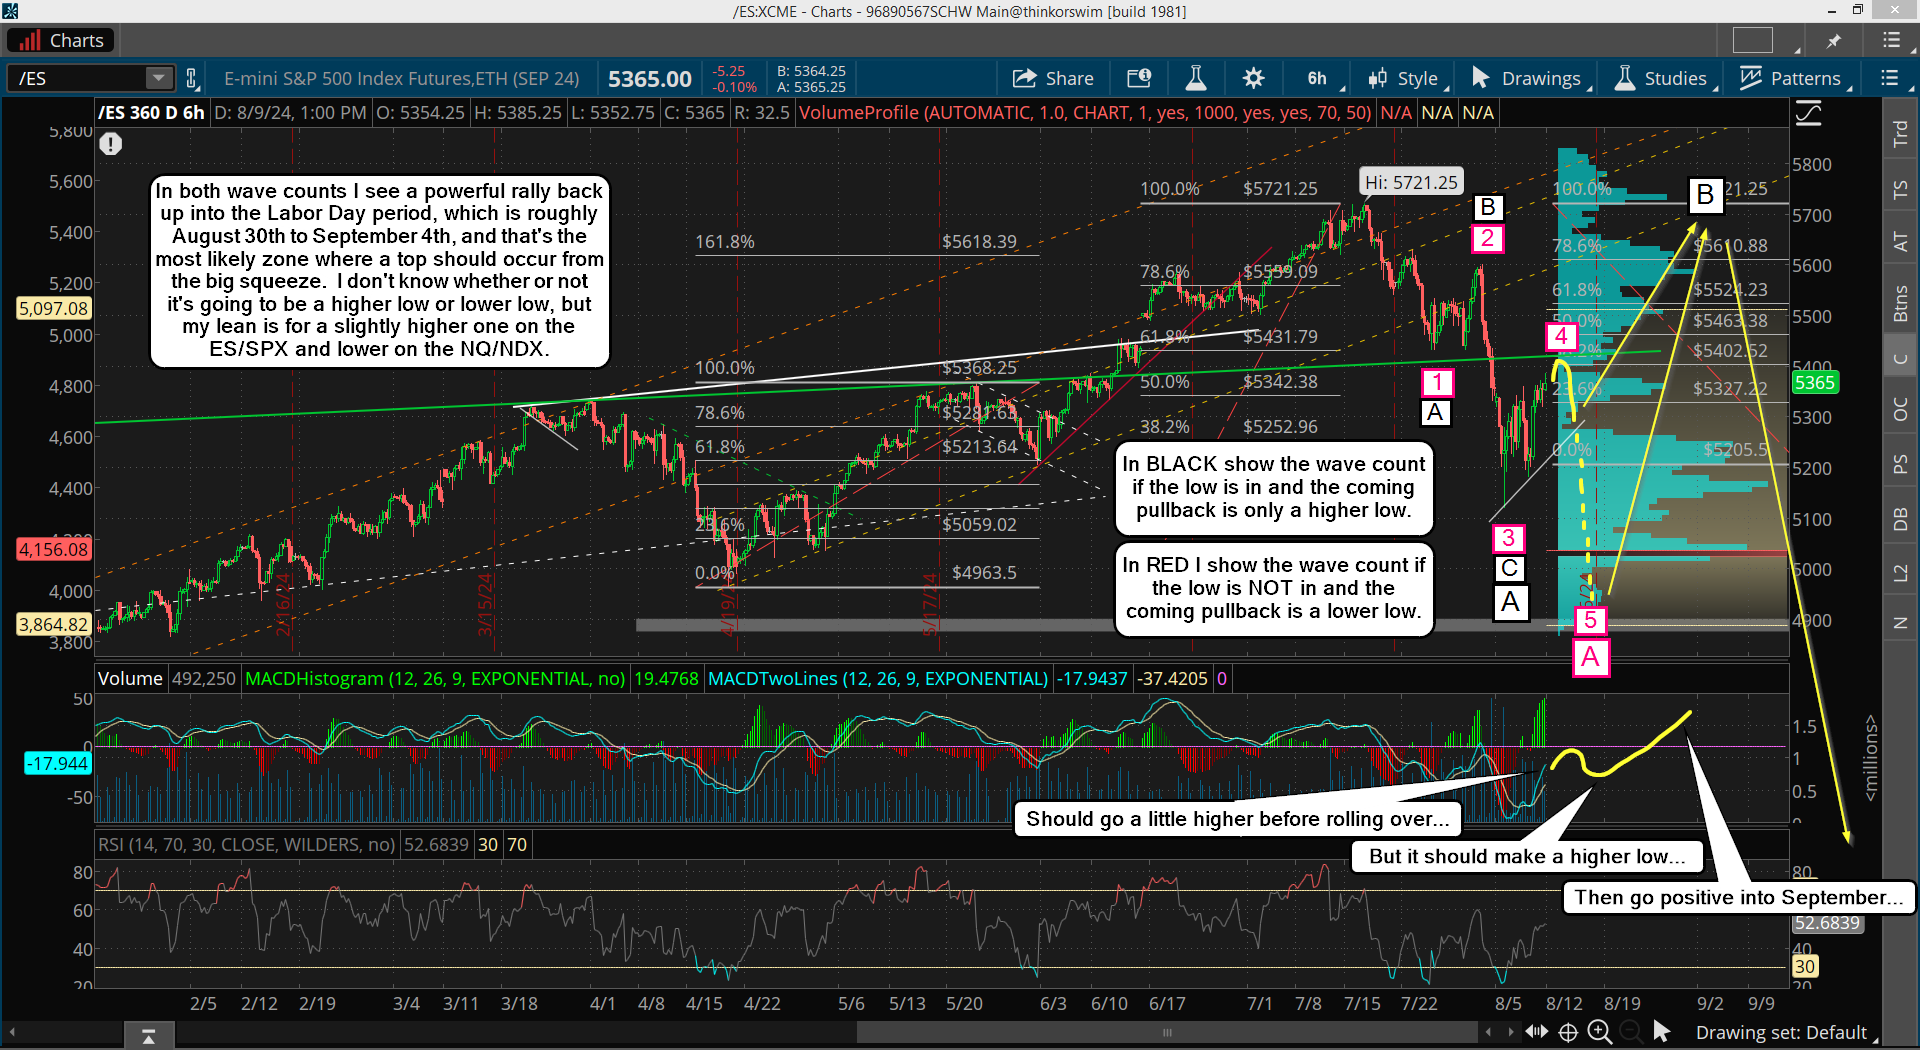
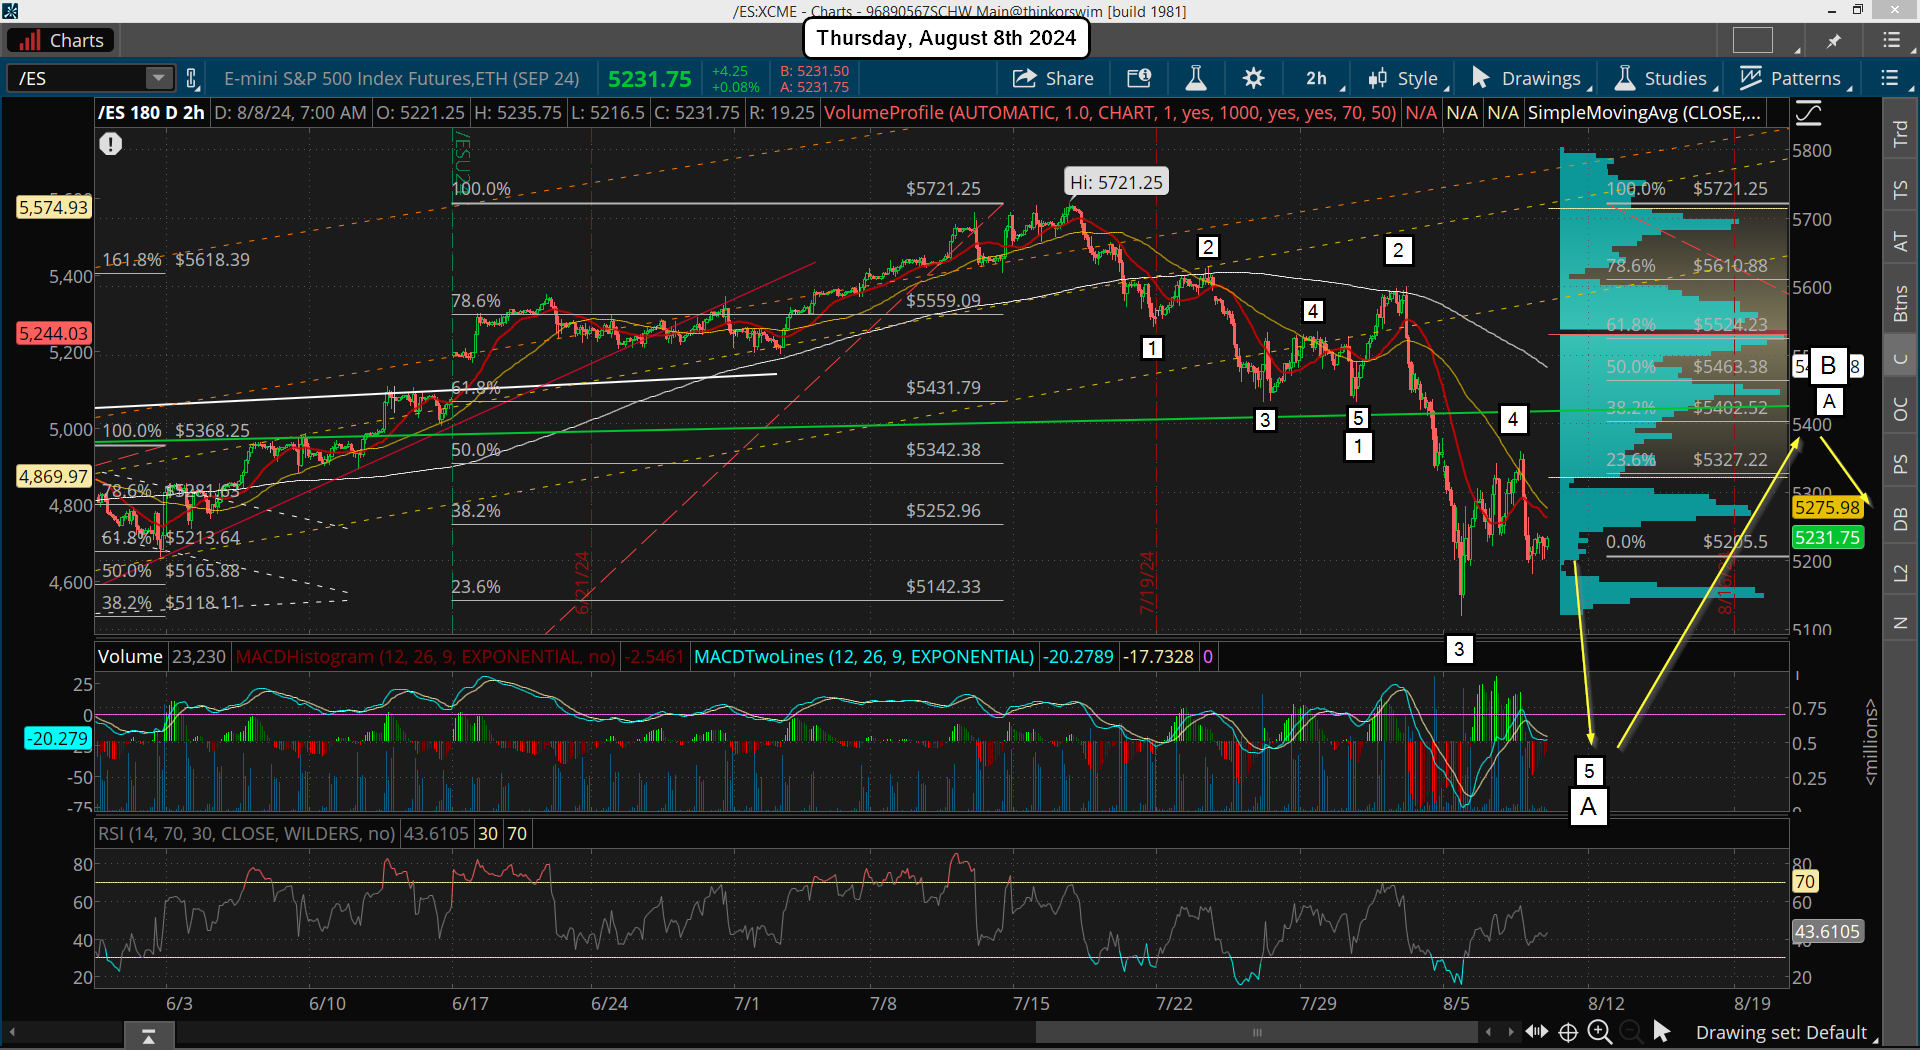
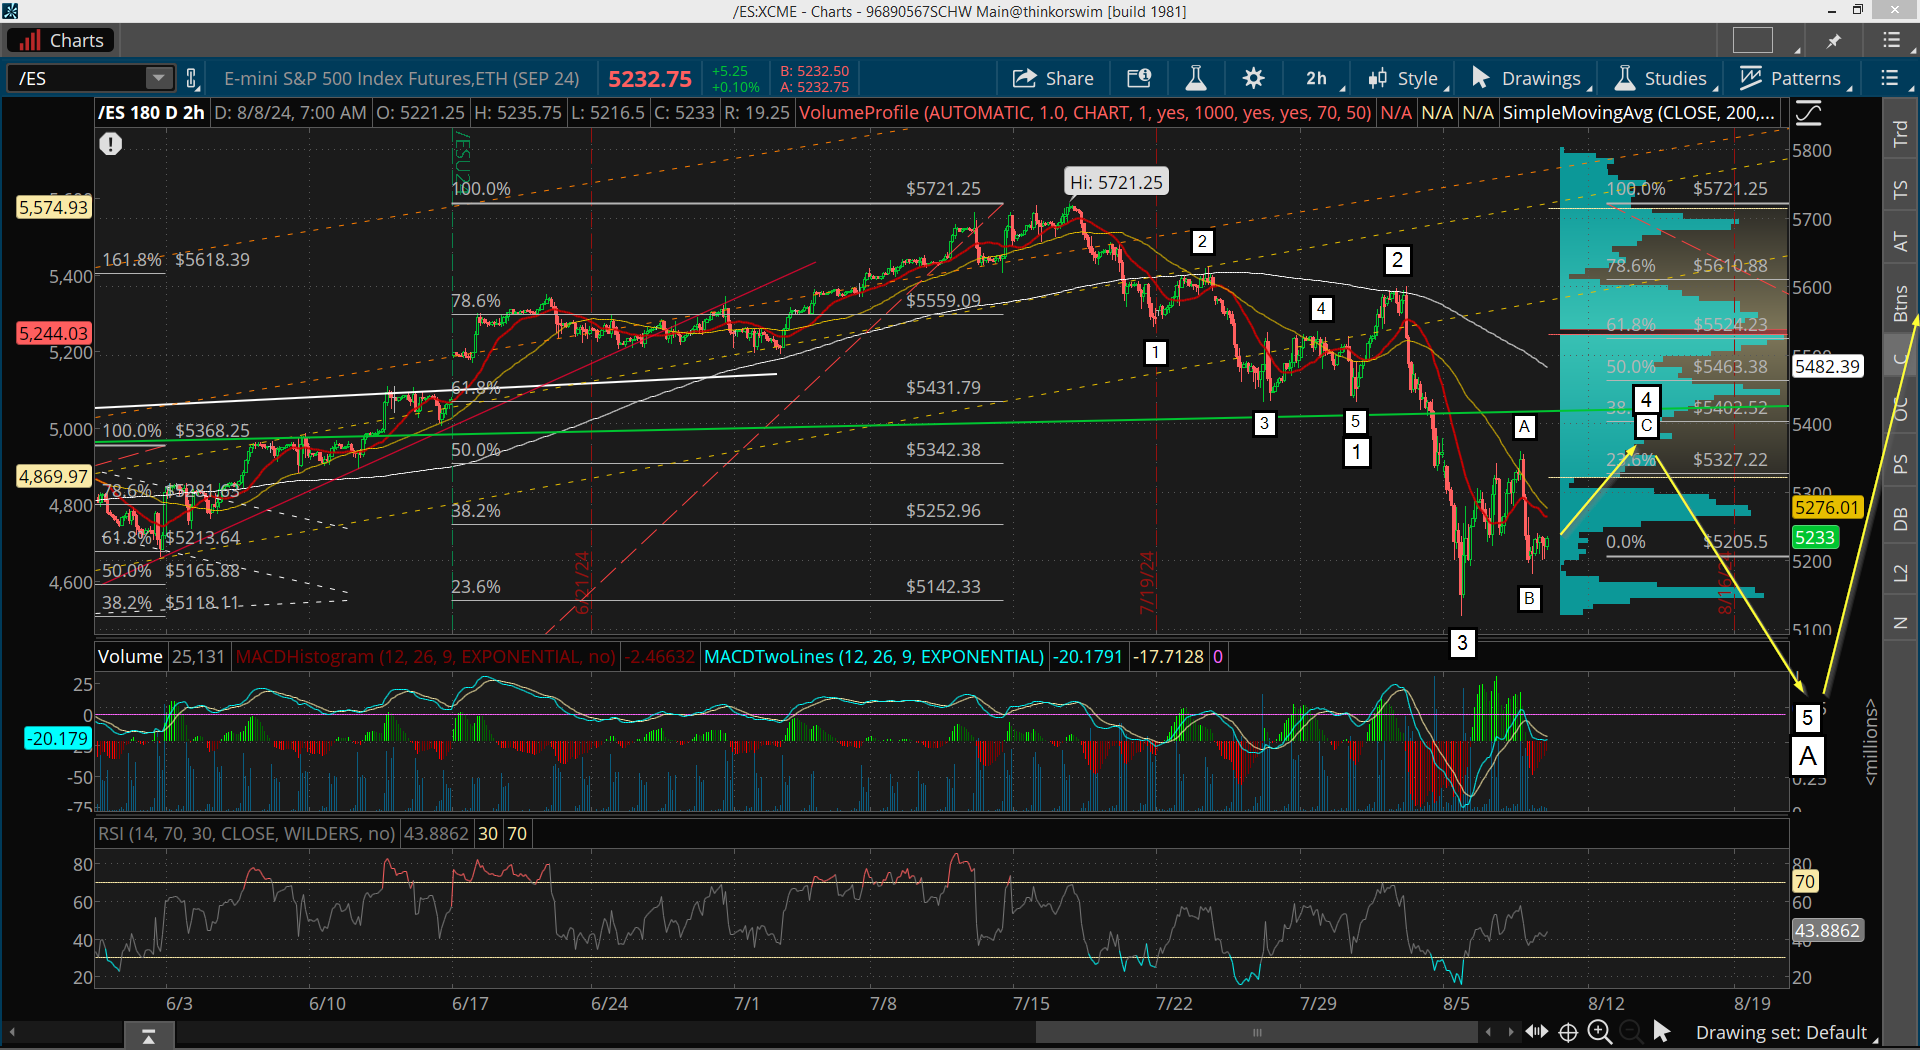
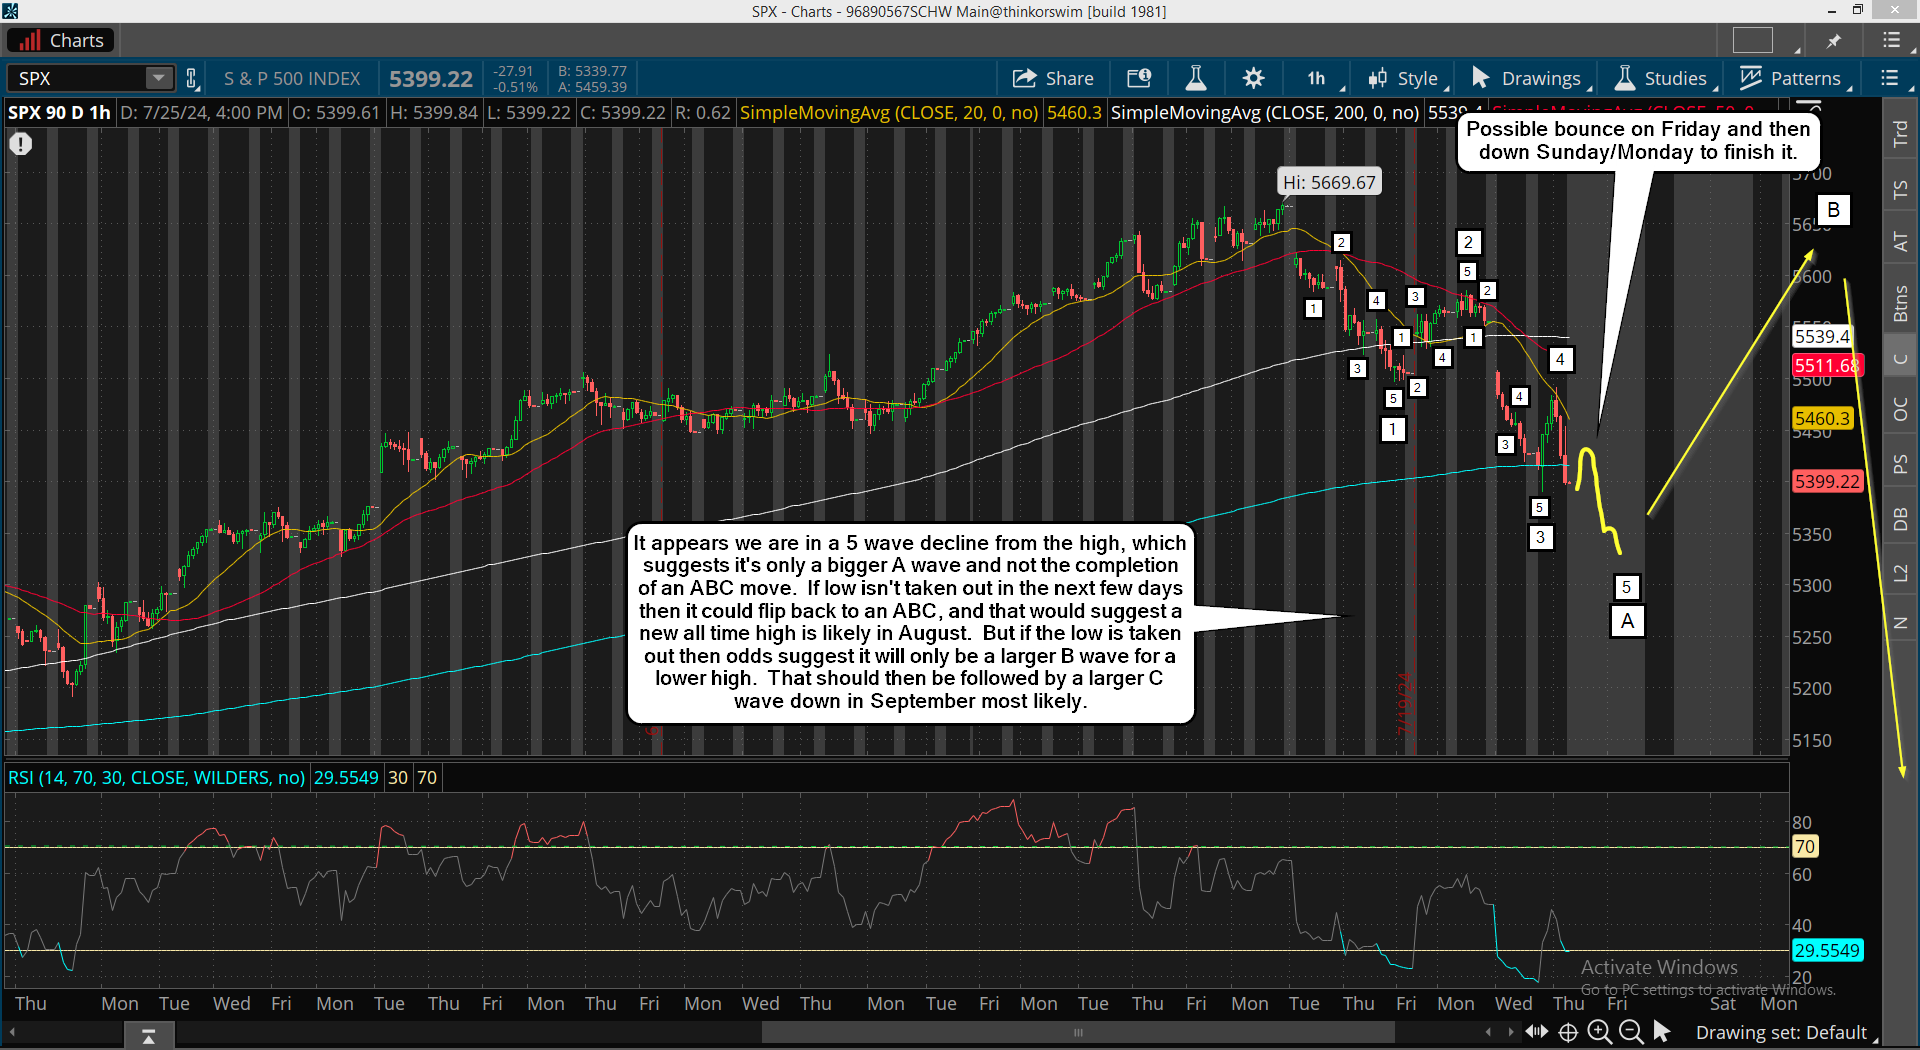
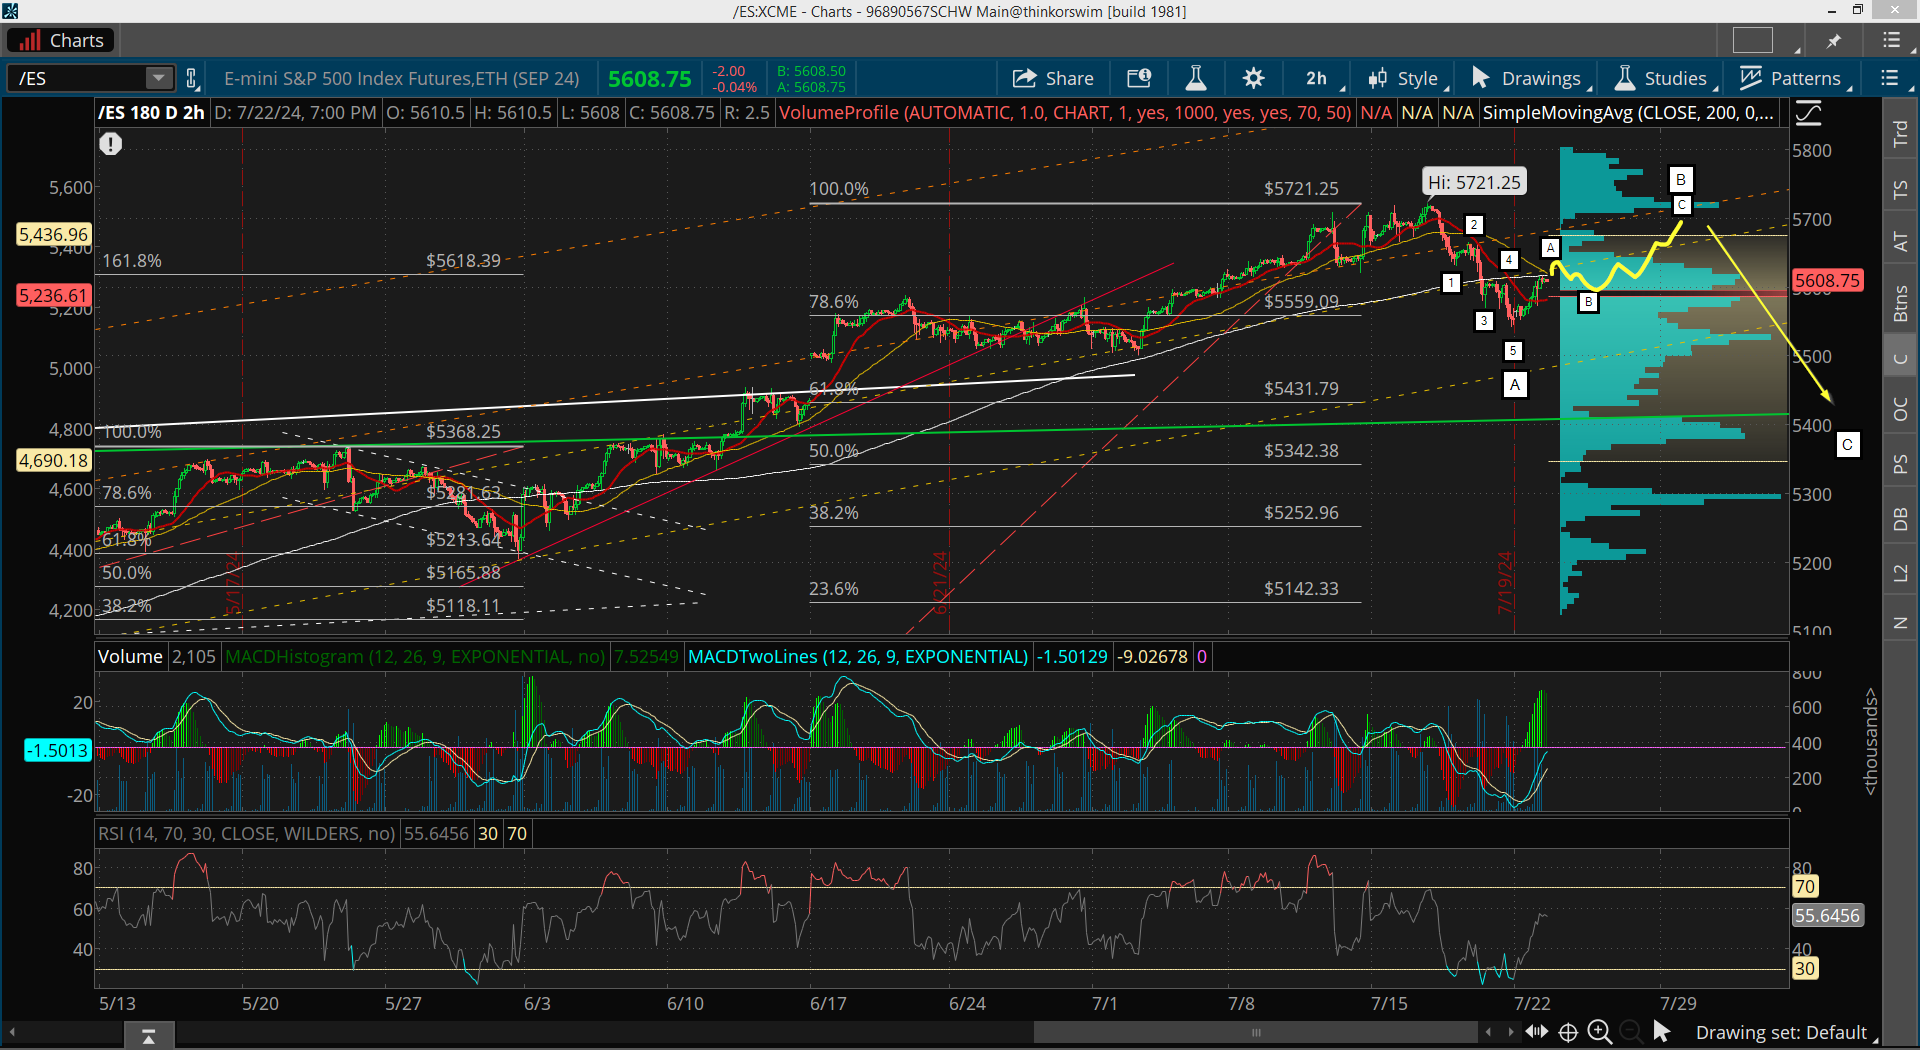
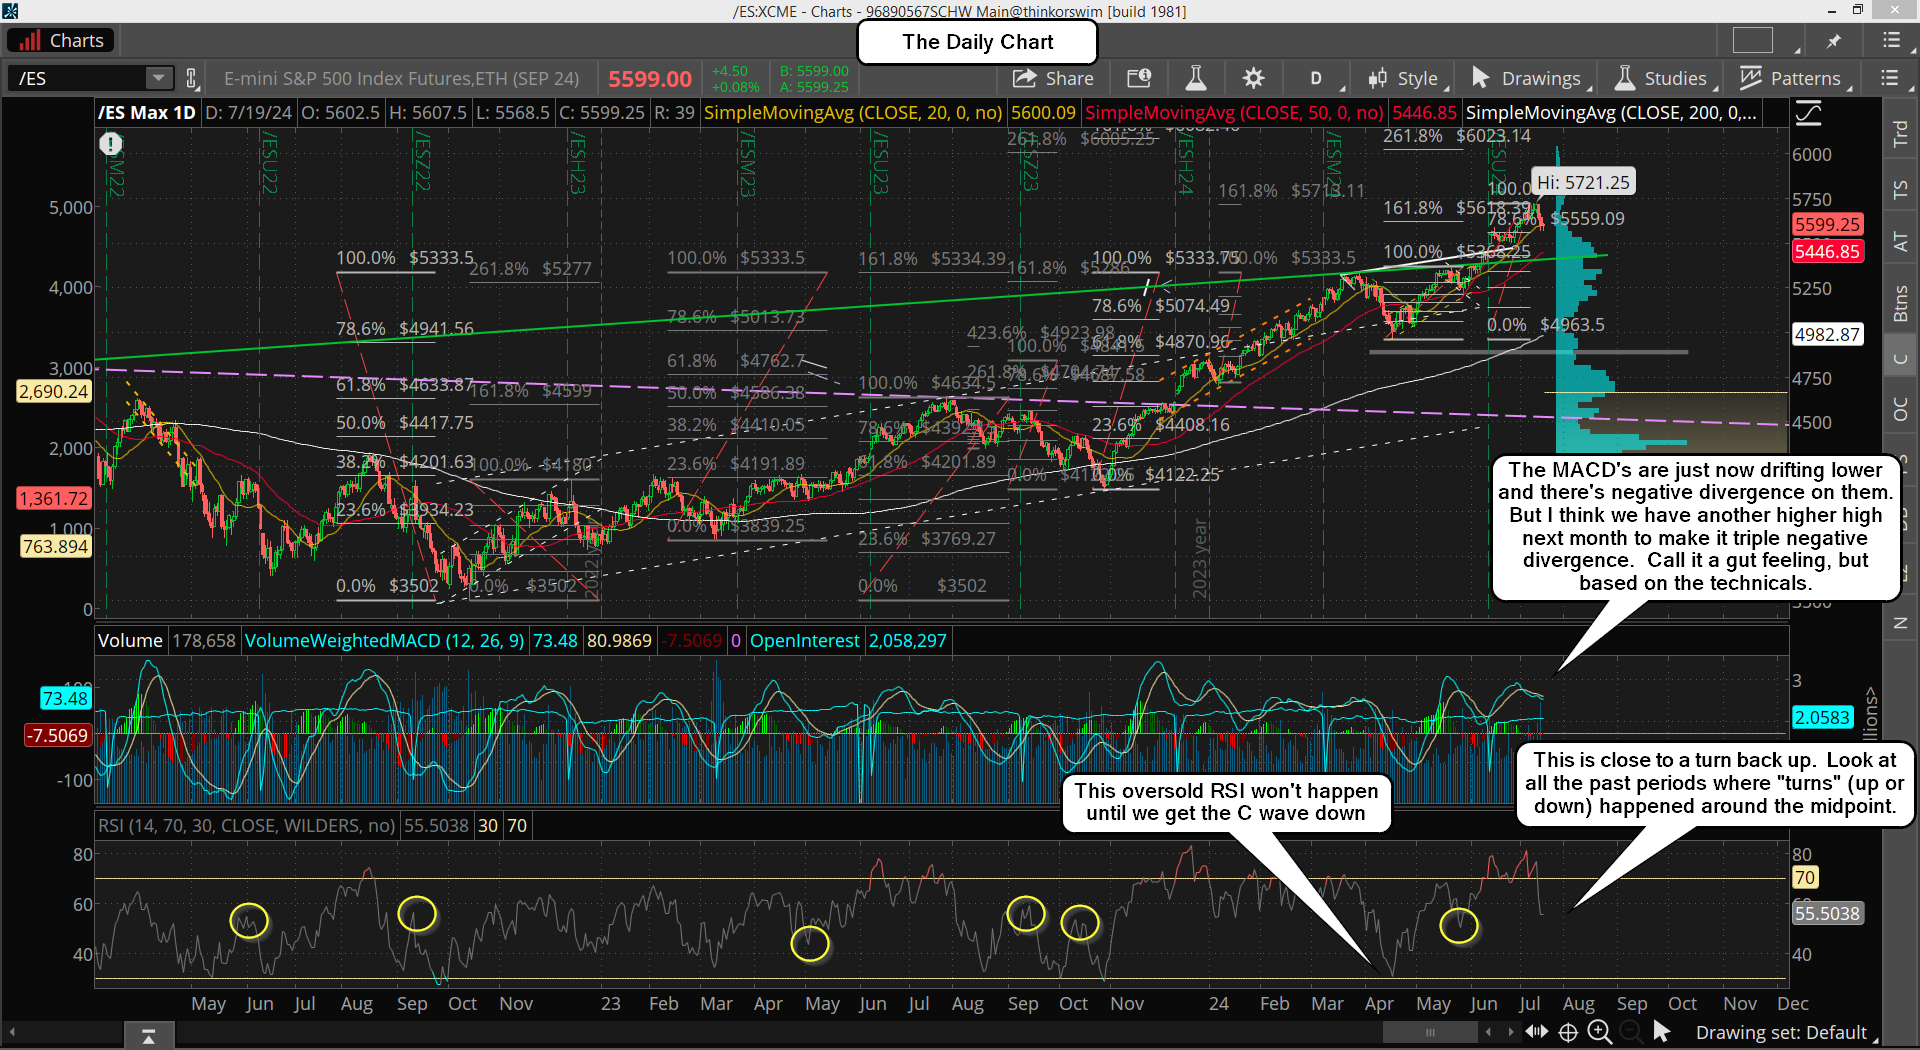
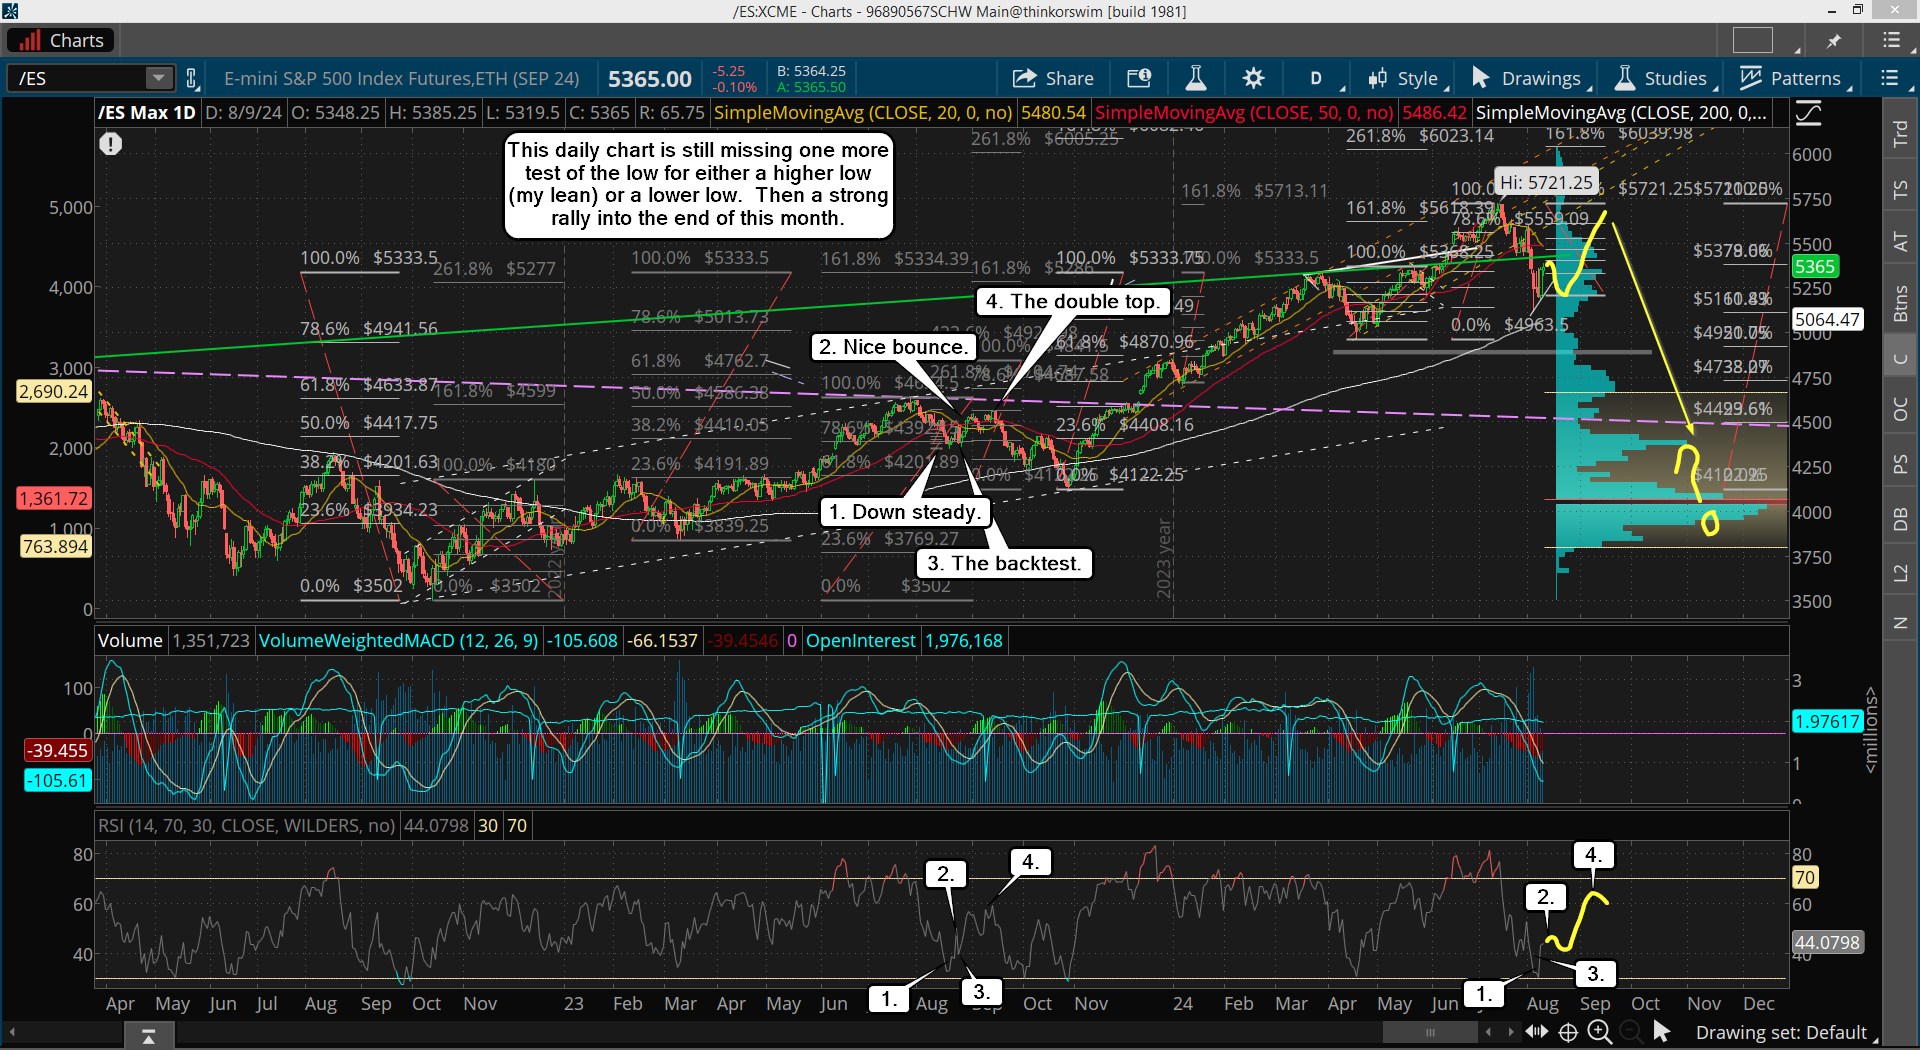
Now if the coming pullback is a higher low then I'll just mark the larger A wave completion at the 5120 current low on 8/5, which will be a 3 wave decline then. If we go lower then it will be a 5 wave decline for the larger A wave and that will mark the low. My lean is for a higher low with the larger A down having already ended, but that's just a guess. And looking at the technicals I lean toward a top in front of the CPI with the decline afterwards, but it could be a low in front of it too. Again, that's just a guess based on the technicals, which look like we will grind higher first and roll over around the CPI this Wednesday. Here's the daily chart...

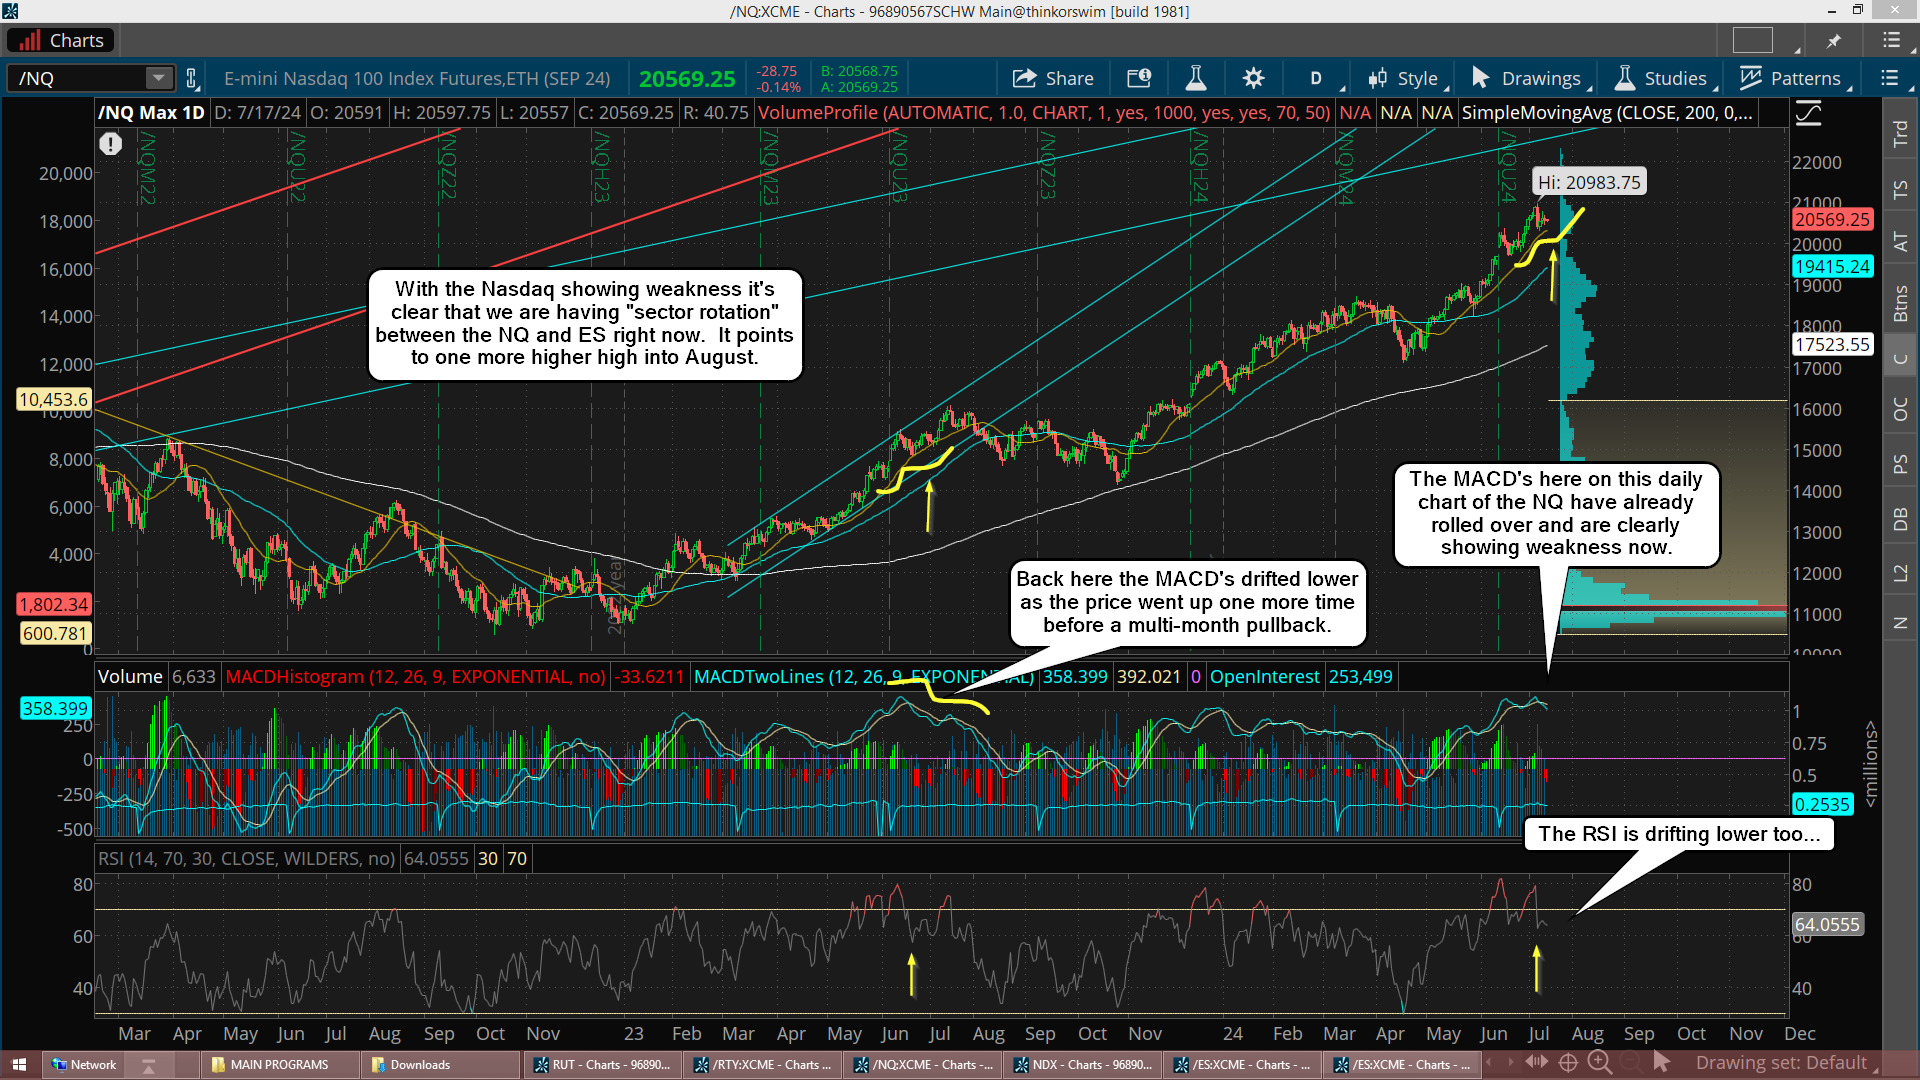
In conclusion I think we go a little higher into the CPI and then pullback for a higher low Wednesday or Thursday. It could drag into Friday but I doubt if they close the weekly candle down... meaning we should see a late day squeeze on Friday if it starts off weak. The rally that should follow will likely last into the Labor Day period where a higher high could happen on the ES/SPX but I don't think we get one on the NQ/NDX.

Have a blessed day.

ES Morning Update August 9th 2024

0

So far the market is looking good for a "turn" late next week as the larger B wave appears to still be unfolding. The "turn" could be the high for the B wave or the low, I don't know which? I posted a chart yesterday on twitter and in my chatroom, with my thought on it, and here's that chart again...

I think we are in the RED path and while it shows a wave 2 down happening today that's just a guess and it might not play out exactly that way. The point I was making is that the market should subdivide in 5 waves for the C wave inside the larger 4 wave up. Currently we are in the wave 1 up and the wave 2 down might not start until we are higher, or it could start now but be very small in depth.

Now since today is Friday we could see some amount of a pullback happen early today and the typical late day rally to start the wave 3 up. And that wave 3 might subdivide into 5 even smaller waves too... who knows for sure? The point here is that the larger 4 wave up is still in play and should last into next week some time.

Again, I don't know if it's a high or low but I lean toward a low because I think there's too much "time" left, and that it won't that that much to complete a wave 2, 3, 4, and 5 inside C of wave 4 up. We have the CPI out next week on August 14th, and from now until then is about all the "time" needed to complete all those remaining waves. Possibly the CPI will cause the last squeeze higher and/or the last drop for the wave 5 down? Just a guess of course as I'll be focused on the technicals mostly, and the wave counts, but everything is lining up for late next week for all the action to happen.

Have a blessed day.

ES Morning Update August 8th 2024

2

We have 2 possible scenario's in play now. The first one projects a bottom sooner, like possibly this Friday It is where the rally up has finished and we are in the last move down now. I believe it is a wave 4 inside a larger A wave down and if the low is taken out we could see a flush down to the FP on the SPY of 483, but again... I don't have any history to track how accurate FP's from Yahoo are, so I'll just be keeping it in the back of my mind and watching the price action and the technicals.

Time of day is important too as we all know the common pattern the market does late on Fridays. Meaning that if we are at a new lower low late in the day but not to the FP that could be all we'll get? Now since this correction is unfolding in a 5 wave decline it's a strong clue that we won't make another new higher high on the next big rally as a 5 wave decline will only be a bigger A wave and NOT a completed ABC to end the correction. It will suggest we'll rally up late August and into September for a bigger B wave to setup a C wave down for October. Here's that chart...

The other scenario is that the wave 4 up isn't finished yet and that it's going to subdivide into an ABC where the rally the last few days was the A part and the B part started yesterday. Once it finishes the C wave up will go into late next week like around the 16th or 19th. From there we'll get the final 5th wave down to possibly hit the 483 fake print and complete the bigger A wave. After that we would still rally the rest of August and a lot of September for the bigger B wave, which still sets up October for the big drop. Here's that chart...

One of these scenario's is likely to play out in my opinion. And the first move up from the bottom of the bigger A wave will be a powerful one, but that will only be part of that bigger B wave as it will subdivide into many, many smaller waves to frustrate bulls and bears alike. Time will be the key to watch and focus on as I think it will last at least a month, probably longer.

We'll likely squeak out a slightly higher high on some of the indexes but not all, which will fool everyone into thinking it's over and we are off to 6000+, but I don't see that happening if we make a 5th wave down this week or next. Now if we don't then the correction might have finished as there will only be an ABC move and therefore the low we saw on Monday ended it all. We'll just have to wait and see.

Have a blessed day.

ES Morning Update August 7th 2024

0

So far, so good. The market is acting as I expected. This relief rally will last 1-2 weeks from my estimate, and that's based on looking at the past. There will be another move down at some point but the "when" part is something I don't know. It could be as early as this Friday or as late as next Friday, and why I think it will make a lower low it could just make a higher one... but a retest will happen as the technicals say it will.

You can look at the 10/3/22 low, bounce and then lower low on 10/13/22 as one example, or the 10/4/23 to 10/27/23 move. The current technicals look like both of those periods, which produced a lower low. But it also looks similar to the 4/19/24 to 5/2/24 move, which produced a higher low.

Either way odds are very strong that another move down is coming in 1-2 weeks, and may lean of course is that old FP on the SPY will be the target, but that's not guaranteed of course. I still don't have any history of FP's on Yahoo to go by, so it's hard to know for sure if they were real with no long track record, which I have with Think or Swim. I'm just patiently waiting to catch the long and will go with the technicals and patterns. If the FP is hit that will just be a bonus but I won't count on it. Time wise it I'm looking at next Friday.

Have a blessed day.

ES Morning Update August 6th 2024

0

WOW, WOW, WOW... that's all I can say about yesterday. But now that the market has calm down a little with the VIX closing at 38.57 from spike high of 65.73 the technicals should get back in align and give us some clues on the future. Everything I spoke of yesterday is still valid as the weekly chart and monthly are still around the same. The daily is just closer now to fully oversold then it was on Friday, so the technicals still point to a strong rally coming.

However, I don't think the current one is going to last very long. We should rollover one more time to make a lower low in price on the ES (hopefully we hit the FP on the SPY) and a lower high on the VIX. This might happen by this Thursday or Friday, but it could also drag out into the end of next week. This drop caught a lot of people by surprise so the first relief bounce will be sold by trapped bulls. The next drop should take out any remaining bulls and lure in tons of bears looking for a crash.

I don't think there were many bears on this drop as it caught everyone by surprise, so this "lack of bears" will limit the first move up as they don't have enough of them short to produce a long lasting squeeze. SkyNet needs to have a maximum number of bears short to get a week plus super squeeze This first rally should last a few days I think and then run out of steam. How high will it go? I don't know but big resistance overhead is the rising green trendline. Maybe we get there, maybe we don't, but I have no interest in any trades on the long side until I see a lower low in price and a lower high on the VIX for a positive divergence in the market. Only then do I see a multi-week rally, as right now I think it's going to be nothing but wild swings up and down to shake out both sides.

As far "turn date" the 16th-19th is a turn window, and that's the end of the week of OPEX, so it could be a high or a low... I don't know? If we bottom by the end of this week then I'd look for next Friday to top out the big squeeze, which is my "lean" as it's common to see a low on the Thursday or Friday the week prior to OPEX and then rally that week to make all the puts expire worthless. I could be wrong of course as it could flip and be a high this Friday and a low next Friday but I'd just allow it to play out which every way it wants too as I'm looking for a great long setup, and it's not here yet in my opinion.

Lastly, here's something interesting... it will be 666 days from the October 13th, 2022 low into this Friday, August the 9th. Possible low I'm thinking, but we'll see.

Have a blessed day.

ES Morning Update August 5th 2024

3

Friday's nasty drop looks and feels like a capitulation move to me. The VIX almost hit 30 but closed at 23.39, which left a nice topping tail candle on it. I doubt if there's much more to go on the downside for the market (if any) as many indicators tell me a low is near. If Monday goes a little lower it's just the last buying opportunity in my opinion. Here's that VIX chart...

As you can see on the VIX chart every time in the past that we saw a topping tail spike happen it was followed by a strong rally that lasted for many days. Do I think that means a new high is coming? Probably not as there's still a lot of bearish pressure on the market from the weekly chart, but a sharp multi-day squeeze seems likely this week.

Possibly we see a "one day wonder" followed by a full reversal the next day, and then a "multi-day" wonder? When I looks for similar patterns from the past the 9/21/21 low and the 10/1/21 low looks a lot like the setup in the market now. If I had to pick which date I'd say we look the closes to the 10/1/21 low as the MACD's on the daily chart are at a similar point and so is the RSI. Even the RSI on the weekly chart looks like that 10/1/21 period.

The rally from back then produced a new all time high and topped out about 2 months later on 1/3/22. Could that pattern repeat? It's possible for sure, but there's no way to be a 100% certain of course. For now though I'm just looking for a strong rally up for several days, which should be sold as trapped bulls exit. Then "if" we repeat the prior pattern there will be one last pullback, like the 10/7/22 to 10/13/22 period, which will make a higher low and setup an "inverted head and shoulders" pattern. It's from that point forward that the market could start a big squeeze to new all time highs.

Have a blessed day.

ES Morning Update August 2nd 2024

0

Looks like the market decided it did want a triple bottom after all. I guess the overall bearish pressure from the weekly chart is keeping the rallies from lasting more then a day or so. Interestingly there was a FP on the QQQ from Wednesday that hit on the pullback, which I wasn't sure or not if that was going to happen or not after such a powerful rally from the Tuesday low.

But it did indeed hit yesterday, so now we need to give it a few days to see if it's going to hold or not? Triple bottoms can fail more often then double bottoms as support is weaker, but even if it does fail I would not a expect a huge drop to follow, and would instead expect it to be a stop run on the bulls ONLY that got long from it yesterday. I don't see it starting the bigger C wave down... not yet.

I could be wrong on that but so far the drop just looks like the last wave down inside the bigger A wave, which would be a wave 5 with the squeeze wave from Tuesday being the wave 4 inside that A down.

The A wave should have 5 waves inside it, which it clearly has right now.  I thought it was finished at the double bottom low and that we were starting the bigger B wave up on Tuesday, but that was wrong it seems as A down clearly wasn't finished.

The FP on the QQQ being hit now suggests we will go back up soon, as from my history of Fake Prints they usually are pierced and then a "turn" happens. Now that "turn" could be short lived, like a few days, or a multi-week one, there's no way to know how long it will be.

And if another FP is put out shortly afterwards then of course the "turn" will be short lived but still served it's purpose by fulfilling the FP and turning from it. I don't see any new FP's currently, so my lean is that we turn back up shortly... like by Monday at the latest, if not sooner.

Have a great weekend.

ES Morning Update August 1st 2024

1

We got the rally I was looking for yesterday. Today is more of a grind higher as the market is clearly in a breakout mode. I don't know if we make a new all time high or not, but it's possible in the coming weeks. I posted the following in the chatroom yesterday and I still thinks i

"The recent decline from the all time high into the low reminds me a lot of the decline from 11/22/2021 to 12/1/2021... which suggests (if we repeat that pattern) that we'll see one more higher with a month or so".

It suggest a period of choppy action around the all time high into mid-August and then a pullback. Then a final move up to make a new all time high in September. This would be a "stop run" on the bears of course, and typical before a bigger decline. Whether or not it happens I don't know but that's what I lean toward.

Have a blessed day.

ES Morning Update July 31st 2024

0

Yesterday the bulls failed to breakdown from the "cup and handle" pattern. The drop changed the wave count. In the chatroom yesterday I posted the following...

"This new drop to a double bottom now makes a clean 5 wave decline. This tells me odds of a new all time high now are not good. This 5 wave pullback now should be just a larger A wave and the C down should still happen in late August or September. Now the B wave up might "pierce" the current all time high by a little amount, as that is allowed in Elliottwave, but there should not be any large breakout high... like another run to 6000+ as this 5 wave decline doesn't allow it.".

And I think we'll get some kind of divergence between the different indexes with the coming bigger B wave rally... meaning we might see a slightly higher one on the ES but not on the SPX. Or it's on the ES and SPX but not the Nasdaq, and I lean that way because the Nasdaq is the weaker index and has already corrected more in percentage then the SPX/ES.

The DOW is the strongest but it may or may not make a higher high, but it's not that important really as all 3 indexes should not go much higher before a bigger pullback for a C wave in late August or September.

On the short term, we are getting oversold, or very near it, on the daily chart now.  And the 6hr and 2hr chart are looking oversold too... but they are putting in a divergence on their RSI and MACD's.  We also are close to the rising green trendline of support.  Everything tells me we are either bottomed now or super close.  It's the common pattern where the end of any month or the first of a new month, so you have that "clue" as well.

All of that and the fact that we have an FOMC today just smells of a short squeeze coming.  There might be one more push down to run any stops on bulls that bought the double bottom but it's not needed or required.

In conclusion, I think we have a rally up the rest of this week and into early next week.  I don't know if it makes a new all time high or not but I'll be more focused on the wave counts and the technicals then price.  Keep in mind that many "B waves" are extremely hard to figure out and trade successfully.  It will subdivide into an ABC and each of those waves will subdivide more.  So don't be shocked if it takes 2-4 weeks to play out.

Have a blessed day.

ES Morning Update July 30th 2024

0

Well... up in the morning and down in the afternoon. We will probably see more of this in the coming days as B wave are notorious for tons of wild moves in both directions. But I still think we will go up over all this week instead of down. These up's and down's though could continue throughout the week until it traps enough bears and starts a squeeze higher late this week. I don't have much more to add so I'll end it here.

Have a blessed day.

ES Morning Update July 29th 2024

2

It appears that we bottomed last Thursday so this coming end of the month or first of the next period, where "turns" commonly happen, should be skipped. But I don't think we are off to a new higher high yet. There's very likely another drop coming but it might not happen until mid-late August. Meaning we could go into a choppy period for several weeks to carve out what is likely a B wave up with the A down ending last week. This is all about the weekly chart basically, which is still putting downward pressure on the market and needs a good 1-2 months of "time" to reset.

While I'm thinking there's a lower low coming on the C wave it's also possible that it never happens and instead we just chop long enough to "cool off" the overbought weekly chart enough to allow the next strong rally up to new all time highs again.  I don't think we are done on the upside as many "clues" point to a final high in September, so "time" is very key here.

If the bulls can hold the price up above the current low for long enough there's no need to make that C wave down.  What I'll be looking closely at is how high we go in the next week or so on the bounce.  If it's high enough (above 50% retrace from the low) then the next pullback could make a right shoulder in an "inverted head and shoulders" pattern.  If that happens, and we have oversold short term technicals, then I'll lean toward "no lower low" and the next rally should make a higher high in September.

As for today we are getting close to overbought on the 2hr chart but the 6hr still has plenty of room to go higher, so my thoughts are that we go up into Tuesday/Wednesday and pullback for a higher low Thursday/Friday.

Have a blessed day.

ES Morning Update July 26th 2024

4

Getting close now to the low. Charts everywhere are oversold or very near it. My big question is... "Will this low finish the correction?". That's something I don't know for sure as while I do see a strong rally back up after the low I do not know if it's the rally up to new, even higher highs, or a lower high. My lean is for a lower high, a larger B wave basically, then a C down in September. Here's what I posted in the chatroom yesterday.

The reason I feel this way is because the weekly chart needs more time to "cool off" before another strong multi-month rally to new all time highs. It is pointing down on the MACD and the RSI, so it's going to be very hard to stage a long lasting rally with such negative downward pressure on the market.

But another higher high is still likely because the monthly chart is still bullish with no sighs of a final high yet.   In fact, this month of July has put in higher volume on it then prior months, so that's another clue the bull market isn't finished yet. Now that doesn't mean we can't have a good sized correction but there should not be anything like 2022.

That entire year the market was under the 200 daily simple moving average and we've been above it ever since. Could we pierce through it for awhile? Sure, but we shouldn't stay under it for a year like 2022 as the MACD's on the monthly chart back then was going down, so was the volume. It's still pointing up now, so this market has not seen any final high in my opinion.

As for the short term, I still think we will bottom in by next Monday, and we might have bottomed yesterday... I'm not sure? But we are close right now.

Have a great weekend.

ES Morning Update July 25th 2024

0

The prior low for my bigger A wave down was taken out yesterday, so that means the bigger B wave up finished at Tuesdays high. It did not subdivide into a smaller ABC up. We should now be in the bigger C wave now, which should unfold in 5 waves. Yesterdays drop was the smaller wave 1, which will be followed by a smaller wave 2 bounce. This could all complete by the end of this month.

The daily chart on the RSI is working its' way lower and could reach oversold in a week. If it does then I'd have to lean toward an early rally up in the first few days of August that fails to make a new high. Then a pullback into the second week for a higher low, which would make an inverted head and shoulders pattern and be very bullish for another higher high into September.

That's my "lean" but I could be wrong of course.  The clue will be to see how the coming low finishes.  If it's a clean ABC, and the technicals on the weekly look like we could have another higher high, then I'll stick with my lean.  But if we end this move down in 5 waves I'll then have to consider that it's just one bigger A wave and that we'll only make a lower high with the rally back up into August/September.

If that happens we'll see an even larger move down to follow for a much bigger C wave.  It would then re-open the door for those 2 FP's on the SPY from the Yahoo to be the target low.  We'll have to keep a close eye on how the coming low unfolds as that will give us the clues.

As for today, we could bounce late into it, or sometime Friday.  But I don't think it's finished yet.  "Time" is the important then here, not the price.  So "time wise" I think it's going to be next week before we see a bottom.  We could see it Sunday/Monday but it could be revisited late in the week after a mid-week rally fails to hold.  The end of the month is where many bigger "turns" happen.

Meaning that if we get a low on Sunday/Monday, and start a strong rally back up, it would either be a wave 1 or A wave, which late in the week will be followed by a wave 2 or B wave down.  That one could revisit whatever low we get in the next few days.  My thoughts on it still suggest the rising green trendline.

Have a blessed day.

ES Morning Update July 24th 2024

0

Ok, the plan is playing out as expected as we should be in a B wave down inside a bigger B wave up, which should top out into next week. Now if the recent low is taken out then there's a different wave count in play, but for now it hasn't and I'm sticking with the current wave count that projects a C wave up next inside a bigger B wave. I'll end it here.

Have a blessed day.

ES Morning Update July 23rd 2024

2

Ok, we got the bounce as expected, which could go higher still as the RSI and MACD's on the 6 hour chart have plenty of room to run higher. But, I tend to think this rally up will be an ABC and that we are just in the A wave now. I won't know until I see what happens on the next pullback, but I lean toward it being a higher low (the B wave) and then another C wave up into the end of this week or into the end of this month.

It looks too strong of a bounce to be a wave 4 with a wave 5 down still left to come... which would then complete the A wave down. I think the A wave down already ended at the recent low as it's a clean looking 5 wave pattern and again... this bounce is too strong for a wave 4. Keep in mind that most (not all) C waves subdivide into 5 smaller waves. So if we are in an A up inside an ABC of a bigger B wave then the C part could drag out into the end of this month.

The Seasonality Chart has been off some this year but does get back on track after brief periods of not being in-sync. the middle of July is a choppy (pause type) period and we did get the recent pullback from the 16th to the 19th, so that's close to working. The first part of July is bullish and that worked out perfectly, and the last part of July is bullish, so that's when we could see the C wave up inside the B wave. Then the first week of August is bearish, so that could be the C wave inside the C wave to complete the ABC down from the 5721 high. Here's what I'm thinking...

Have a blessed day.

ES Morning Update July 22nd 2024

0

So far so good. Last Friday failed to hold any early rally and went lower intot the close as I expected. I think we are going to get an early rally this week to possibly as high as 5630 roughly? But then I think it fails and we have another drop lower into the end of the week and possibly the end of this month. At this point I think we are headed to the rising green trendline over the next week or so, which is in the mid-5400's.

If this happens then I think we will be oversold enough to start a rally in August, but I don't know how high it's going? It could just be a B wave up with the drop to the rising green trendline being the A wave... or the correction could be over with and we start the last rally up into September/November, which is really what my lean is. Meaning that I think the coming low will be it and then we'll start another 5 wave rally up into the election, which should top prior to it, like in September probably.

If it's some blow off top then it could be up to the 6000+ area? I have added a new FET that uses the 5205.50 recent low and the current high of 5721.25, which projects 6039.98, and the FET from the 10/27/23 low of 4122.25 to the 4/1/24 high of 5333.50 projects a high of 6082.46, so there's two FET's pointing to the same zone. This tells me it's a magnet to hit the 6000 zone, so let's not rule it out as we go into the super important FOMC meeting on September 18th. We all know that this market has been front running a Trump victory in the November election so that could be a "sell the news" event. And if the Fed's cut rates history tells us that the market will drop afterwards.

As for the short term I lean toward a rally early this week that gets sold off with one more move lower before any solid rally can stick.

Have a blessed day.

ES Morning Update July 19th 2024

0

I didn't have a chance to do a post yesterday... sorry about that. Hopefully everyone figured out that the move down wasn't over with on Wednesday, and in fact I still don't think it's over, but it's close. The RSI on the 6hr chart is close now to oversold, and I suspect it will get that way today or possibly into Monday morning.

We likely had a wave 1 down Wednesday, then a small 2 up early Thursday with the wave 3 down the rest of the day. That wave 3 could subdivide into 5 smaller waves and still be in play today?  Once finished, possibly a bounce into the close today to do the wave 4, and Monday finishes the 5th wave down. All of those waves should make up the A wave in an ABC down that could drag out into August. Here's that 6hr chart.

Now on the daily chart we reached the midpoint level on the RSI so a bounce is coming in a few days, but the MACD's are still up to high and will likely go negative for that C wave and then the RSI will probably reach oversold too (or close to it like 4/19/24). Let's look that chart now...

So why do I think it's going to drag out into August (possibly September) you ask? Because the weekly chart is still too high and needs more time to reset, so odds are strong that it will keep putting pressure on the market for many more weeks until it reaches a point where it's reset enough and when the daily get oversold enough. Here's that chart...

Support is around the 5500 zone from the sideways chop that started on 6/17 and ended on 7/2 before making that last rally up to the current all time high. I think that's where we are headed into next week and that should be where we start B wave up, which I suspect will drag out for several weeks to frustrate bulls and bears both.

The wild card will be that this pullback (once it ends today or Monday) will complete the move totally and we'll be going up to new higher highs into mid-late August.  That could be the plan as an important date of interest in the future is the September 18th FOMC meeting.  If we do make a higher high in August then of course the ABC down will have NOT started yet.

Instead we'd likely see the A wave down into late August, early Septermber and a strong B wave up starting right after the September 2nd Labor Day weekend.  That move would carry right into the 18th and if we see the Fed do a rate cut (or just say one is coming soon... aka, "tease" the market) we'll then see that C wave down follow.

I would not be surprised to see this wildcard scenario play out as I get the feeling that any rally back up into August, for what could be a B wave, will be shorted heavily and that will force a squeeze to higher highs and kill the B wave completely.  So while I don't know if that's going to play out or not I do lean that way.

Have a great weekend.

ES Morning Update July 17th 2024

0

Inched a little higher yesterday on the ES but not the NQ as it's slowing rolling over, so the ES will follow, but again, it might drag out for several more weeks. There's not a lot to add here as timing the exact top is never easy, but as I said, the month of July is usually bullish, so any pullback this month shouldn't be a lot. It's the second half of August that I'll be expecting some kind of real pullback to occur. Here's a chart of the NQ...

Have a blessed day.

ES Morning Update July 16th 2024

0

We hit the FET of 5713 yesterday and pierced it a few points. Then we pulled back nicely, which has the look and feel of a top of some kind. Maybe we still have on more higher high in early August, I don't know? But this market looks very tired right now. I still don't see some big drop happening but we could have seen the high and will now start a choppy multi-hundred point range the next few weeks.

Something like an A down and B up basically, which again, should be choppy and drawn out in time. July is just not a bearish month, so odds are it will not produce any big move down. But the second half of August is historically bearish so I have to think we won't see anything big until then. As for today I don't have much to added as the technicals on the short term are hard too predict due to the light volume, so I'll just end it here.

Have a blessed day.

ES Morning Update July 15th 2024

0

Last Friday we saw a rally back up to put in a slightly higher high of 5708 on the ES, which I didn't see coming, but again... this market is still super bullish right now so "surprises" are more likely on the upside then downside. But I still think we are less likely to start another multi-hundred up then down.

The market looks tired to me and should pullback some this, which might continue for a few weeks before it trys another push higher in August. Remember, going sideways in a choppy range will reset short term overbought charts in "time" versus a sharp short term drop that resets it in "price". Meaning that this could still go a little higher into August before we see that 8-10% pullback happen.

My short term FET of 5618.39 from the 4963.50 low on 4/18/24 that connects to the 5/22/24 high of 5362.25 (I had a typo of 5368.25 previously, but corrected it) gave a 5608.68 FET (previously 5618), which was basically hit (fell shy a little) with the high of 5588 on 6/20/24.

That was a shorter term FET of course and produced a "pause" as the market went sideways for a couple weeks before going higher. So the FET was accurate for the most part, but since it was a shorter term one it didn't produce much of a pullback, but went sideways instead. If I did another projection from that sideways pullback I'd get an FET of 5824.39, which could be the next target for sometime in August?

However, that's an even smaller time frame FET and it really wasn't much of a pullback at all. So I'd rather look back for a bigger FET as it's likely going to be more powerful. When I look at the 4702 low from 1/5/24. to the 3/31/24 high of 5333.50 I get an FET of 5723.77, which would be a more powerful magnet then the shorter term one at 5824.39, so to me that would be the ideal target in August if we spend the next few weeks chopping around between 5500-5700 I think.

I'm not saying that we can't break that support zone and do the 8-10% drop here in July but usually it's a more bullish month with August being the more bearish one... especially the second half of the month.

Have a blessed day.

s2Member®