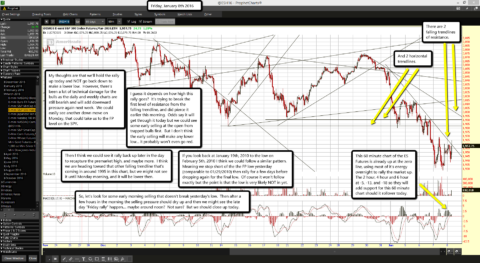
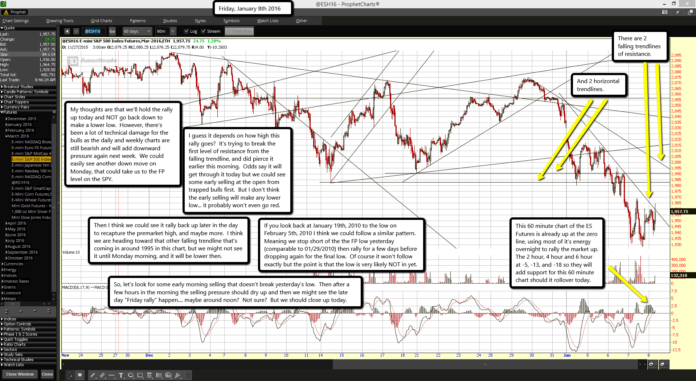
 There are 2 falling trendlines of resistance.
And 2 horizontal trendlines.
This 60 minute chart of the ES Futures is already up at the zero line, using most of it's energy overnight to rally the market up. The 2 hour, 4 hour and 6 hour at -5, -13, and -18 so they will add support for this 60 minute chart should it rollover today.
My thoughts are that we'll hold the rally up today and NOT go back down to make a lower low. However, there's been a lot of technical damage for the bulls as the daily and weekly charts are still bearish and will add downward pressure again next week. We could easily see another down move on Monday, that could take us to the FP level on the SPY.
I guess it depends on how high this rally goes? It's trying to break the first level of resistance from the falling trendline, and did pierce it earlier this morning. Odds say it will get through it today but we could see some early selling at the open from trapped bulls first. But I don't think the early selling will make any lower low... it probably won't even go red.
Then I think we could see it rally back up later in the day to recapture the premarket high, and maybe more. I think we are heading toward that other falling trendline that's coming in around 1995 in this chart, but we might not see it until Monday morning, and it will be lower then.
If you look back at January 19th, 2010 to the low on February 5th, 2010 I think we could follow a similar pattern. Meaning we stop short of the the FP low yesterday (comparable to 01/29/2010) then rally for a few days before dropping again for the final low. Of course it won't follow exactly but the point is that the low is very likely NOT in yet.
So, let's look for some early morning selling that doesn't break yesterday's low. Then after a few hours in the morning the selling pressure should dry up and then we might see the late day "Friday rally" happen.... maybe around noon? Not sure? But we should close up today.


