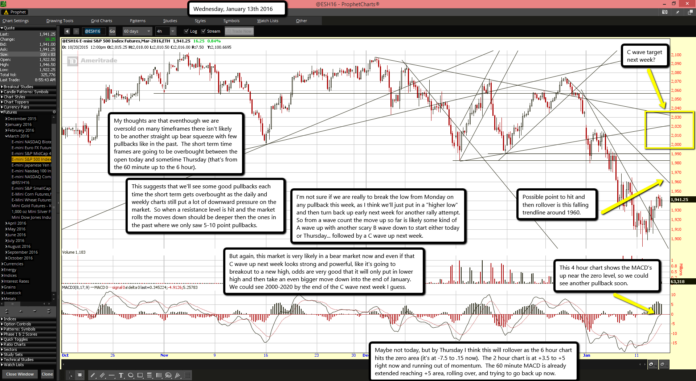
Possible point to hit and then rollover is this falling trendline around 1960.
This 4 hour chart shows the MACD's up near the zero level, so we could see another pullback soon.
Maybe not today, but by Thursday I think this will rollover as the 6 hour chart hits the zero area (it's at -7.5 to .15 now). The 2 hour chart is at +3.5 to +5 right now and running out of momentum. The 60 minute MACD is already extended reaching +5 area, rolling over, and trying to go back up now.
My thoughts are that eventhough we are oversold on many timeframes there isn't likely to be another straight up bear squeeze with few pullbacks like in the past. The short term time frames are going to be overbought between the open today and sometime Thursday (that's from the 60 minute up to the 6 hour).
This suggests that we'll see some good pullbacks each time the short term gets overbought as the daily and weekly charts still put a lot of downward pressure on the market. So when a resistance level is hit and the market rolls the moves down should be deeper then the ones in the past where we only saw 5-10 point pullbacks.
I'm not sure if we are really to break the low from Monday on any pullback this week, as I think we'll just put in a "higher low" and then turn back up early next week for another rally attempt. So from a wave count the move up so far is likely some kind of A wave up with another scary B wave down to start either today or Thursday... followed by a C wave up next week.
But again, this market is very likely in a bear market now and even if that C wave up next week looks strong and powerful, like it's going to breakout to a new high, odds are very good that it will only put in lower high and then take an even bigger move down into the end of January. We could see 2000-2020 by the end of the C wave next week I guess.


