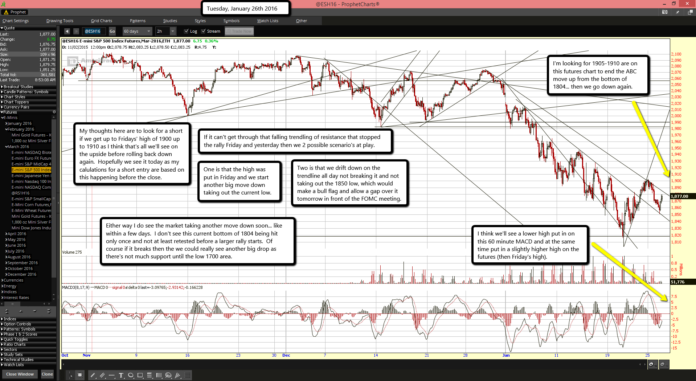
 I'm looking for 1905-1910 are on this futures chart to end the ABC move up from the bottom of 1804... then we go down again.
I think we'll see a lower high put in on this 60 minute MACD and at the same time put in a slightly higher high on the futures (then Friday's high).
My thoughts here are to look for a short if we get up to Fridays' high of 1900 up to 1910 as I think that's all we'll see on the upside before rolling back down again. Hopefully we see it today as my calculations for a short entry are based on this happening before the close.
If it can't get through that falling trendline of resistance that stopped the rally Friday and yesterday then we 2 possible scenario's at play.
One is that the high was put in Friday and we start another big move down taking out the current low.
Two is that we drift down on the trendline all day not breaking it and not taking out the 1850 low, which would make a bull flag and allow a gap over it tomorrow in front of the FOMC meeting.
Either way I do see the market taking another move down soon... like within a few days. I don't see this current bottom of 1804 being hit only once and not at least retested before a larger rally starts. Of course if it breaks then the we could really see another big drop as there's not much support until the low 1700 area.


