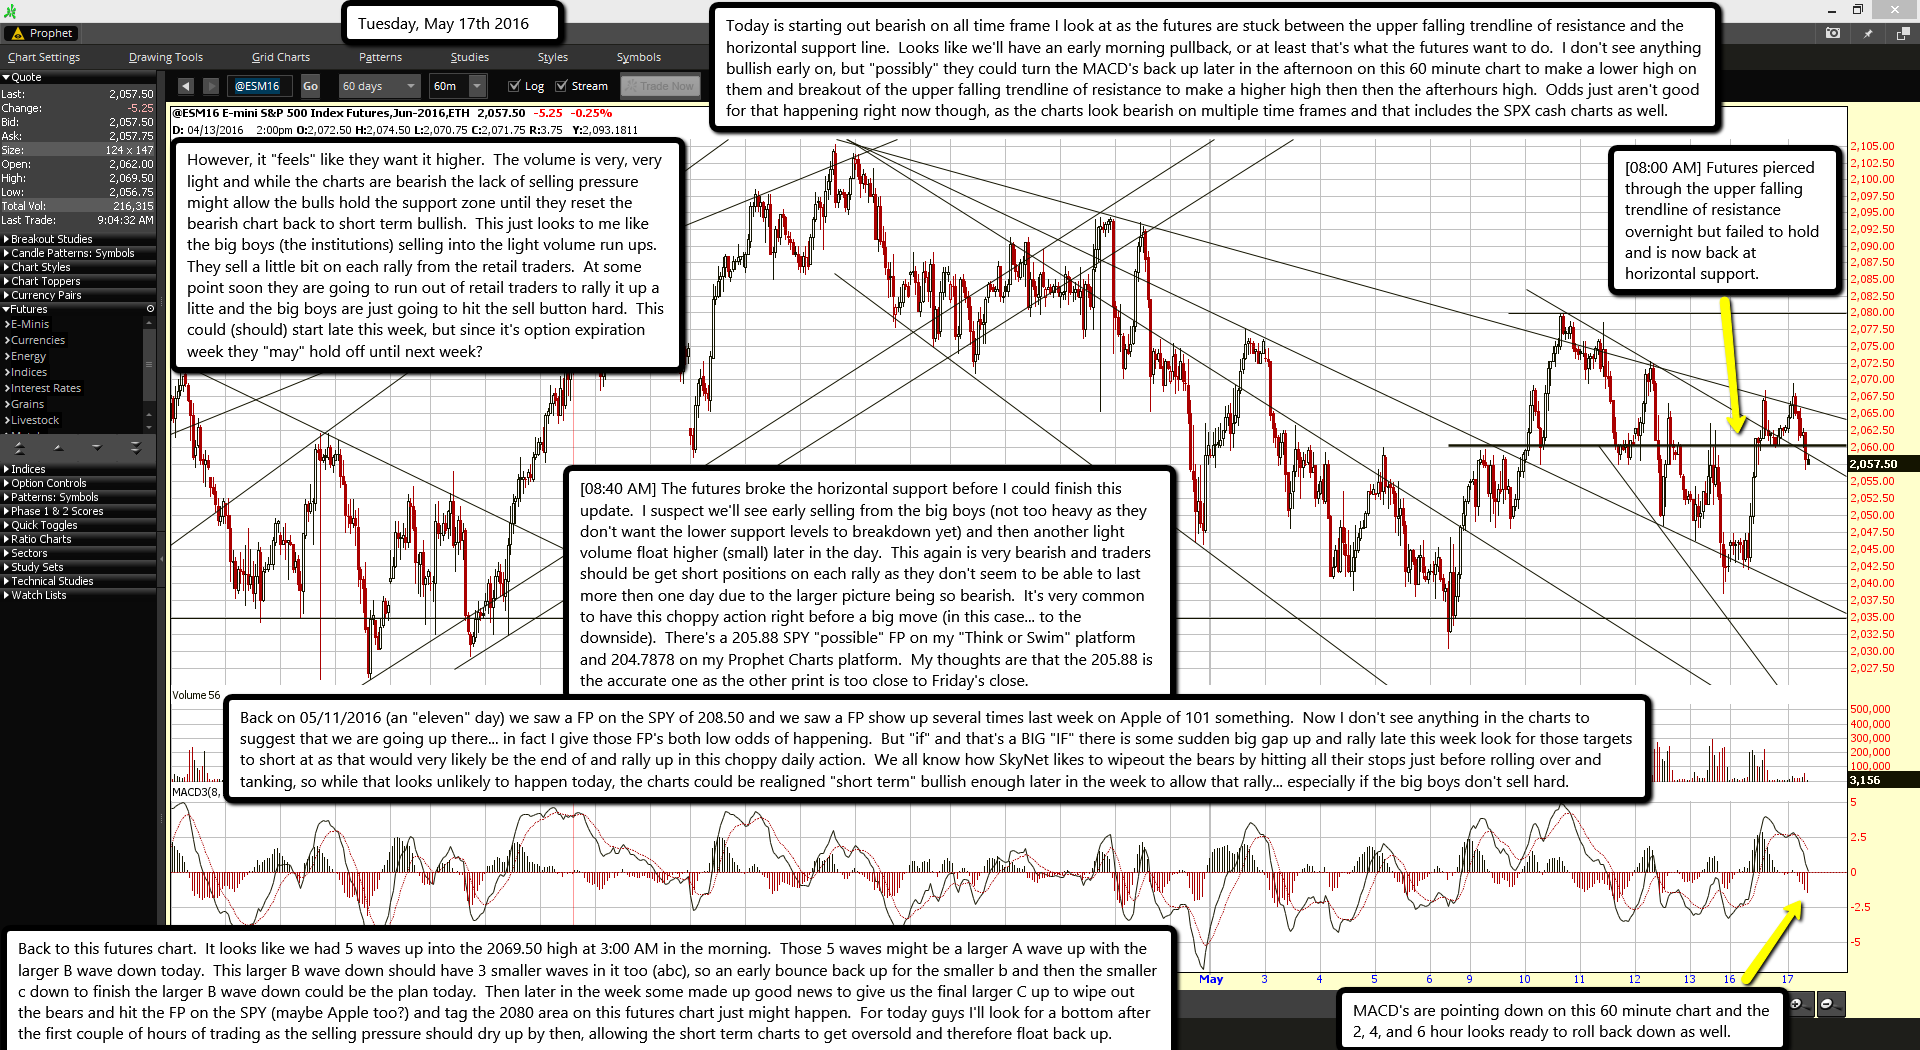
[08:00 AM] Futures pierced through the upper falling trendline of resistance overnight but failed to hold and is now back at horizontal support.
MACD's are pointing down on this 60 minute chart and the 2, 4, and 6 hour looks ready to roll back down as well.
Today is starting out bearish on all time frame I look at as the futures are stuck between the upper falling trendline of resistance and the horizontal support line. Looks like we'll have an early morning pullback, or at least that's what the futures want to do. I don't see anything bullish early on, but "possibly" they could turn the MACD's back up later in the afternoon on this 60 minute chart to make a lower high on them and breakout of the upper falling trendline of resistance to make a higher high then then the afterhours high. Odds just aren't good for that happening right now though, as the charts look bearish on multiple time frames and that includes the SPX cash charts as well.
However, it "feels" like they want it higher. The volume is very, very light and while the charts are bearish the lack of selling pressure might allow the bulls hold the support zone until they reset the bearish chart back to short term bullish. This just looks to me like the big boys (the institutions) selling into the light volume run ups. They sell a little bit on each rally from the retail traders. At some point soon they are going to run out of retail traders to rally it up a litte and the big boys are just going to hit the sell button hard. This could (should) start late this week, but since it's option expiration week they "may" hold off until next week?
[08:40 AM] The futures broke the horizontal support before I could finish this update. I suspect we'll see early selling from the big boys (not too heavy as they don't want the lower support levels to breakdown yet) and then another light volume float higher (small) later in the day. This again is very bearish and traders should be get short positions on each rally as they don't seem to be able to last more then one day due to the larger picture being so bearish. It's very common to have this choppy action right before a big move (in this case... to the downside). There's a 205.88 SPY "possible" FP on my "Think or Swim" platform and 204.7878 on my Prophet Charts platform. My thoughts are that the 205.88 is the accurate one as the other print is too close to Friday's close.
Back on 05/11/2016 (an "eleven" day) we saw a FP on the SPY of 208.50 and we saw a FP show up several times last week on Apple of 101 something. Now I don't see anything in the charts to suggest that we are going up there... in fact I give those FP's both low odds of happening. But "if" and that's a BIG "IF" there is some sudden big gap up and rally late this week look for those targets to short at as that would very likely be the end of and rally up in this choppy daily action. We all know how SkyNet likes to wipeout the bears by hitting all their stops just before rolling over and tanking, so while that looks unlikely to happen today, the charts could be realigned "short term" bullish enough later in the week to allow that rally... especially if the big boys don't sell hard.
Back to this futures chart. It looks like we had 5 waves up into the 2069.50 high at 3:00 AM in the morning. Those 5 waves might be a larger A wave up with the larger B wave down today. This larger B wave down should have 3 smaller waves in it too (abc), so an early bounce back up for the smaller b and then the smaller c down to finish the larger B wave down could be the plan today. Then later in the week some made up good news to give us the final larger C up to wipe out the bears and hit the FP on the SPY (maybe Apple too?) and tag the 2080 area on this futures chart just might happen. For today guys I'll look for a bottom after the first couple of hours of trading as the selling pressure should dry up by then, allowing the short term charts to get oversold and therefore float back up.


