

A big dud yesterday as the CPI did nothing to move the market down. But all the technicals still suggest a pullback is coming prior to the last big rally up to 6000+ into the end of this month early November. When will it happen is the tough question as I thought it would happen last week but it's just dragging out longer then I expected. As far as the wave count, here's an updated chart...
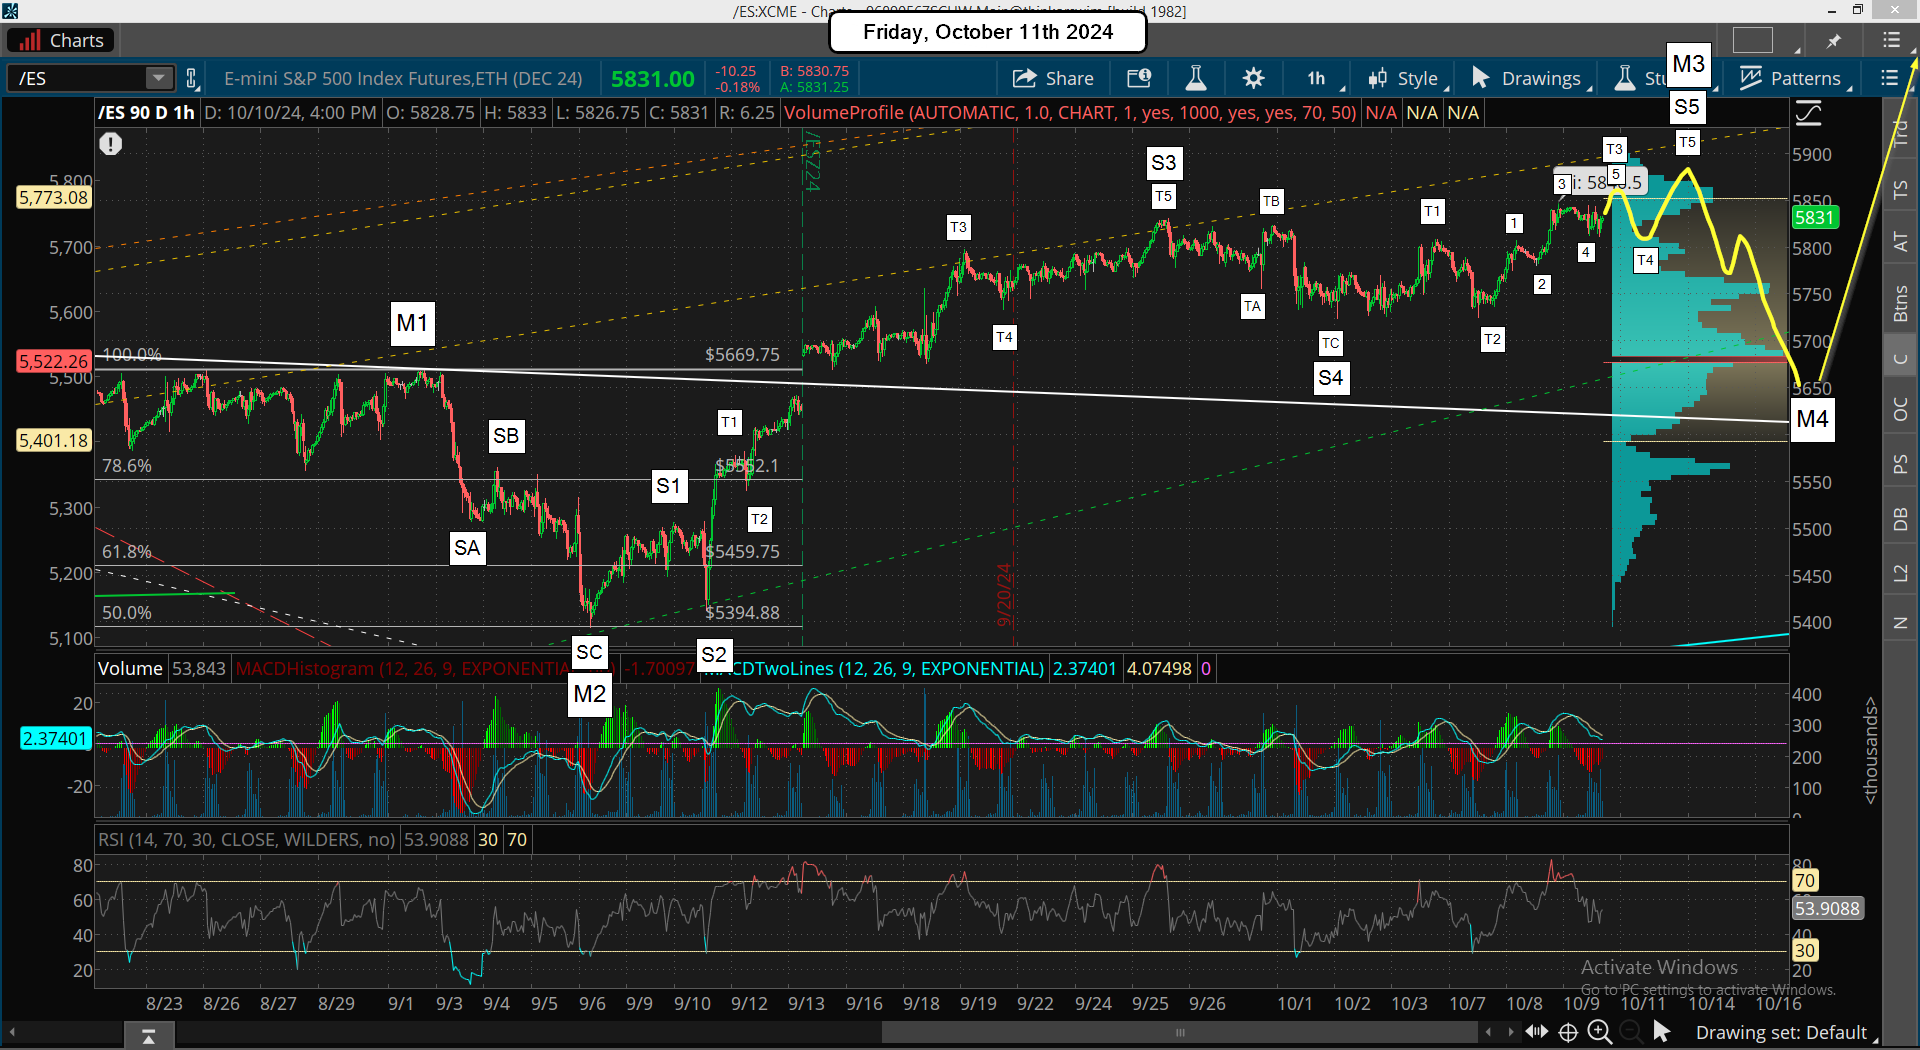
Basically, we are still in Medium Wave 3 up instead of it ending at the prior 5830 high. The choppy sideways action that last week or so could not have been Medium Wave 4 down as it was too small in points, so it was likely just Small Wave 4 down with the 5830 top just being the high for Small Wave 3 up. It means we are in Small Wave 5 up now, which will just complete Medium Wave 3 up. Once finished we'll see Medium Wave 4 play out, which still should be an ABC as it's a larger degree wave and should have smaller waves inside it.
On the short term I think we are inside Tiny Wave 3 up from the 5725 low on 10/7, which was the end of Tiny Wave 2 with Tiny Wave 1 up ending at the 5808 high on 10/6. That means Small Wave 4 down, inside Medium Wave 3 up, ended at the 10/2 low of 5724. If this count is correct we have another higher high coming today or Monday to complete to end Tiny Wave 5, like 5860-5880, which will end Small Wave 5 and Medium Wave 3. Then we should see Medium Wave 4 down happen into the end of next week most likely. After that it's straight up in Medium Wave 5 to 6000+ into the election.
Have a great weekend.


I’m looking for a high on the full moon on the 17th or October 16th. October 16th would be 3 months (90degrees) from the July high. We’ll see how my exhaustion indicators will be in a few days. In wave 5s, they don’t work as well as waves don’t get extended. The Vix remains elevated which is a bearish tell. There were only 20%bears in the most recent AAII poll, probably one of the lowest readings of the year.
The 30 day average for the SP remains above a certain indicator which is not a bullish configuration. A mega rally is going to be needed for it to get above the 30 day. Another indicator has been trending down while the SP rallies which is another red flag.
I’m now thinking we hold up into the election and then drop.