Thursday, October 30, 2025
Home Blog Page 121

Weekend Update…

181

Special SUNday Video Picture Update...

In this weekend update, I decided to put up some video's showing you where I think we are going next week.  (Be sure to enlarge the video picture to see everything). I studied many different charts from several different Technical Analysis experts.  All of them are listed on the blogroll, and I encourage everyone to check out their charts.

I'm simply trying to summarize what I see from looking at their charts, and present it too you in a video format.  Of course I'm going to agree with some of their forecast and disagree with others.  It's up to you to figure out if it makes sense to you.

So let's look at one of my favorite chartists, Ron Walker of The Chart Pattern Trader.  He is quite good, and does daily video's that you all should watch.  I learned a lot about TA's from his video's, and you can too.  I've learned most of what I now know from other people's sites.  I guess that why people put their stuff on the internet... to help teach others.  Anyway, let's look at what I see from his charts...

So, to summarize again what I'm expecting for next week.  I expect to fill the gap around the 1115 spx on Monday or Tuesday.  That's about 112 spy, and it lines up perfectly with this fake print.  Notice that the date is May 20th, and it is "Real Time".  Also notice the large spike in the chart, which had 2,040,896 as the volume (you can't see it now).  It was in the afterhours session of the 20th, and the market was never there during regular hours.

Is this our upside target for Monday or Tuesday?  Could be?  Remember, some of these prints could be just late fills from earlier in the day.  We did trade there on the 19th... but not on the 20th.  So, just keep that target in mind, but focus on the 60 minute chart, as it's the key to whether we continue selling or start a rally back up.  I will be looking closely at the daily chart to see if it appears to be hooking back up during Monday and Tuesday's rally.

If it hooks back up, then there is more likely a big rally coming.  I'll be looking at the 60 minute charts' histogram bars, and the spy and spx actual price.  If the histogram bars start rolling over and falling, but the market starts trading sideways, or just slightly down, that could be a bull flag form, which would mean that the daily chart is providing support to keep the 60 minute chart lifted up.

I believe a move above 1140 spx would be very bullish, and at that point I would re-think the bearish position.  I need to see that daily chart hook back up first, before I'll be going long.  Right now, it's still very bearish.

Let's move on to the 2nd video where I go over Cobra's charts, Shanky, Kenny, Daneric,  and Tony Caldero.  Plus, I mention a new website that a friend mentioned that is calling for a Dow 7070 by the end of next week.  Yeah... that's pretty bearish!  I'm not going to agree or disagree about that bold prediction, but after seeing a 1,000 point drop in 20 minute happen... anything is possible.

Finally, I want to ask a favor of everyone.  Please watch one more video...

You can find the link to help here on this site, as well as on Anna's site.

Thanks in advance everyone...

Red

Tomorrow Was Worst, But For Me…

270

Damage was done today, but not to the market...

When I wrote yesterday that today would likely be the big down day, causing capitulation, I really believed it would happen.  I let my emotions get the best of me on this one, and did a lot of damage by scaring my dear friend.  For that, I am deeply sorry, as I only intended to help.  I was wrong to push my opinion on someone else, even though I had the best intentions at heart.  I guess the best way to help is to say nothing, and just keep your opinions too yourself.

I fear that I may have lost that friend, because of stupidity.  I hope not, and I hope that in time she can forgive me for my actions.  I'm not perfect by any means, and I'm certainly not that great at trading.  I'm too emotional in my trades.  I have learned a lot in the last year about trading, but controlling my emotions will be the hardest thing to master.  In time, I'm sure I will, as I'm flexible and willing to adapt.

On top of hurting a dear friend, I have also lost a value member of this blog, as it seems that the site is getting too much traffic and drawing too much attention.  I wish him well, and thank him for all he has taught me and everyone who listened.  May he return someday, when the timing is near...

Since this is a Friday, and I rarely do posts on Fridays' I don't have any charts or forecasts to go over.  I'll save it all for the Weekend Update report.  I will say that Monday should be an up day.

Good luck to all of you good people, and may the trolls crawl back into their hole.

Red

Tomorrow Will Be Worst…

1,131

Gang,

I will probably do a special video again this weekend, so we can all try to figure out what to do next. Needless to say, once we bottom in the 875-990 area we should all go long. We still have one more high to make this year before we enter into Primary Wave 3.

Our upside target is DIA 118.16 (about Dow 11,800), and we are estimating that to be hit around June 25th, 2010. After that, all hell is going to break loose, as many see us dropping 5,000 points on the Dow before the end of the year.

For all those who believe in God, this will be a time to pray a lot. We have been given the road map over the last 6 months, just as God planned it I'm sure.

I had no idea that I would write this blog a year ago, and that it would change my life and those who follow it. I've always been open minded to learning new things, and I've never trusted the government, but I didn't really know how corrupt they really are... but I do now.

When I first seen the 1047 spx fake print back in January, and then seen it hit the 1044.50 level tagged in February (pierced it a little due to downward momentum), I knew then for sure that the market was controlled and manipulated.

I started to keep my eye open after that, as I was burnt badly on the hard reversal back up from 1044.50, while I was still short. I learned my lesson on that one, and now I pay very close attention to those fake prints, as they are the road map to what lies ahead.

God must have decided to use my skills at building websites (as well as entertaining you with my daily posts, as I'm not really that good of a trader) to warn everyone who would listen, of the coming disaster that lies ahead. He even pointed me some help by allowing Sundancer to find my website and to offer his knowledge of the game, to help others.  I doubt if Sundancer knew either, how much help he would be doing when he found my website, and decided to become a regular poster on it.

Many people have learned a lot now, and are hopefully more prepared for what lies ahead.  While I really don't like all this doom and gloom, it seems too have found me, and wants me to inform people about it.  I would love for it to not happen, and the forecast be wrong, but the charts tell me otherwise.

When the final top is in, I expect to see the moving averages on the monthly and weekly chart come really close together.  The monthly will lag the market when it crosses over, but the weekly should almost be touching by the time we hit the high in the market.  Unfortunately, I can't stop it from happening.  I really wish I could, as I don't want to see so many people hurt from the collapse.  The only thing I can do is to warn everyone in advance, so that they can prepare for what's coming.

Anyway, enough doom and gloom for now, as it's making me depressed, even while I'm making money on the fall.  For tomorrow, everyone should have their triggers placed in case your brokerage firm goes down during the crash.  I can't advise you what to buy, but you can look at Monica's comment on the previous post for a general idea on how to position yourself.

Best of luck to everyone tomorrow...

Red

Still Holding On…

215

The market had every chance to crash today, but it didn't...

Even though the market did sell off hard, it recovered a lot of the early losses by the end of the day.  It seems that the bears needed a breather before they can push it down again.  However, for tomorrow, it's going to be a tough call as to which direction I see the market going.

On one hand, we are pretty oversold on multiple charts... and it's option expiration this Friday.  The open interest on the put side is huge right now.  That wants to make me believe that they will gap it open tomorrow, to get above that downward sloping trendline, (that I have on the charts from yesterday's post).  That's about the only way I see them getting above the trendline, and rallying higher.

But the other part of me says that the charts are still pointing down.  The daily isn't showing any signs of turning back up yet.  The 60 minute chart is trying to turn back up, and the 15 is a little overbought now.  I just don't know how to read it?  So this post is going to be short.

If we gap open and run higher, the correction could be over for this week.  It doesn't mean it's done for good, but a rally until opx is over with this week, and then more selling next week is possible.  If we open flat, then I think we will continue selling off more.  So for now, I'm not sure about exactly what will happen tomorrow, so I not going to make a forecast.

However, I'm still bearish because of the daily chart.  It still tells me that there is more downside coming tomorrow, and Friday.  Plus the week chart also is still bearish, and I think we will go lower then where we currently are.  That's it for now.  That yellow downward sloping trendline is still intact for now, so not much has changed my opinion on the bearishness still in the market.

Best of luck to both bulls and bears... may we both get out at the ideal position.

Red

Stock Market Crash Tomorrow?

292

Odds are extremely high for a stock market crash now.  Could we have a Black Wednesday on May 19th, 2010?

I don't know of course, but we now have 4 out of 5 charts pointing down.  The only chart that isn't, is the 15 minute chart, which could give any trapped bulls a small pop in the morning to exit their longs, and get short.  I've called for a Black Monday 3 times in the past and been wrong on all three.

When I look back at the charts on those calls, I find that I didn't have them all lined up in the same direction... DOWN.  Which is probably why my calls weren't correct.  But, as each day passes, I learn more and more about how this game works.  Not that I'm an expert by any means, but it's becoming clearer too me now, as to how to tie all the different charting techniques together.

Let's look at the charts now, and see what they tell us.  I'm going to skip the monthly as nothing has changed since I last posted it.  You can look at it again by clicking here.  You will notice that it is from April 30th, 2010... and you can see where it's at now by going to Shanky's Charts by clicking here.

You will notice the red bar now in May, and if you try to find the 1260-1280 area on the now broken rising trendline, it looks like it could come in on the July candle, as I believe that the June candle would put it at about 1240 area (look to the right where you see 1240.03... that lines up with a backtest of the broken trendline on this monthly chart.

Of course there's nothing saying that it can't go back inside that trendline in June, and then fall back out into Primary Wave 3 (P3) in July.  Remember the fake print we have of DIA 118.16 (about DOW 11,816 or 1260-1280 spx), and the date of June 25th on the Wilshire 5000 chart I showed in my "Great Depression Two" video (now a separate page, so you can go watch it if you didn't see it the first time I did it).

I was wrong then calling this past Monday a "Black Monday" as I stated in the video, but so far... everything else is still lining up with the projected forecast.  The chart are now supporting a very large move down tomorrow, and that is what I stated in the video.  However, I now have reason to believe we will go much further down then "just below 105.00" as I stated in the video.  I'm looking for 980-990 now, before the rally back into June/July happens.

OK, moving on...

Let's look at the weekly chart now.  I'm just going to put a link to it here, as it's playing out like we expected it too.  Here is a link to a post from May the 2nd, 2010... and here's a direct link to the chart only.  As you can see, we are still headed down.  The Moving Averages haven't crossed over each other yet, but I think they will by July.  When they do... P3 is here!  But for now, I think they will move closer together over the coming month, trending sideways, and finally cross when the market rolls over in late June, early July.

Next up, the Daily chart...

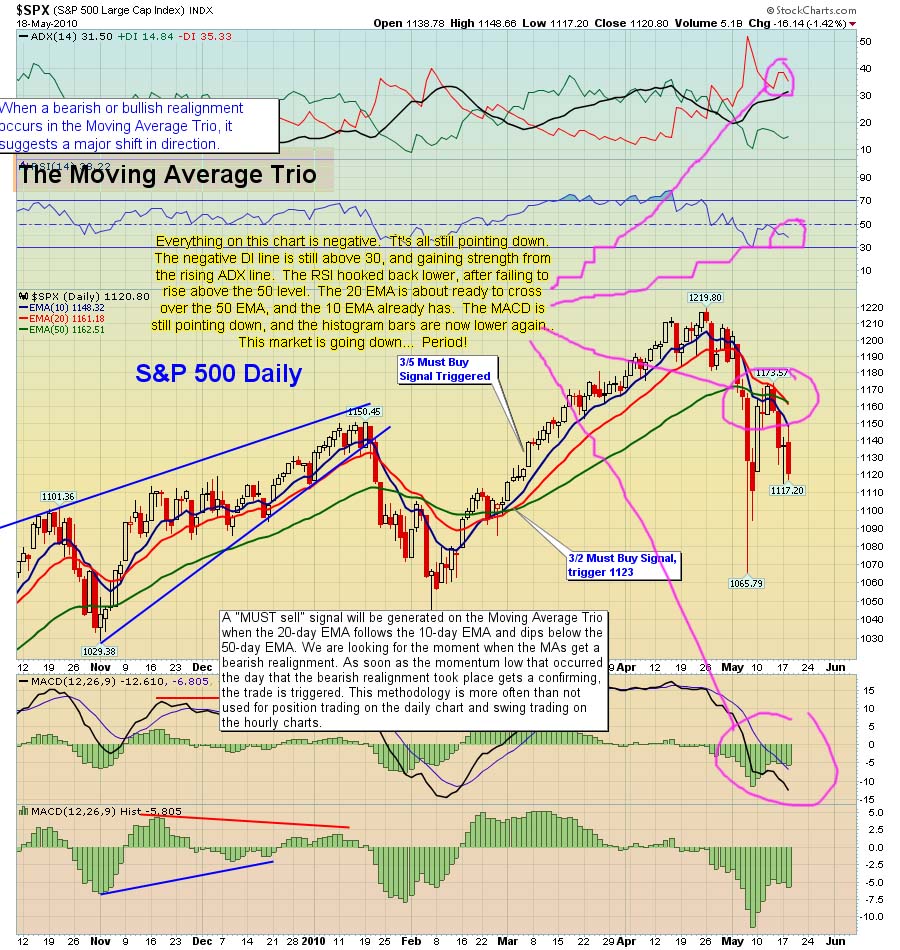
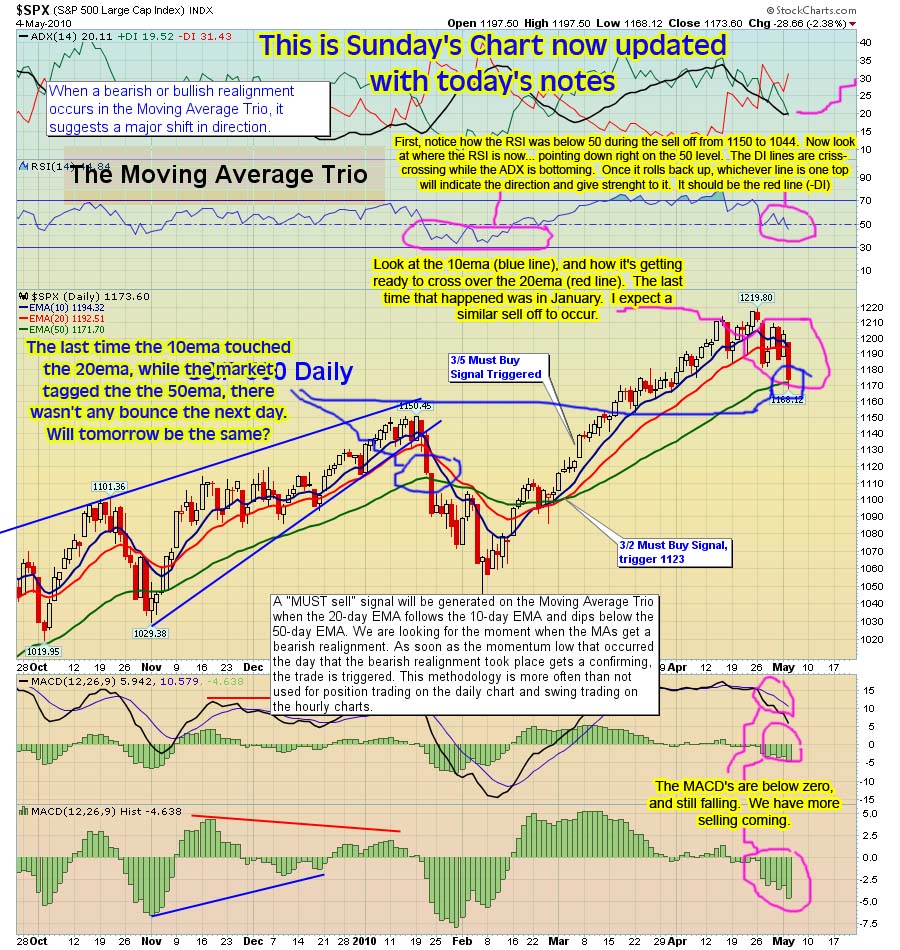
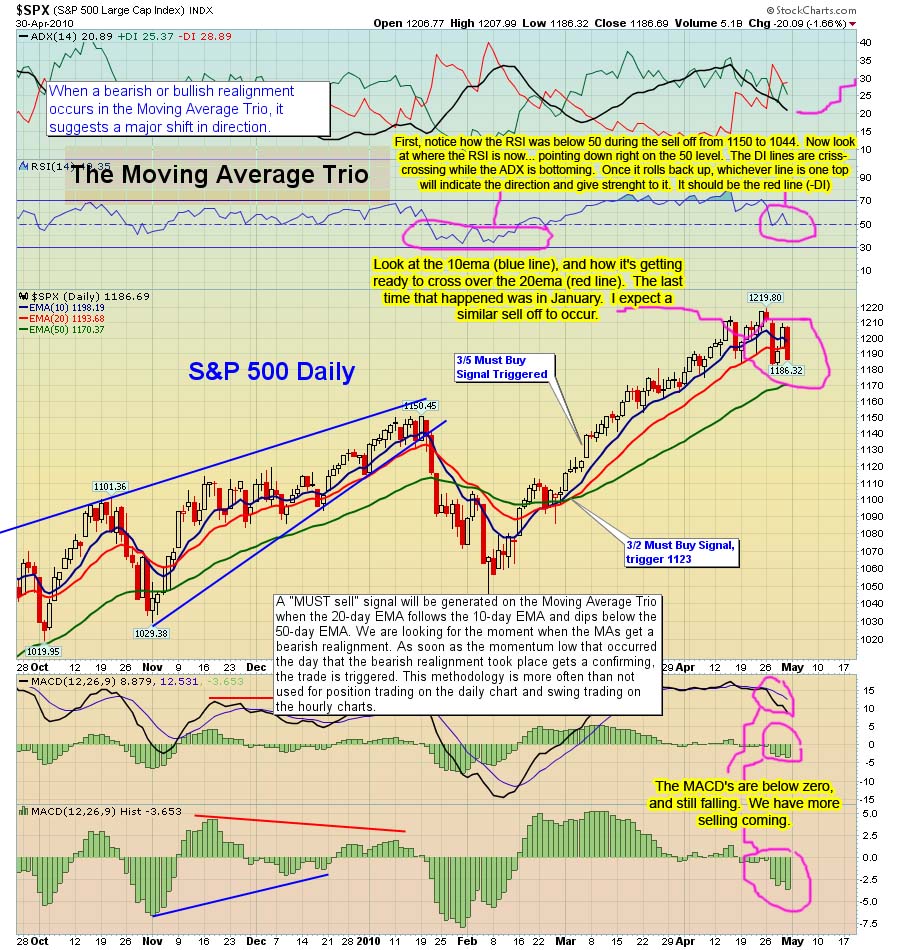
Well first off, you can clearly see now that the 20 EMA (red line) is touching the 50 EMA (green line).  It's pointing down and should cross over the 50 EMA tomorrow.  Notice also that the MACD lines are still pointing down too, and the histogram bars are now getting deeper again.  The negative DI line (in Red, at the top) are still above 30, while the positive DI line (in Green) is below 20.  The ADX line (the Black line in the middle) is rising, which strengthens whichever DI line is on top... in this case, the Negative one.  The RSI is still below 50, giving strength to the bears.  This chart is still very bearish, and I definitely see more downside coming.

Now the 60 minute chart...

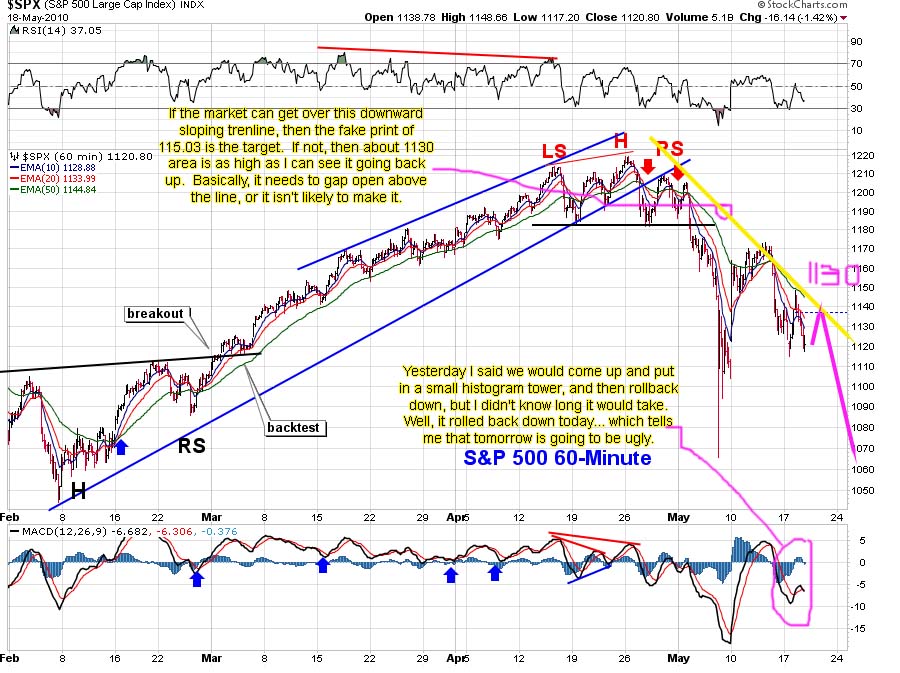
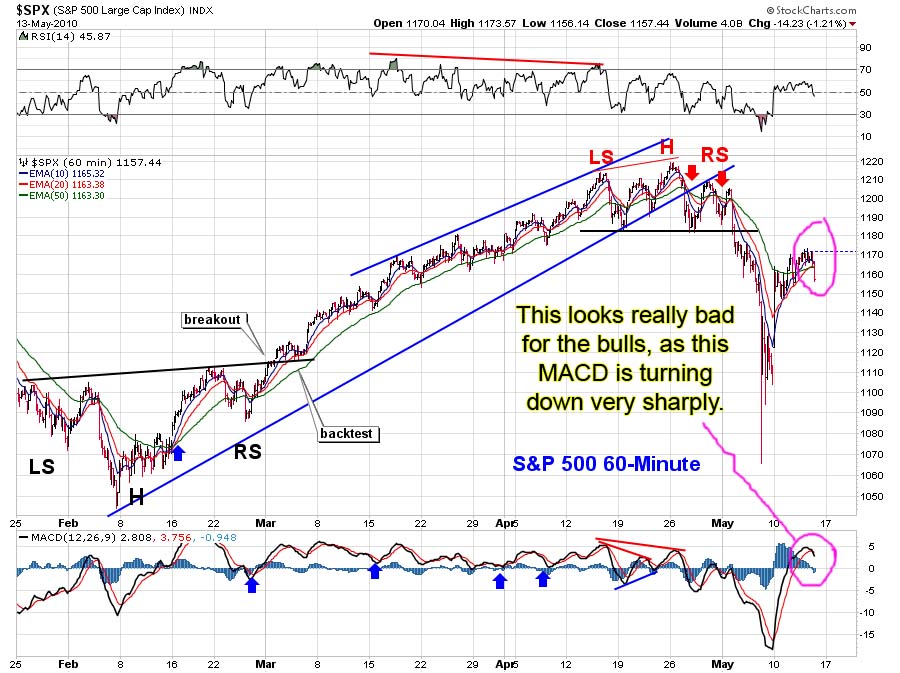
Notice how the MACD lines were pointed up this morning during the brief rally, but have now turned back down again.  The histogram bars rose up above the zero line, and quickly put in a much smaller tower, and are now ready to go back below zero tomorrow.  The RSI line (top chart) rallied up to the 50 line in the morning, and was quickly rejected and is now pointing back down, giving strength again to the bears.

Also notice that the market tagged the downward sloping trendline around 1150 and was rejected again.  The market is headed down, and it's most likely going to be a wave 3 of 3, in Elliottwave terms.

Finally, the 15 minute chart...

This is the only chart that could give the bulls some hope, but it will be short lived if it does.  I could possibly see a small early morning rally back up to the 1130 area, where the downward sloping trendline will be at tomorrow.  This is the last stop for the bulls to get off the train, as the tracks dead end at the edge of the Grand Canyon.  As you can see by the rising histogram bars, this could rally the market a little while it goes into positive territory and puts in a small tower, before rolling over to the downside again.

Once all 5 charts are pointing down... all hell is going to break loose next!  This could line up perfect with the time that the Senate votes on the Financial Reform Bill, when they stage a huge protest march in Greece, and when Germany bans short sellers.  Talk about a triple whammy!  All those events together, along with what the charts tell me spell one word... Crash!

Maybe I'm little too crazy for some of you too believe, and yes I've made some stupid calls and predictions in the past.  But, I was still learning the rules of this game back then during those calls.  Since then, I've learned to get a better view of the whole picture.  I could be dead wrong on this, and I wouldn't dare give you trading recommendations to go buy a certain etf or stock.  But, if you are long, I highly suggest you think twice about going to cash, and get out tomorrow when you can.

Red

P.S.  This was a late day post by Diablos who caught this fake print, showing 115.03 spy.  I don't know if it plays out tomorrow or if that's a sign for where they plan to close it on Friday, which makes more sense, because of the huge amount of open interest on the puts at that 115 level.

Keep this target in mind tomorrow, as if the market can break above the downward sloping trendline around 113 spy, then this fake print should be hit on Wednesday... not Friday.  No way to be certain of course, but a gap open above the downward sloping trendline would then make this target highly likely.

But at this point, from looking at the overnight futures, I don't think this print will play out tomorrow, but will play out at in a future unknown date.  Could it play out this Friday where all the put open interest is, or will the market makers not be able to rally it back up to that level by then?  I don't know of course, but my gut tells me that they are the buyers of a lot of those put contracts, and want a market crash to make money from them.

Sometimes they like to fool you, and not close it where you expect them too.  I know that many times in the past, I seen a target level that was extremely loaded up with calls at that level, and I thought for sure that they would pin the SPY at level, to avoid paying out those call holders... only to see the market blow up past that level and close higher on option expiration.  So for now, let's just put it in our little bag of tricks and look for a future date. Thanks Diablos

P.S.S.  The futures are down 10 points as I finish this post.  It's not looking good for one more backtest of that trendline around 1130 tomorrow.  We'll see... anything can happen.

Big Reversal Squeezed The Bears…

160

Bearish Monday... no wait, Bullish Monday!  Let's settle this the old fashion way...

Today started out great for the bears, until about noon when the market found a bottom and reversed hard into the close, end up with a positive day, instead of a big sell off day. Funny thing was, I spotted another fake print on the ES futures at 1135.25, early in the morning, just when the market was starting to sell off.

The fake print only lasted 60 seconds or less, and then disappeared (which correlates to 1138.31 spx). After sell off to a low of 1112.75 (ES futures), I never dreamed we would rally back up to 1135.25 on the same day. Maybe the next day, but not on such a big sell off from the morning open of 1140 down to 1115... that's a 25 point drop!

Sheesh... I have to give to "them", as they had me fooled on that one. Even when I seen the bottoming tail around noon, I thought we would only go up a little bit, and then sell back off into the close. I think the toughest part is figuring out which fake prints will play out... and when?

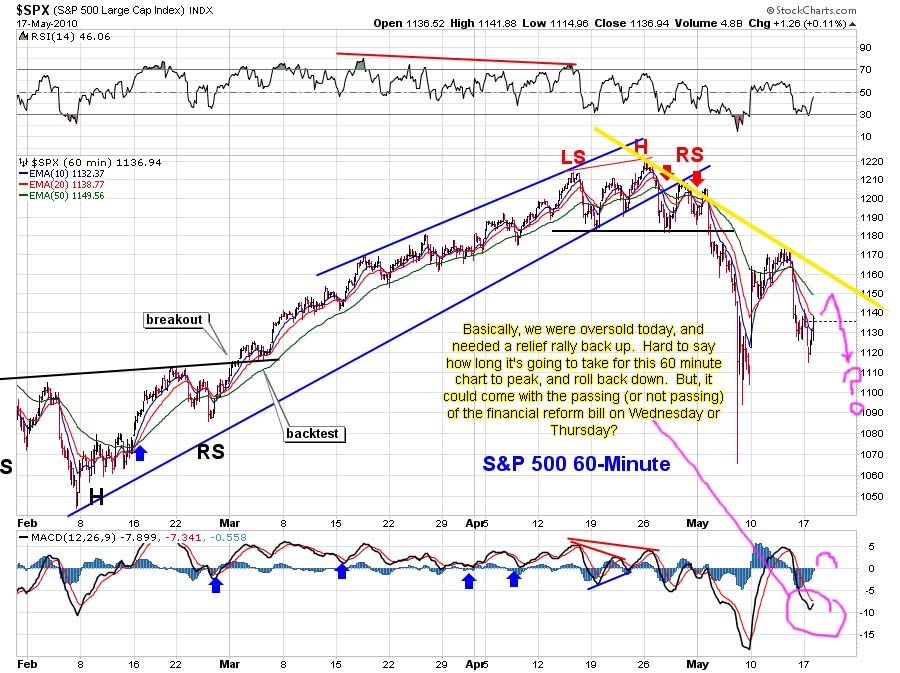
Anyway, as you can clearly see by this 60 minute chart, the market turned back up and is likely to go higher tomorrow until the 60 minute chart rolls back over to the downside again. This could last 2-3 days, if they really want to squeeze out the bears more.

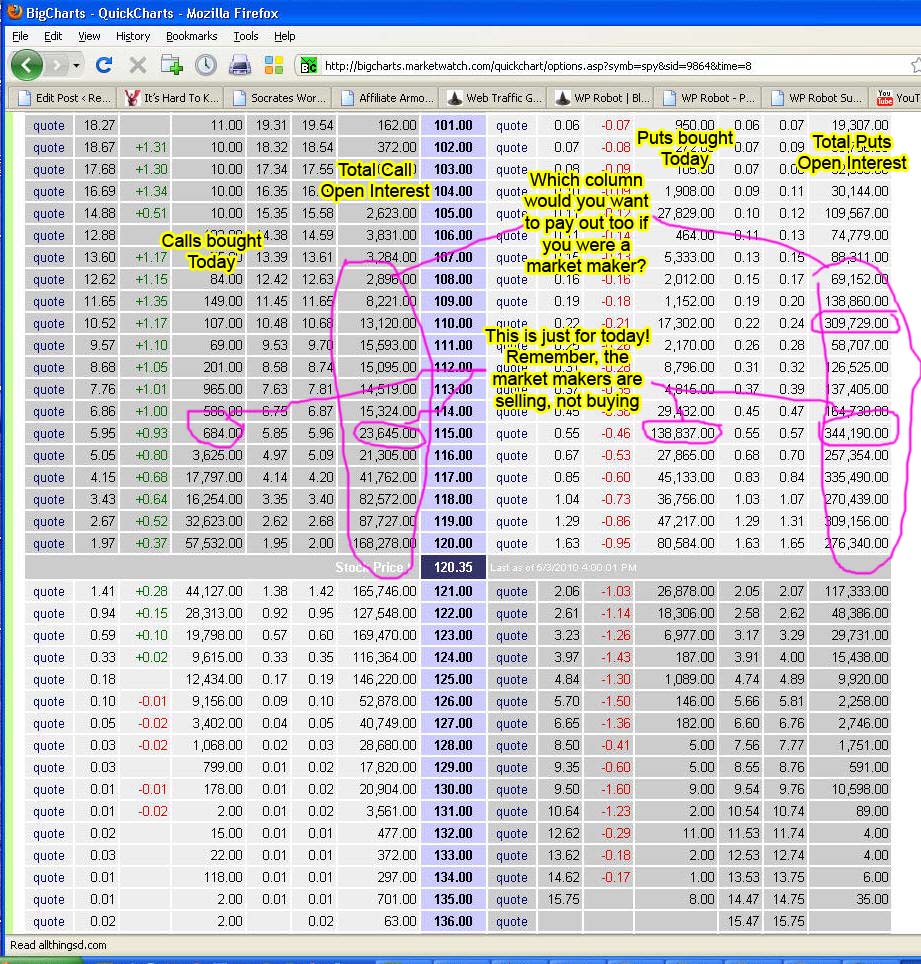
This week is opx week, and it is true that they like to pin the spy on a level that allows them to pay out the least about of money to both put holders and call holders. Unfortunately, the market is heavily loaded up on puts right now.

The ideal place to close this market is 115 spy, as that level has a huge amount of put open interest on it. Of course that doesn't mean that we can't sell off hard again, and rally back up on Friday. I think that should be obvious to everyone now, as the market sold off 25 point today, and rallied back over 20 points of the decline.

Believe me, after seeing what happened last Thursday when the Dow dropped a 1,000 points, and recovered almost half of it in one day... anything can happen. But for tomorrow, the 60 minute chart should push us higher some. How far is any one's guess, as the daily and weekly charts are still pointing down, and should limit the upside some.

There is really no way to tell how high the MACD will rise on the 60 minute chart, before turning back down to the downside again? It could only rally up in the morning, and put in a much smaller histogram tower, and turn back down in the afternoon. Or, it could put in a huge histogram tower, taking 1-2 days to form.

It's probably going to depend on what the dollar, euro, oil, and gold do too... they are a key part of the markets' rally's, and sell offs.

On another note, looking for clues and reasons to cause a sell off to happen this week, the Senate is scheduled to vote on financial reform for the banks on this Wednesday or Thursday. If the bill is pasted, (and again here folks, this bill really won't hurt the banks. It's full of loop holes, and is all about politics and get re-elected), that "might" spook the market and cause another panic sell off.

I'm just reaching out here, as it's probably already factored into the market, or "they" already know the outcome. But again, the banks could dump the market again, blame it on the bill, and get reloaded with new long positions on the drop, by taking out everyone's stops out on the way down... just like they did last Thursday.

They already used the "fat finger" excuse last week, so they need a new one for this week. A financial reform bill, that would limit their profits (at least on paper, it would look that way), could be as good a reason as any to dump the market one more time.

So for tomorrow, I expect some upside until the 60 minute rolls over. If the gets too far back above 1150 spx, then I think the sell off might be over. However, I don't think it will, as I still believe there is more selling coming. I still don't see any signs yet of the daily chart making a turn back up, from a technical stand point. However, from a "candle pattern" point of view, today was extremely bullish.

A hard reversal from oversold territory to end up with a doji candle is something to be taking into consideration. I'd just like to see the candle form at a lower low then the 1065.79 low last Thursday, before I'm convinced that the "bottom" is in. Those candles work extremely well at tops and bottoms of markets.

But we haven't taken out last weeks' low yet, and that still makes me think that the candle is just a bullish candle, but not necessarily a "bullish reversal" candle. There will probably be some continued follow through on the rally tomorrow, and then possible another sell off by Thursday or so... with the blame to be put on the passing of the bill.

All speculation at this point, but it's just what I see in the charts that has me coming to these conclusions. Best of luck to both bulls and bears tomorrow.

Red

P.S.  One more thing... by not having my charting software set to show the last 10 days (as I had it set for 3 days, 10 minute candles), I didn't notice that the 111.77 spy low was almost gap fill from the 111.30 low last Friday.  Had I noticed that, and listened to my instincts, (seeing that fake print earlier in the morning today, about 114 even on the spy), I would have closed up my shorts and waited for this rally back up to get back in at a better price.  But, I missed it... so I'm still short.  Bummer 🙁

Weekend Update – Armageddon?

1,842

Post Number 199... Yes,it really is my one hundredth, and ninety ninth post since starting this blog last year.  (However, I think I'll skip the 666  and 999 post... just too be safe - LOL)

I can't find a single reason to be bullish next week, from any technical point of view.  The only thing I can see positive... is that the typical option's expiration week is usually bullish, but past history doesn't always play out the same in the future. The charts are still very bearish right now, and I think that will overshadow the past history results for a bullish opx week.

With that being said, I don't necessarily think that we will crash on Monday.  We could rally up a little on Monday, and create a smaller wave 2 up, inside of a larger 3 wave down (some call it a 5th wave?).  And then plunge down on Tuesday with a smaller wave 3 inside a larger wave 3, which is what I think will happen.

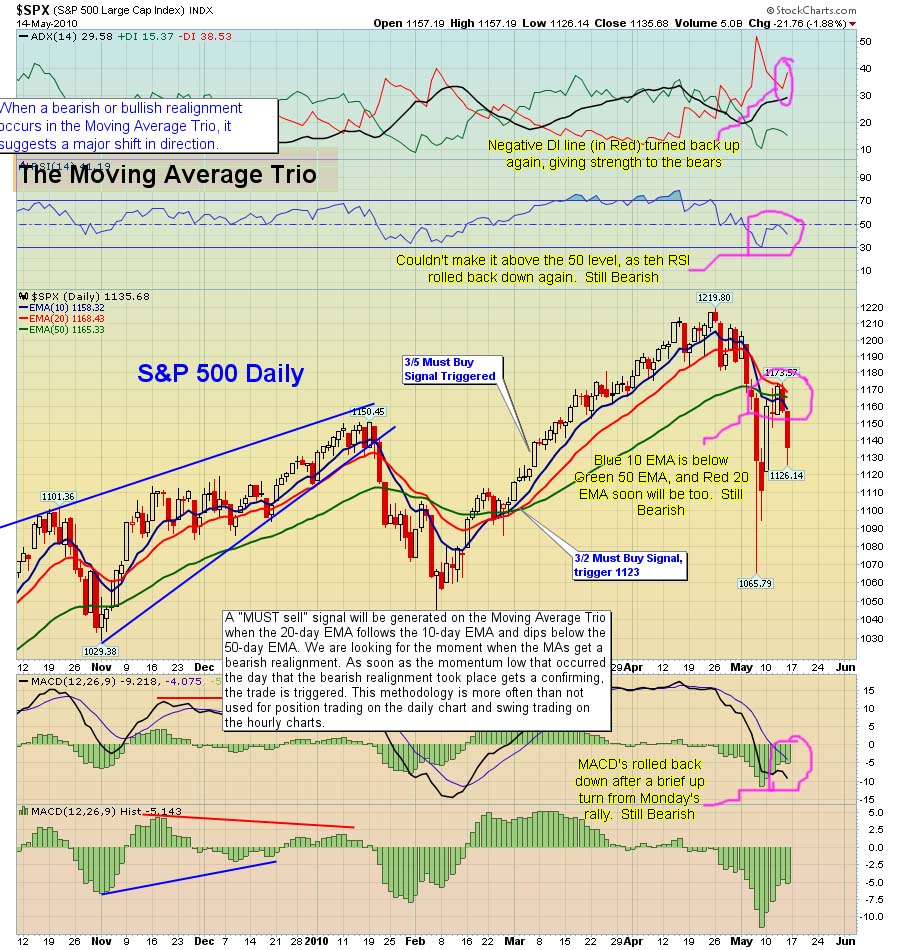
We are still pointing down on the daily chart, which will continue to put overhead pressure on the 60 minute and 15 minute charts.  Looking at the chart below, you will notice that the MACD lines rolled back down, after briefly pointing up on Monday's rally.  The 10 EMA is still below the 50 EMA, and the 20 EMA isn't too far away from crossing over it too.  The histogram bars are still in negative territory too.

The RSI is still below the 50 level, which means that the bears are still in control.  Plus, the ADX line is now rising again, with the negative DI line (in Red) hooking back up now.  More downside is coming next week... how far is anyone's guess?

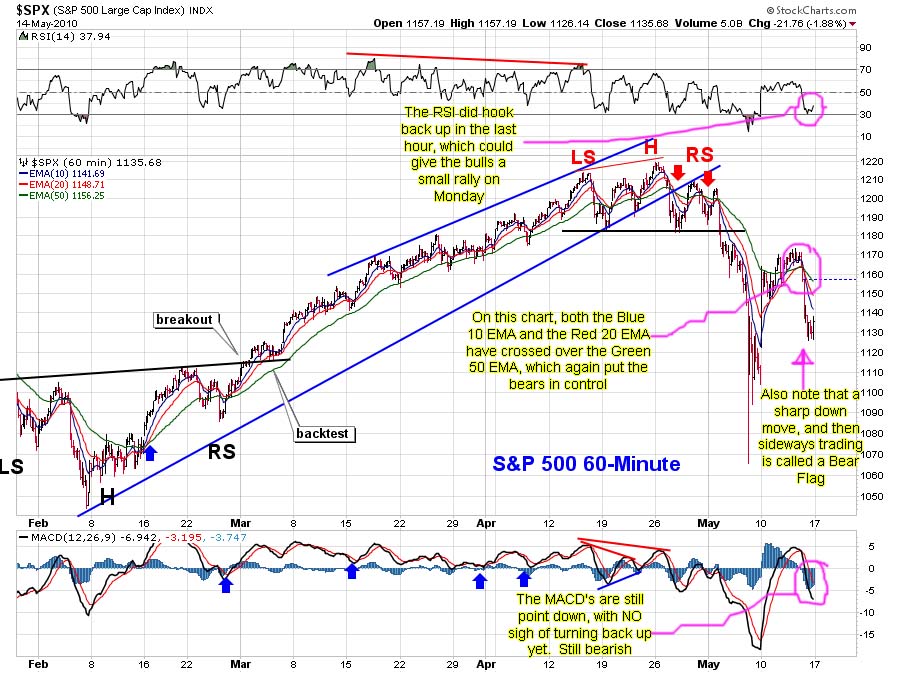
Let's look at the 60 minute chart now.  It's has both the 10 EMA and the 20 EMA now below the 50 EMA, which again puts the bears in control.  The RSI is still well below 50, but did hook back up at the close Friday.  This could give the market the smaller wave 2 up on Monday.  However, I don't think it will get back above the 50 level with the daily chart still pointing down.

Look at the MACD on the 60 minute chart too, as it's still pointing down, and hasn't hooked back up yet.  It did put in a lower histogram bar during that last hour that the market rallied a little on.  But again, with the daily chart putting downward pressure on it, I don't think it will make it back up to the zero level on Monday.  Maybe it will put in lower histogram bars, but fail to crossover into positive territory.

Now let's look at the 15 minute chart and try to forecast what will happen on Monday.  First off, the early sell off, and then sideways movement, forms a perfect "bear flag" pattern.  Not that they all play out, but if this one does, then an early morning sell off (possible gap down open) could happen.  Notice that the MACD has successfully rallied back up above the zero level, and into positive territory.  There is no way of knowing how high it will form it's histogram bars, before rolling back down, but if you match it up with the RSI above... I'd say it's pretty close too topped.

Looking at the RSI, you will notice it rising back up toward the 50 level.  If it can get above it, and push up toward 70, then the histogram bars on the MACD could continue to rise, and the market would too.  The ADX line is rolling back down, and so is the negative DI line (in Red).  The positive DI line (in Green) is rising, giving strength to the bulls.  But remember, this is only the 15 minute chart, at it still has a ton of overhead pressure above, with the 60 minute chart, daily chart, and weekly chart pushing down on top of it.

I think the best scenario a bull could hope for on Monday, is that the 15 minute chart rises back up and forms a smaller wave 2 retracement rally... allowing them to get out of their positions, before it rolls over into smaller wave 3 inside larger wave 3 (or 5?).

Baring that there isn't any negative news about another country (or state... aka California) going into default, then maybe there will be a smaller wave 2 up on Monday?  However, it could have already completed itself on the late day rally (mainly short covering), which in that case... the bear flag pattern will play out, with a possible gap down on Monday.

After this correction is done, I think we will go back up for one final high.  The monthly chart looks almost topped now.  It should roll over in 1-2 months, and then P3 down would be started.  But, for now, we are close to putting in a bottom for this current down turn.  I would estimate that next week (or the following week, at the latest) will put in the bottom for this sell off, and the following week will start a big rally back up again.

So for Monday, it's either going to be a gap down from some negative news, or we rally up a little bit while we continue to form that smaller wave 2 retracement.  Either way, Tuesday and Wednesday will look horrible for the bulls, as a wave 3 of a wave 3 down will occur.  It's going to be Bloody...

Red

The Perfect Storm Is Just Ahead…

292

No Post For Friday Gang, as I'm a Happy Bear Now, and looking forward for more fun next week.  I'll have the weekend post up by late Sunday Night.  Go Enjoy The Weekend

And Friday Could Be The Start Of  It...

From a technical point of view, a lot of damage was done today for the bulls.  That late day sell off broke the rising bearish wedge on the 15 minute chart, as well as forcing the 60 minute chart to rollover and start pointing down.  On the daily chart, the necktie did hold the market back and reject it hard.

Then there is the dollar (UUP), that had a huge buy candle appear in the last 10 minutes of the day, forcing a big move up in the dollar.  This tell me it was "insiders" that know something is ready to happen.  It was between 3:40 pm and 3:50 pm, and had 1.5 million shares bought up.  Compared to the entire day, which only had about 4 million shares traded... that candle is HUGE!

Remember last week when Sundancer mentioned that he got an email from a friend at the Chicago Board of Options Exchange, telling him that a big buyer came in and purchased a ton of VIX Calls.  Then what happened next?  Thursday crashed, and the VIX soared.

That large buy of the dollar, of 1.5 million shares, tells me that the dollar is getting ready to explode higher.  That is very unusual volume for the dollar.  Something is brewing, and it's not going to be good for the market.  Let's think about this from "outside the box" for a moment.

What event could cause a big move up in the dollar?  Or maybe I should ask the opposite... what event could cause the Euro to tank, which would cause the dollar to soar higher?  Could the rumor that Germany is going abandon the Euro, and go back to their own currency be true?

The article is up on Zero Hedge, and the link was posted yesterday by StockTech (thanks for the link).  According to the article, German chancellor Angela Merkel is scheduled to give a speech to the nation on Friday evening, where she could announce a currency change from the Euro back to the Mark.

I don't know what is going to happen of course, but I find it odd that she is waiting until the market is closed, on a Friday evening.  Believe me, if the news was something that would be bullish for the market, it would have been released during the market hours.

Everything is planned and timed to be released when it benefits them the most.  The German crooks are no different then the American crooks.  Remember, about 200 families control 70% of the worlds' wealth, and they are all part of the "good ol' boy club"... meaning that they get together and plan out future events that will benefit them the most.

The leaders of all the countries are just the puppets that are in the public eye.  The real people who control each country is the multi-billionaires behind the scenes.  These aren't some conspiracy theories that I'm making up... these people really DO control the planet, and especially the market.

You know that too be true, if you have been reading my posts long enough too see all these fake prints play out.  Maybe not every one of them, but you have to admit that it's really strange how those intraday prints are hit within a day or two.

Of course, finding out what they plan too do next isn't always that easy, but we are given many clues.  Like the big dollar buy today in the last 10 minutes.  And, the fact that Gold is going threw the roof.  Let's not forget that Oil is still getting hammered.  These are all big clues, that tell me that we have another sell off coming before another rally into mid-summer can occur.

So, from what I can see... Friday, and next week is looking like some big selling is still coming.  Could Friday be "Black Friday"?  I don't know, and I don't want to call it that... as I might jinks it.  So, I'll just say that I expect a down day tomorrow... how far down, I won't guess at.

Red

Evicted Bears…

548

Are there any more bears left, or did they all get evicted today?

It seems there's never a dull moment in the markets, as you watched today's tape destroy the bears' dreams.  I'm glad I wasn't around for the bear beaten' today, but instead I had to actually go work.  Yes, I do work... from time to time.  Today started off too be a great day... until my car broke down, an hour from home.

Arrrrggggh!  So, I waited an hour for a tow truck, and then another hour to get back home.  Not a good day for me.  When I finally get back to the computer, I see the market squeeze more bears out, and everyone freaking out (myself including... well, just a little bit).

But gang, we all knew that the market could go up to around 1180 spx (and still can), then backtest the broken support line... we just didn't believe it could really do it!  That is what shocked all the bears, as the 1,000 point drop was so bearish for the market, that everyone was only looking for a small bounce back up, and then another crash.

I include myself in that category, as I really thought the market was done yesterday.  But, we should all know by now, that it's extremely hard to kill a bull.  If you look at this move back up using Fibonacci percentages, then we are now at about the 61.8% level, with the possibility of the move continuing to the 78.6% level around 1180 spx.  So, in the grand scheme of things, this is a typical move back up.

Let's also look at it from an Elliottwave point of view.  The first 2 day sell off, from the 1220 high, to the 1180 low... would be wave 1 down.  Then the next 2 days up were wave 2, and the move down to the 105.00 spy low... was wave 3 down.  Now we are on wave 4 up, with wave 5 down coming next.

Will it happen tomorrow?  I don't know?  We could have another up day, to tag the 1180 broken support level first.  The sideways chop fest that we have had for the last 3 days could be a bull flag, (an ugly one... but possible?) which could give the market one more lunge higher tomorrow.

I'm still short... painfully short, but you must endure a lot of pain in the options world of trading.  Nothing is ever as easy as you plan it too be.  They are always out to surprise you, and take your money.

So, if Ms. Market is listening to me right now... I'm Super Duper Bullish right now!  Go Bulls!  ROFLMAO now!

Red

P.S. Hang in there bears... we ain't dead yet!

Rejected At The 50…

509

Slammed down in the morning, rallied back at noon, but rejected at the 50, and pushed back to even in the last quarter...

That's the story for the market today.  The gap down in the morning was more fear about the Greece issue, but the market shook it off and pushed on up higher... only to hit overhead resistance at the 50 day moving average, and get sold back off into the close.

This is not a good sign for the bulls.  It shows me that they don't have enough strength to rally higher yet.  Once again, they need to pull back and regroup before making another attempt to rally higher.  This overhead resistance at the 50 dma is soon to be double resistance, as the 20 dma moves down into it, forming a "necktie".

A necktie is simply two points (trendlines converging, or moving averages) of resistance or support that meet together at a certain point in time.  They will provide great support, or huge resistance.  In this case, they are overhead now, and will serve as huge resistance.

Whenever the market can't get through resistance or support, it either gaps over it, (by gapping up or down before the open), or it must pullback and rest before another attempt is made.  This leads me to believe that tomorrow,or the next day, the market will pullback and then make another attempt to go through it at a later date.

That doesn't mean tomorrow will be the be sell off day, only that a sell off is coming very soon... if the market can't break through the resistance overhead.  It might try to rally again tomorrow, and be rejected again.  Every time the market makes an attempt to pierce the overhead resistance, and fails... it gets weaker and weaker.

At some point, it will run out of energy and collapse back down.  Whether or not that's tomorrow or not, is anyone's guess?  I know it's coming, and I expect it to arrive this week, but I can't tell you exact date.  Since there isn't any major news or earnings this week, it could be any day this week.

Since Thursday has been bearish lately, and Friday is the last day going into an "unknown weekend", I'd give those two days the most likely days for a fall to happen.  Other then the charts telling me that we will sell off within a few days, there are other clues too.

Gold rallied hard today, even though the dollar stayed flat, and didn't sell off, as the market rose.  Usually, the dollar is selling off, while the market, gold, and oil all go up.  Oil went down today, but the market rallied up.  What is that saying to you?

It says too me that the dollar won't sell off hard because of the Greece fears... which is based on the Euro.  The Euro is still weak, and is likely to stay that way until the Greece fears go away.  That's not likely to happen overnight, regardless of the market's 400 point Dow rally on Monday.  That was just the reason behind it, but the market was very oversold, and was ready for a bounce any way.

As you can see by today's action, the euphoria of the Trillion Dollar Bailout wore off quickly by the close today.  So, the dollar isn't ready to sell off yet, and is staying strong.  OK, what about gold?  Why did it rally when the dollar didn't sell off?  Simple... FEAR!  That's why I don't trade the GLD, as it's supposed to trade opposite of the dollar, but it didn't this time because people will run too gold whenever fear is in the marketplace, regardless of what the dollar does.

How about Oil?  Usually oil is rallying with the market, and while the dollar sells off.  But, the dollar was flat today, and didn't sell off.  What happens to oil when the dollar takes another move higher?  If oil trades the opposite of the dollar, the it will fall hard if the dollar takes another leg up.

Putting all these pieces together, and you have lots of reasons for the market to fall down again hard.  I would love to see another touch of the 50 dma before the sell off, as that makes for a larger drop.  The market wants to hit the 50 dma at least a couple of times, before giving up and retreating lower.  If it falls tomorrow, it won't go downs as far, as it will want one more attempt at touching the 50 dma line.

Think of it like a football player hitting a blocker that he can't get through.  He will likely try several times to push past the blocker, before he falls back and thinks of another strategy.  The market is no different.  Many attempts will be made while "at the line of defense", and finally a retreat back or a push through will occur.

If we start to fall tomorrow, I do expect the gap at 111 spy to be filled before another attempt at the 50 dma is made again.  It might happen in one day or several days?  Regardless, I do still see another leg down, to retest the 105.00 low at least.

After that, then I could see another rally to a possibly higher high in the market.  I don't know if it will happen on June the 25th, as I forecasted in weekend video.  I'd be shocked if the forecast is accurate, but for now it's still possible to follow that path of a new high by late June.

So, for tomorrow... I'm bearish, but not sure if the fall comes on Wednesday, or waits until Thursday and Friday?  Either day, I'm comfortable be short right now.

Red

P.S. I'll be gone all day on Wednesday gang, and won't be able to reply to any posts (no computer access).  So, I leave you in good hands with the lovely Monica, and wise Sundancer.  (Try not to kill all the bulls while I'm gone Monica).

Black Monday Delayed…

1,612

It seems that the only Black Monday to happen was for the Bears... for they just got ran up a tree today fast!

This huge move up, is actually great news for the bears, as it means that there is a higher chance of another sell off coming within the next few days.  So, I was wrong on today being Black Monday, but I still see more selling coming.  Possibly another up day tomorrow, but I don't see very much of a move up possible.  It could just be a flat or pause day?

Looking at the past occurrences of large sell offs, and then a big rebound, in almost every case there was another leg down, putting in a lower low.  Cobra did an excellent weekend update, with a lot of charts that shows all the previous sell offs... which had another leg down almost every time.

I don't think this time will be different.  The next couple of days could be held up, but I really doubt that it will last too long.  We had 4 more fake prints at 111.30 spy, in the afterhours session.  Those could be late fills from yesterday's close of 111.47, or they could be fake prints?  It's hard too tell at this point.

There was also a fake print of 113.42 at about 12:10 pm (est), which was printed again in the afterhours session.  I think that if we open flat, and go down to 113.42, and then bounce back up and go higher... then the final high is already in from April (maybe?).

I say that because I don't think the bulls will have enough power too rally up to a new high, without first making a lower low first.  The bears are looking for a short entry, as many missed the first leg down.  With the bears overhead lurking, there should be too much resistance for the bulls to fight through, if they try to rally higher from the 113.42 level.

If the market goes down and retests the low of 105.00, and makes a lower low, then the bulls will have enough shorts in the market to squeeze them up and put in a new high in late June as I explained in the video I did.  The bulls need to get more fuel to rally up to new highs in this market, and they can't do that without more bears in short positions.  Most bears missed that big move down on Thursday.

That's why there is almost always 2 moves down.  The first one the bears miss out on, and get short too late.  That would be your wave one down in Elliottwave terms.  Then they get squeezed out like today, in wave 2 up.  But, there isn't enough of them short to squeeze them higher, and put in a new high.

You need to bait them again.  So, you have too have another leg down, taking out the current low.  Every bear will go short and continue shorting on every move higher.  They will be the fuel needed to make a new high in the market.  Remember, everyone will see the massive Head and Shoulders, so the bears will continue to go short at every level higher that the market makes.

Eventually, there won't be an more bears to squeeze, and the market will run out of fuel to go higher.  I still believe that will happen in late June or early July.  Whether or not it happens exactly on June 25th, is anyone's guess?  I thought would we sell off hard today, and then start the rally back tomorrow.

But, I was wrong, and the market decided to rally hard today... leaving me to guess at the rest of the week, as to which day the "Big Sell Off" will happen on.  Could it be Black Tuesday, or Black Wednesday?  I don't know yet, but I'm still very confident that another leg down is going to occur... and I expect it too happen this week.

Next week should start the huge rally up, and squeeze all the shorts in the May OPX.  Then, as I said in the video, a possible couple of days of selling... to work off the over bought conditions that will occur.  Then, instead of a continued fall from the huge right shoulder that will have been made, a rally up too the DIA 118.16 mark should occur.

You should all know by now that everything can change, and these are just forecasts that I'm making, by trying to put the pieces together, to give you a clearer picture of the possible future.  The game can change at any time.  But, if the past history shows any indication of the future... then this is the most likely outcome.

One more thing, as you may already know, I didn't go short into the weekend.  I stayed in cash, because I was unsure of what the weekend could bring.  I did go short today, and will stay short unless the market doesn't make the next leg down this week.  That means that the past history isn't valid this time.  But, next week will still most likely be a huge week up.  We all know that opx is usually a bullish week.

This time around shouldn't be any different, and in fact, it should have higher odds of being bullish, as there is now a huge amount of open interest put contracts for May.  They do not want to pay out on all those contracts.  That's why I think we will rally into opx.

The question still remains... is whether we have another leg down first, or this is it?

Red

P.S.  After I wrote this post, Alphahorn posted another chart that has me concerned.  In it, he has a screen shot of the spx on the 1 minute chart, showing a low of 1056 in the pre-market session before Thursday May the 5th.  I'm a little concerned as to whether or not that qualifies as a double bottom... meaning that we might only go down to 113.52 spy tomorrow, and then rally on up from there on out.

Or, was this a fake print telling everyone that the market was going down to 1056 soon (actual low was 1065 on Thursday)?  I'm going to be very cautious here, because that could mean the bottom is in for now?  I don't think it is, but I have too be open to the possibility that the current sell off is over for now.

That doesn't mean I don't expect the fake print of 113.52 spy to be hit, as I still see that happening.  But, I want everyone to be aware of it (thanks for sharing it Alphahorn).  And you might want to lighten up on your shorts at that level... unless you see the market just blow pasted it like it wasn't there of course.

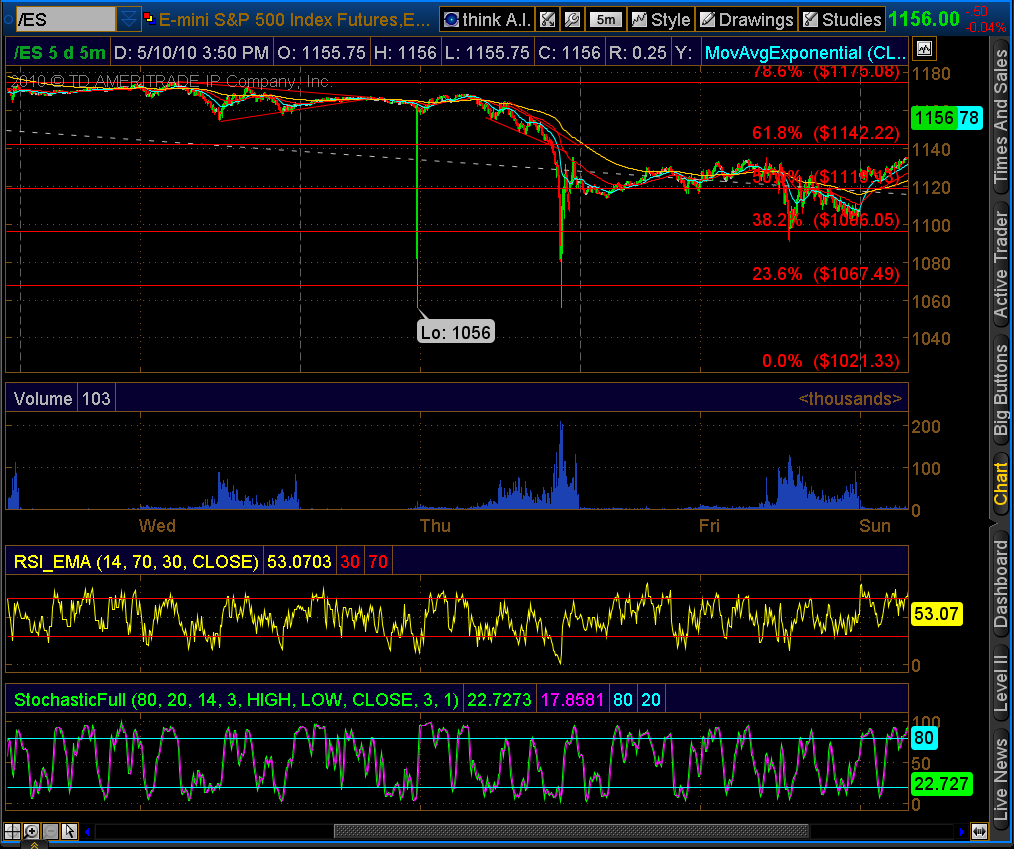
Close up of the print above.  Notice the StochasticFull at the bottom of the chart says 66.6667... tell me these guys don't like their rituals.  LOL

Edit.......

Actually gang, credit for the wonderful catch of the fake print, goes to  http://disqus.com/grednfer   Many thanks from myself and others who find benefit from it... go you Grednfer.  Alphahorn did mention it in his post, but I overlooked it.

Weekend Update – The Great Depression Two (Video Special)

197

Never Did I Want To See This Day, But...
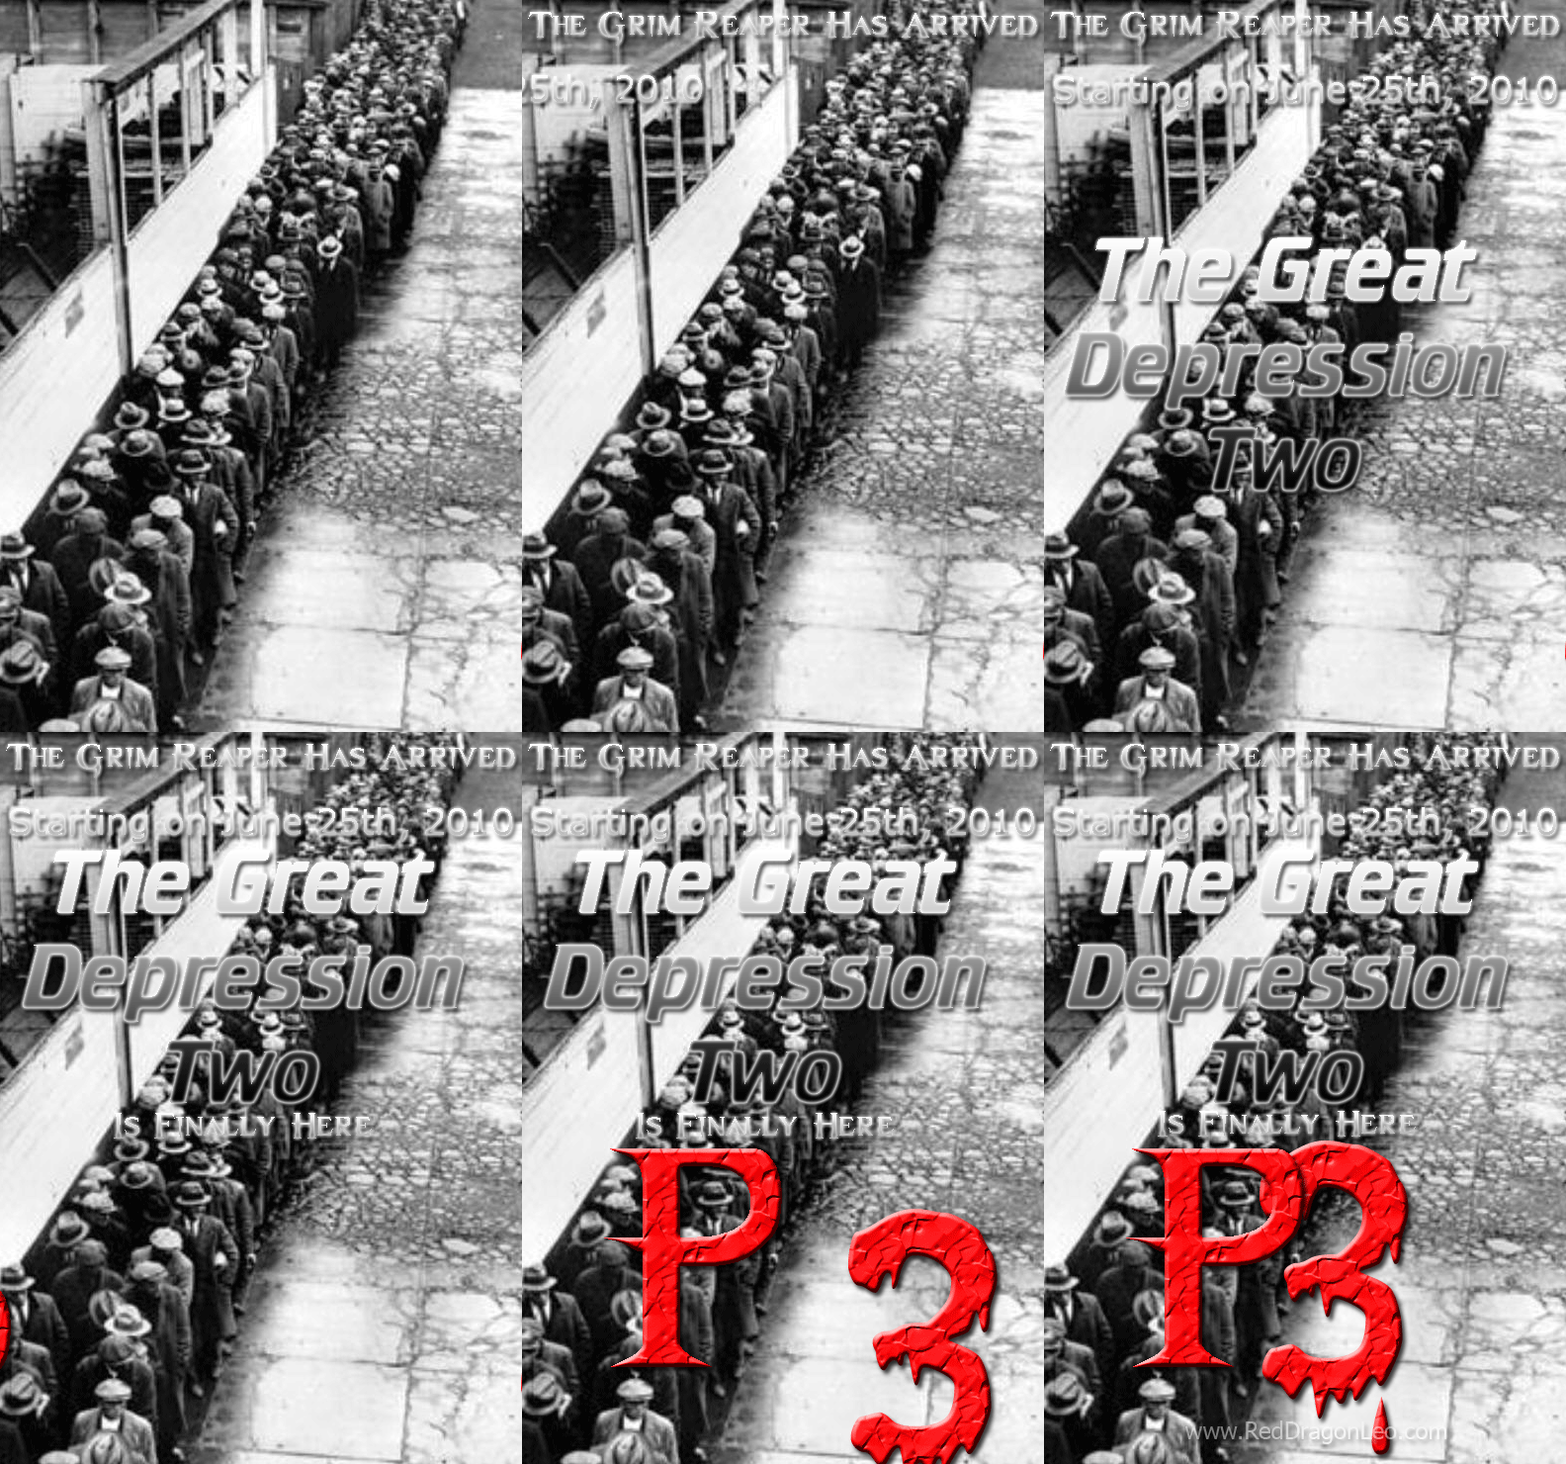
As I sat down to write this weekend update, I knew it wouldn't be like all the rest.  In fact, I knew this update would be  a "life changing" post for many of the readers of this blog.  You see, I finally have enough pieces of the puzzle to see what is coming up next... and it scares the hell out of me!

I've decided to do a video explaining everything, as it's much simpler, and will get the message across better.  This is my first video post, and I don't have a script for it, so bare with me as I might jump around some.  Once you watch the video, I encourage you to pass it around to your friends, as it might help save them from the coming disaster too.  Just click on the image below and a new window will open with the video...

In the video, I quote some very intelligent people, that include investors, forecasters, and economists... to name a few.  The link to the website is here... It was posted by Stock_Tech, a commenter on Thursday's post.  (Many thanks for the link).  I'm going to copy the post, and highlight the one's that really stand out to me, and post them below...

Economic Crash Forecast for 2010

3/24/10

Secular Voices

Bob Chapman

First 6 months of 2010, Americans will continue to live in the 'unreality'...the period between July and October is when the financial fireworks will begin. The Fed will act unilaterally for its own survival irrespective of any political implications ...(source is from insider at FED meetings). In the last quarter of the year we could even see Martial law, which is more likely for the first 6 months of 2011. The FDIC will collapse in September 2010. Commercial real estate is set to implode in 2010. Wall Street believes there is a 100% chance of crash in bond market, especially municipals sometime during 2010. The dollar will be devalued by the end of 2010.

Gerald Celente

Terrorist attacks and the "Crash of 2010". 40% devaluation at first = the greatest depression, worse than the Great Depression.

Igor Panarin

In the summer of 1998, based on classified data about the state of the U.S. economy and society supplied to him by fellow FAPSI analysts, Panarin forecast the probable disintegration of the USA into six parts in 2010 (at the end of June – start of July 2010, as he specified on 10 December 2008)

Neithercorps

Have projected that the third and final stage of the economic collapse will begin sometime in 2010. Barring some kind of financial miracle, or the complete dissolution of the Federal Reserve, a snowballing implosion should become visible by the end of this year. The behavior of the Fed, along with that of the IMF seems to suggest that they are preparing for a focused collapse, peaking within weeks or months instead of years, and the most certain fall of the dollar.

Webbots

July and onward things get very strange. Revolution. Dollar dead by November 2010.

LEAP 20/20

2010 Outlook from a group of 25 European Economists with a 90% accuracy rating- We anticipate a sudden intensification of the crisis in the second half of 2010, caused by a double effect of a catching up of events which were temporarily « frozen » in the second half of 2009 and the impossibility of maintaining the palliative remedies of past years. There is a perfect (economic) storm coming within the global financial markets and inevitable pressure on interest rates in the U.S. The injection of zero-cost money into the Western banking system has failed to restart the economy. Despite zero-cost money, the system has stalled. It is slowly rolling over into the next big down wave, which in Elliott Wave terminology will be Super Cycle Wave Three, or in common language, "THE BIG ONE, WHERE WE ALL GO OVER THE FALLS TOGETHER."

Joseph Meyer

Forecasts on the economy. He sees the real estate market continuing to decline, and advised people to invest in precious metals and commodities, as well as keeping cash at home in a safe place in case of bank closures. The stock market, after peaking in March or April (around 10,850), will fall all the way down to somewhere between 2450 and 4125 during the next leg down.

Harry Dent (investor)

A very likely second crash by late 2010. The coming depression (starts around the summer of 2010). Dent sees the stock market--currently benefiting from upward momentum and peppier economic activity--headed for a very brief and pleasant run that could lift the Dow to the 10,700-11,500 range from its current level of about 10.090. But then, he sees the market running into a stone wall, which will be followed by a nasty stock market decline (starting in early March to late April) that could drive down the Dow later this year to 3,000-5,000, with his best guess about 3,800.

Richard Russell (Market Expert)

(from 2/3/10) says the bear market rally is in the process of breaking up and panic is on the way. He sees a full correction of the entire rise from the 2002 low of 7,286 to the bull market high of 14,164.53 set on October 9, 2007. The halfway level of retracement was 10,725. The total retracement was to 6,547.05 on March 9, 2009. He now sees the Dow falling to 7,286 and if that level does not hold, “I see it sinking to its 1980-82 area low of Dow 1,000.” The current action is the worst he has ever seen. (Bob Chapman says for Russell to make such a startling statement is unusual because he never cries wolf and is almost never wrong)

Niño Becerra (Professor of Economics)

Predicted in July 2007 that what was going to happen was that by mid 2010 there is going to be a crisis only comparable to the one in 1929. From October 2009 to May 2010 people will begin to see things are not working out the way the government thought. In May of 2010, the crisis starts with all its force and continues and strengthens throughout 2011. He accurately predicted the current recession and market crash to the month.

Lyndon Larouche

The crisis is accelerating and will become worse week by week until the whole system grinds into a collapse, likely sometime this year. And when it does, it will be the greatest collapse since the fall of the Roman Empire.

WALL STREET JOURNAL- (2/2010)

"You are witnessing a fundamental breakdown of the American dream, a systemic breakdown of our democracy and our capitalism, a breakdown driven by the blind insatiable greed of Wall Street: Dysfunctional government, insane markets, economy on the brink. Multiply that many times over and see a world in total disarray. Ignore it now, tomorrow will be too late."

Eric deCarbonnel

There is no precedence for the panic and chaos that will occur in 2010. The global food supply/demand picture has NEVER been so out of balance. The 2010 food crisis will rearrange economic, financial, and political order of the world, and those who aren’t prepared will suffer terrible losses…As the dollar loses most of its value, America's savings will be wiped out. The US service economy will disintegrate as consumer spending in real terms (ie: gold or other stable currencies) drops like a rock, bringing unemployment to levels exceeding the great depression. Public health services/programs will be cut back, as individuals will have no savings/credit/income to pay for medical care. Value of most investments will be wiped out.

The US debt markets will freeze again, this time permanently. There will be no buyers except at the most drastic of fire sale prices, and inflation will wipe away value before credit markets have any chance at recovery. The panic in 2010 will see the majority of derivatives end up worthless. Since global derivatives markets operate on the assumption of the continued stable value of the dollar and short term US debt, using derivatives to bet against the dollar is NOT a good idea. The panic in 2010 will see the majority of derivatives end up worthless. The dollar's collapse will rob US consumers of all purchasing power, and any investment depend on US consumption will lose most of its value.

Robin Landry (Market Expert)

I believe we are headed to new market highs between 10780-11241 over the next few months. The most likely time frame for the top is the April-May area. Remember the evidence IMHO still says we are in a bear market rally with a major decline to follow once this rally ends.

John P. Hussman, Ph.D.

In my estimation, there is still close to an 80% probability (Bayes' Rule) that a second market plunge and economic downturn will unfold during 2010.

Robert Prechter

Founder of Elliott Wave International, implores retail investors stay away from the markets… for now. Prechter, who was bullish near the lows in March 2009, now says the stock market “is in a topping area", predicting another crash in 2010 that will bring stocks below the 2009 low. His word to the wise, “be patient, don’t rush it” keep your money in cash and cash equivalents.

Richard Mogey

Current Research Director at the Foundation for the Study of Cycles- Because of a convergence of numerous cycles all at once, the stock market may go up for a little while, but will crash in 2010 and reach all-time lows late 2012. Mogey says that the 2008 crash was nothing compared to the coming crash. Gold may correct in 2009, but will go up in 2010 and peak in 2011. Silver will follow gold.

James Howard Kunstler (January 2010)

The economy as we’ve known it simply can’t go on, which James Howard Kunstler has been saying all along. The shenanigans with stimulus and bailouts will just compound the central problem with debt. There’s not much longer to go before the whole thing collapses and dies. Six Months to Live- The economy that is. Especially the part that consists of swapping paper certificates. That’s the buzz I’ve gotten the first two weeks of 2010.

Peter Schiff (3/13/2010)

"In my opinion, the market is now perfectly positioned for a massive dollar sell-off. The fundamentals for the dollar in 2010 are so much worse than they were in 2008 that it is hard to imagine a reason for people to keep buying once a modicum of political and monetary stability can be restored in Europe. In fact, the euro has recently stabilized. My gut is that the dollar sell-off will be sharp and swift. Once the dollar decisively breaks below last year's lows, many of the traders who jumped ship in the recent rally will look to re-establish their positions.

This will accelerate the dollar's descent and refocus everyone's attention back on the financial train-wreck unfolding in the United States. Any doubts about the future of the U.S. dollar should be laid to rest by today's announcement that San Francisco Federal Reserve President Janet Yellen has been nominated to be Vice Chair of the Fed's Board of Governors, and thereby a voter on the interest rate-setting, seven-member Open Markets Committee. Ms. Yellen has earned a reputation for being one of the biggest inflation doves among the Fed's top players." Schiff is famous for his accurate predictions of the economic events of 2008.

Lindsey Williams

Dollar devalued 30-50% by end of year. It will become very difficult for the average American to afford to buy even food. This was revealed to him through an Illuminati insider.

Unnamed Economist working for US Gov't (GLP)

What we have experienced the last two years is nothing to what we are going to experience this year. If you have a job now...you may not have it in three to six months. (by August 2010). Stock market will fall = great depression.  Foreign investors stop financing debt = collapse. 6.2 million are about to lose their unemployment.

Jimmy "Doomsday"

DOW will fall below 7,000 before mid summer 2010- Dollar will rise above 95 on the dollar index before mid summer 2010- Gold will bottom out below $800 before mid summer 2010- Silver will bottom out below $10 before mid summer 2010- CA debt implosion will start its major downturn by mid summer and hit crisis mode before Q4 2010- Dollar index will plunge below 65 between Q3 and Q4 2010. Commercial real estate will hit crisis mode in Q4 2010- Over 35 states will be bailed out by end of Q4 2010 by the US tax payer End of Q4 2010 gold will hit $1,600 and silver jump to $35 an oz.

George Ure

Markets up until mid-to-late-summer.  Then "all hell breaks lose" from then on through the rest of the year.

Prophetic Voices

Neville Johnson

As I thought and prayed about the past year I felt the Lord say to me that 2010 was a year of labor pains, with the contractions getting closer and closer together towards the end of the year.

Sadhu Sundar Selvaraj

Starvation and famine/financial problems will develop. Terrorist attacks. Banks close. Tsunami. 7 new diseases worse than swine flu.

Amos Scaggs

The ultra-rich will go broke. I don’t mean go bankrupt I mean go broke, no money. I saw ultra rich people working for food because they were broke. This will happen by mid-February 2011.

Andrey Rasshivaev

The world is going to face the total and complete economical and financial collapse in August-September of this new 2010 year.

Greg Evensen

Economic meltdown and possible martial law in the mid summer 2010.

Larry Randolph

... there is yet a seven-fold shaking of greater magnitude coming that will produce enormous and perhaps catastrophic disruptions on economic, political, geophysical, atmospheric, and spiritual levels.

Weather Bill

Huge earthquake on the west coast in early September 2010. This earthquake to come is going to start the swift downfall of America.

Harold Eatmon (1998)

I had a vision of the stock market soar and then crash. After the crash, many big business corporations and private parties bought up stocks because of the low cost to buy in. Then I saw the market begin to climb again in a short period of time. Then it crashed again bringing tremendous loss, ruin and devastation to all who bought in the first time. This is what I have labeled "Two Black Mondays" . The time period between the Two Black Mondays was very close together. I could not tell exactly how close. There are some tell tale signs indicating the season and the setting. I saw the season to be when *"the leaves fall to the ground"* then the first crash would occur."Like Joseph in Genesis, I believe America will have fat years of financial blessing. I also believe there are coming lean years of financial difficulty for America.  [Note: while this doesn't give an exact date, this prophecy was dead on accurate-the markets crashed -777 points on MONDAY 9/29/08, roughly 1 week into the FALL (leaves fall to the ground.) The markets then rebounded OVER A SHORT PERIOD OF TIME (from April 2009 to October 2009 the markets rallied nearly 4000 points!) and everyone bought back in. According to this prophecy, the next huge crash will happen on a Monday. Eatmon even accurately predicted the coming 'fat years' and the now present 'lean years']

Robert Holmes

On October 21, 2008 the Lord said to me (of the global economic crisis): “It will be a dead cat bounce,” meaning it will go down fast, bounce back then fall again. In April 2009, after some growth had taken place, the Lord affirmed, “Don’t get too excited about the market news, it will crash again.” In September 2009, He commented on stock market prices (as measured by the Dow Jones), “It will be a W curve”. Though it will improve through to mid 2010, it will crash again under “the weight of debt”.

Deryn Johnstone (1/25/2010)

"We will experience a worldwide economic upheaval resulting in the collapse of our monetary system. This economic crash will come suddenly, sending shockwaves throughout the world. It will be the opening of the establishment of a new one-world monetary system under a new one-world government. When this worldwide economic disaster hits, it will be unlike anything we have ever experienced. The world will be thrown into a state of shock. Panic and fear will grip the hearts of the people everywhere. They will be confused, not knowing what to do or where to go. During this time, the people of God will be clearly distinguished from the world by God's supernatural provision in their lives. It will not be the absence of problems and adversity among God's people that will be a witness to the world, but in the midst of this financial crisis the world will see God's strong arm of provision for His people.

Robert L

What is going to happen this year? 1. The stock market in America will not only crash, it will no longer exist 2.  The President of the USA will foolishly bring sanctions on the nation of Israel 3. There will be a great earthquake that stretches from the Atlantic Ocean to the Pacific 4. The greatest fear will be none of these things; it will be the lack of food men will fear most. The sad truth is that even after all these things have taken place in 2010, most will not repent and turn back to God, most will become even more corrupt as we speedily rush toward the end of time.

--------------------------------------------------------------------------------------------------------------------

Needless to say, what lies ahead of us spells DISASTER!  It's not going to be fun, even though all of you reading this post will have the chance too profit hugely from it.  But many lives will be ruined in the process.  There will be countless people go homeless, as they lose everything they have every worked for.

I encourage you all to reach out and spread this message to all that you know. I also ask that you help those that will be needing your help in the not so distant future.  If you position yourself correctly, you can become filthy rich from this coming crash. If not, then you will go broke like all the others who didn't listen.

Choose wisely...

Red

BLACK MONDAY IS FINALLY HERE…

180

No Post For Friday Gang.  Go Enjoy The Weekend


It seems I missed out on all the fun, but at least I was short the market... and not long. I'd hate too have been long during the big drop down to 1065, many people were wiped out today.

Look out below, as that's a trader jumping from a tall building! I'm sure there were some suicides today, or will be tomorrow. This isn't over folks... so don't get caught long, as Monday is going to be BLACK MONDAY!

Yes, as the old saying goes... third times a charm! But this time they have told us where they plan to take it. The target is 105.00, and the date is Monday, or possibly Tuesday.

Sundancer was able to catch an after-hours print of 109.65 spy, which is probably the target for tomorrow. But, he also caught a 114.80 print too, which means that a gap up is likely, with the high being 114.80, and then selling off into the close with 109.65 being the low.

Of course I don't know if 109.65 will be hit after the 114.80 high or before it, but a gap up first... and then a sell off is more likely.

Next we have Monday... which will probably just drop all the way to 105.00, and rape everyone who goes long into the close Friday... expecting another bullish Monday. Well it ain't happening this time folks!

It's going to be a Black Monday, so get yourself positioned properly, as you will either get killed or profit like a mad man! Times like these can make you a ton of money, or wipe you out.

Once the 105.00 target is hit on Monday or Tuesday, ever bear on the planet will be awake and going short. The bulls will bailing out too, as it seems the ship is sinking.

Everyone will be calling "P3 is here", and will go short with everything they have... only to watch the market rise back up from the dead and rally without a single pullback, for weeks on end.

If you read this blog regularly, you know how many times I have said that this market is 100% controlled, and manipulated by the "powers that be". So you should know by now that this fake prints are given out to tell all their friends where they plan on taking the market.

Believe it,or not... but it's real. We have been given the road map for tomorrow and next week, as well as the final high in the market (DIA 118.16 - about DOW 11,816). The question is, do you listen to what they are telling you, or do you just call it "Fat Finger Mistakes"?

In case everyone has forgotten, I caught this fake print back in January, but when the sell off happened in February, I forgot all about the fake print. I didn't know if it was real at the time, or just an honest mistake?

I went short around 1060-1070, and got my ass handed too me when we tagged 1044.50, and reversed like a bat out of hell! That was a tough lesson for me, as I lost a lot of money. I won't make that mistake again.

If I'm able to time the entry and exit points over the next few days correctly, I'll recover all I lost and actually make some too.

I hope everyone reading this blog takes these fake prints seriously, as most... maybe not all, do come true. so lets go over the game plan for tomorrow one more time...

We are given 2 fake prints on the SPY. One is for 114.80, and the other is 109.65, and on the XLF we have fake prints at 15.58 (closing price is 15.25), and finally the IVR has a 43.16 target.

Tomorrow has higher odds of a gap up, and move up to the 114.80 area first, and then a sell off into the evening, down to the 109.65 area. But, there is no guarantee that both targets will be hit tomorrow.

We could go up and close at 114.80, and gap down on Monday and close at 109.65 area. Then sell off again on Tuesday to the 105.00 area, before we start the bull rally back up again.

The thing to focus on, is to get short around the 114.80 area... whenever it gets there. Then stay short until the 105.00 is hit next week.

At that point, you need to go long, and stay long for the next few months, as our final high is around DOW 11,816. I'm expecting the market to nearly go to sleep after this turbulence is over, and all the bears will go back into hibernation.

I will be around all day tomorrow (Friday), and Monday and Tuesday too. I've rescheduled my appointments, as I don't want to miss out on more of the fun again.

Best of trading to all of you...

Red

The Bulls And Bears Duke It Out Again…

1,057

Yesterday, the Bear "Knocked Out" the Bull cold, but today the Bear only squeaked by with a few point victory.

Tomorrow morning we get the Initial Claims and Continuing Claims numbers at 8:30 am EST, before the bell.  What will they be?  Will the government continue to use their magic eraser to make the numbers look more positive to the market?

Or, will they actually release the "real" numbers and cause more selling in the market?  It's clear too me that they plan on taking it down to our fake print number of Dow 10,000... which will probably be about 1055 spx.  But, that doesn't mean it will go straight down.  There will be bounces along the way, as they'll need to squeeze out some of the shorts before the final sell off.

So where does the market bounce at?  Will it be at 115.00 spy, or the next support level of 113.00?  Maybe those levels will only produce intraday bounces, and the only major bounce will be at the 200 dma?  Most all traders know that any moving average that the market hasn't hit in a long time, will be good for a solid bounce.

Well, the 200 dma hasn't been hit in a very long time.  You can be sure that a bounce will occur there, and it should be a multi-day bounce.  Currently the 200 dma is at 1094.07, and rising every day.  It should be just under 1100 within the next week or so.

So, if the market doesn't sell off anymore tomorrow or Friday, then it's going down hard next week.  Two more days of wild swings like today, only to put in a candle bar of indecision at the close of each day, will be the makings of a beautiful bear flag pattern on the daily chart.

That could lead to one really nasty sell off on Monday, if it plays out that way?  You know how the government likes to mix in really positive news with the really negative news... confusing both bulls and bears.  That's why you could see a swing higher tomorrow, and then another swing lower... only to end the day looking like today did.

It could look exactly like January 25th (compared to today), the 26th, and the 27th (which would be like this coming Friday).  If it plays out like that, then Monday is going to be ugly!  I don't know if it will or not, but I'm staying short for now.

I've changed my mind about going long at 115.00, as I would just feel more comfortable staying short until will hit the 200 dma.  Then I might go long for a few days swing trade, and finally get back short again, looking for the final low around 1055 spx.

So for tomorrow... it's a wild card!  Being short I could get squeezed a little tomorrow, but I'm riding it out... as this ship is sinking, she just doesn't know it yet.  She could just drop another 200 point tomorrow?  There was a nice bear flag formed on the 10 minute charts today... meaning that it should sell off in the morning.  But, it could rally back up by the end of the day, as it's just a guessing game at this point...

Red

Maybe Not That Hard To Kill A Bull?

65

The Bears celebrated today by laughing and giving each other "High Fives"...

It's seems it's been such a long time since the bear has had a decent meal, that this one almost seems like a dream.  The sell off I've been waiting for is finally here... but will it end today?  I don't think so.  Here is the same chart I posted on Sunday... now look at where we are compared to the last sell off?

Do you notice anything similar?  I certainly do, and I believe that tomorrow will not bounce at all, as many of the bulls are expecting it too.  I think it will open and continue selling off until we hit the 115.00 spy level, and then a bounce will occur.  How much is still unknown?  It could end the correction and then we are back to the slow grind up to our finally destination of 11,816 (DIA 118.16), where we have our fake print that Sundancer caught many weeks back.

However, the way the market climbed to it's current height, leads me to believe that we will continue on down to the other fake print of Dow 10,000 and 107.38 spy first, and then rally hard.  The climb up is too step I believe, and a larger correction needs to happen before turning the ship back around.

Think of it as a large ship, traveling way too fast in the water.  If it sees danger ahead, (like a fleet of enemy ships), it must turn the ship around as fast as possible and go back another direction.  Unfortunately, it's been moving too fast for too long, without stopping for any maintenance (pullbacks in the market), and now the engines are kicked into full reverse causing the ship too turn quickly.

But, half way through the turn (the coming bounce at 115.00), the ship's engine's lock up from the stress, and a quick repair must be done (another sell off to 107 area), before she can get back up to speed and away from the enemy ship (full of an army of bears of course).

So as you can see, I'm really leaning toward fulfilling the lower target fake prints first, before the rally continues back up again.  Will it play out that way?  That's any one's guess?  I think it will, but time will tell...

Red

It’s Hard To Kill A Bull…

266

Well, it seems that small bounce up wasn't good enough for the bulls, as they rallied back well above 50% of Friday's sell off.  Those bulls are pesky and irritating creatures... to say the least.  But, I knew that it was possible that they'd rally it back up, as the charts were showing that the market was oversold on a short term basis.

However, today they ended overbought.  So, I do believe we will sell off some tomorrow.  I'm not looking for anything major, as I think everyone is waiting on the job's reports on this Friday.  That should be a big market mover.  Of course between now and then, any news out of Greece or some other event, could spook the market first... and let the selling begin.

One thing of interest today, on both the 60 minute and the 15 minute charts, was how the market couldn't get above this downward sloping trendline.  It is clearly putting pressure on it, and if the market wants to go above it, then a gap open over top of the trendline, is going to be required.

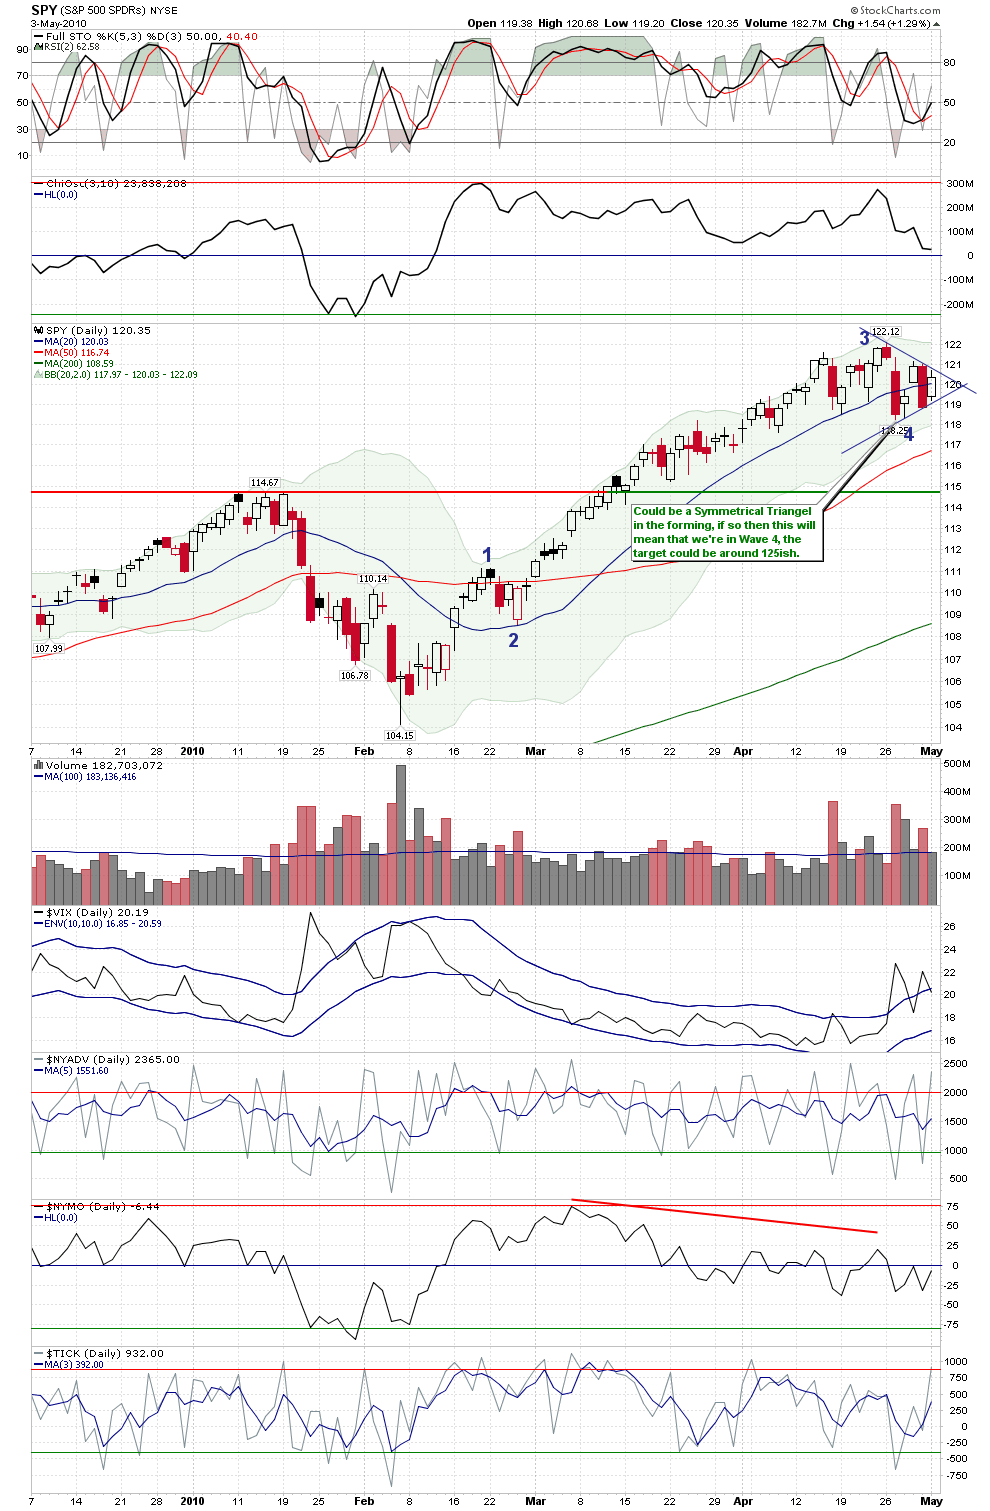
It's the same trendline shown in this chart below (found on Cobra's blog).  Problem is, there is also a lower trendline that is supporting the market, and preventing further selling.  This is looking like a symmetrical triangle (credit goes to Cobra for spotting it, as I didn't), which still has another day or 2 of room to trade in, before it reaches the apex, and must jump out.

All the other charts are still signaling that the market will pull back, but unless we get some bad news event to cause the selling, we are waiting for Friday to produce it... and that's only if the jobs data is bad.  You know how the government likes to erase some of the digits on the report.  It's just like giving the report card of the students grades, to the student first, and telling him to give it to his parents.  Funny how easy it is to turn those "F's" into "A's"...  So as much as I'd like to tell you that all the charts are pointing down, the chart above could go either way.

We are also now 3 weeks away from this months' option expiration, and although the market sentiment is still extremely bullish, the amount of puts purchased versus calls, for the month of May, is way too heavy on the put side.

That doesn't mean we can't sell off this week, and rally back hard into opx, but the chance of the market crashing into opx is very slim.  Those market makers are not going to pay out on all those puts.  I've seen it too many times, how they sell tons of puts to the retail trader, and then rally the market, making them expire worthless.

Of course after opx is another story, but for now, the bears have really only got this week too get a sell off to happen.  The week of opx, and most of the week prior to opx is already reserved for the bulls I'm afraid...

Red

Weekend Update…

1,032

CHECK OUT THE VIDEO I DID ABOUT THE NEW LOOK

Last Friday we had a really nice sell off, which extremely rare these days.  But what does it mean?  For an answer to that we have to look at all the charts.  So in this weekend update, I'm going to go over the monthly, weekly, daily, hourly, and the 15 minute charts.

The question that always comes to my mind, is whether or not technical analysis actually works?  I've done my best to learn it, and to adapt to fit in the news, as well as the "manipulation factor".  But, it's still not perfect.  The reason probably lies in the fact that I might interpret the charts different then the next person.

This "difference of opinion", between myself and other people, is the exact reason I have this blog.  There isn't anyway that I can cover everything, and put all the pieces together.  That is why I need YOU, the reader and commenter.

By everyone posting their thoughts and comments, we all are then better informed.  Hopefully, we can adapt and still make a profit from the market, even if it goes against us.  Believe me... I know, as it's went against me too many times.

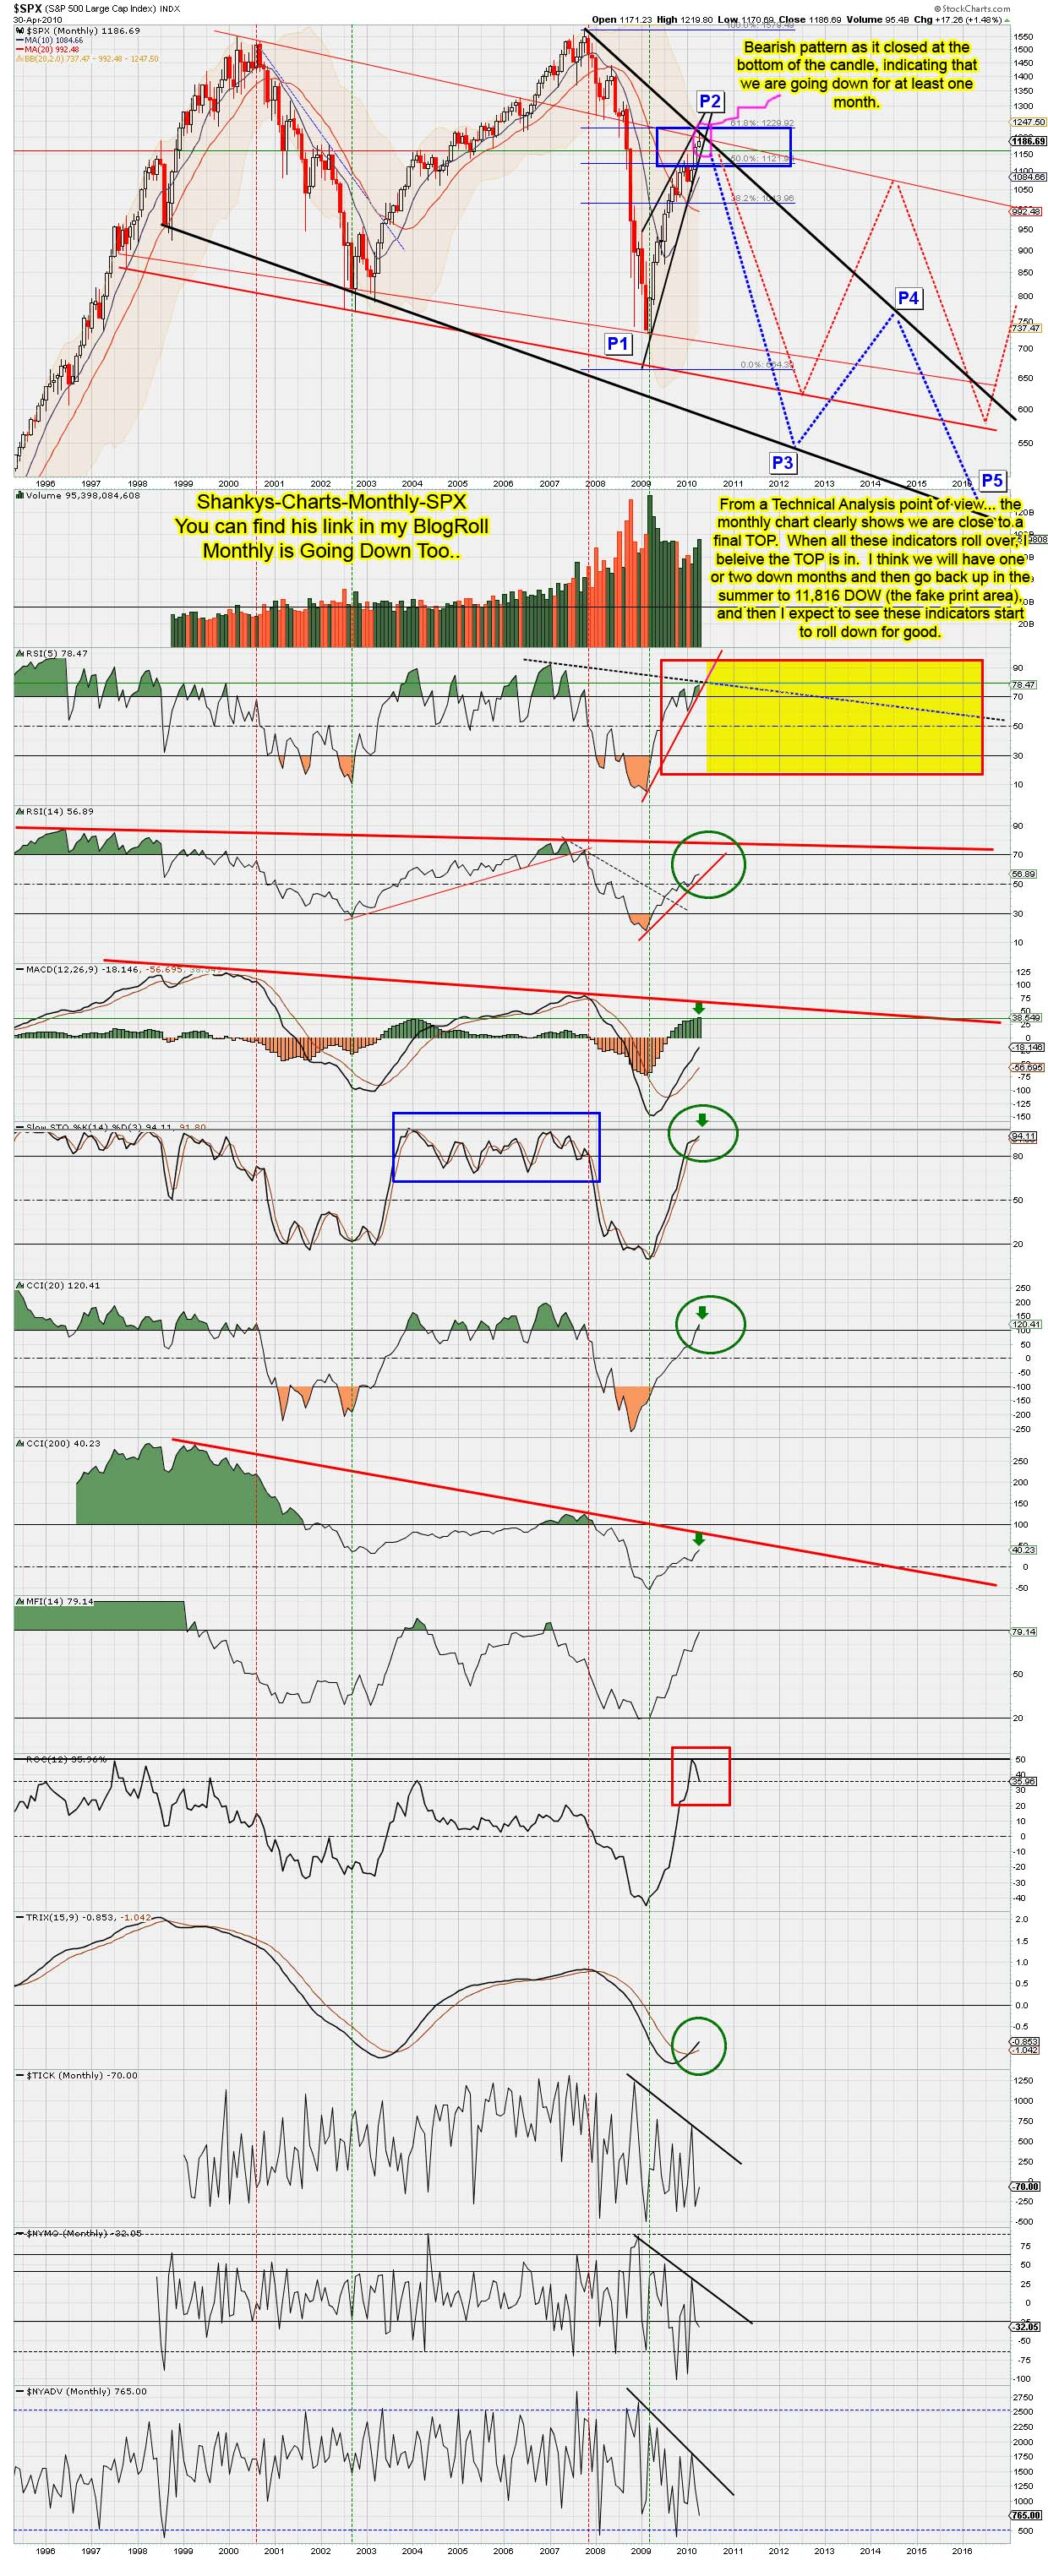
So let's dive into the charts, and try to figure out what's next.  Below we have the monthly chart of the SPX, which now is clearly showing a "Topping Tail".  That's a very bearish signal, which means that the "Top" may very well be in.  If so, then it's probably down hill for the next several years.  But I'm not convinced that this is the final top, as the MACD's and STO's haven't rolled over yet.  That leads me to believe we will have 1-2 down months, and then back up to the fake print area of DOW11,816 by the end of this summer.

Shankys-Charts-Monthly-SPX

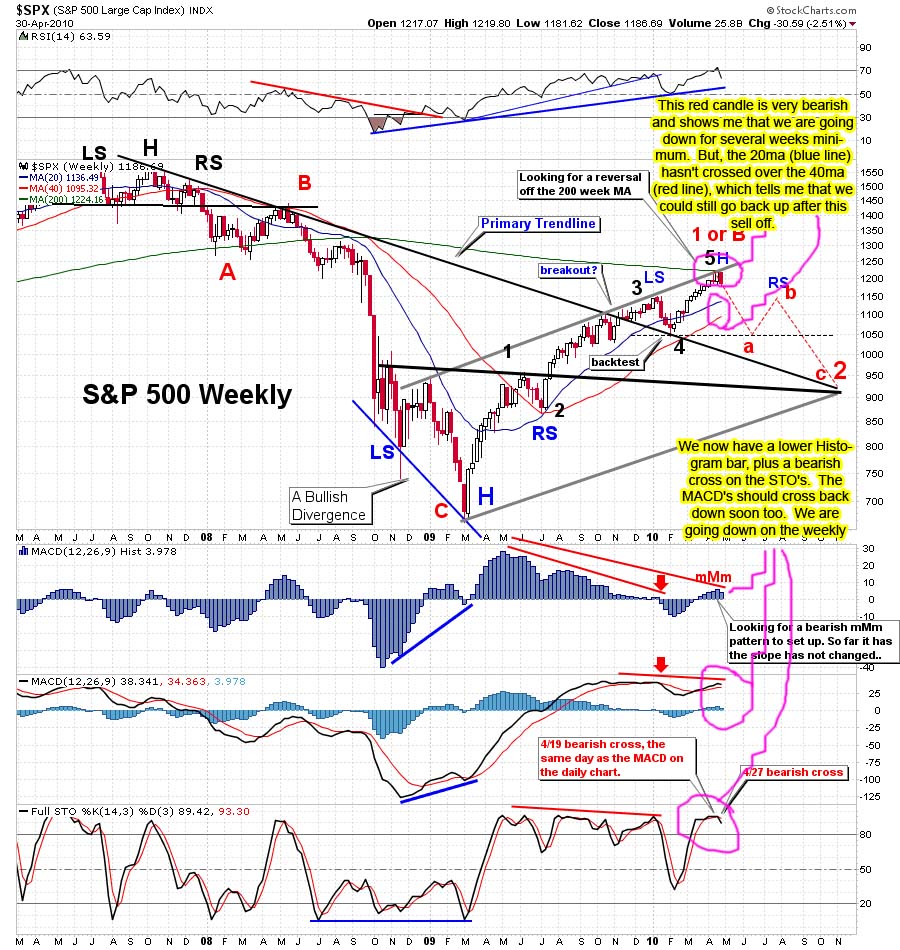
Moving on to the weekly chart, we see that we just put in a very bearish reversal candle, closing at the low end of the candle.  You can also see that the MACD Histogram put in a lower candle, and that we have a bearish cross on the Full STO's.  The RSI is also pointing down now, and hasn't done so since January.  Notice how steep the downturn is on it.  This is very bearish.

The-Chart-Pattern-Trader-spx-weekly
Now let's look at the daily charts.  The first daily chart shows the SPX, with another very bearish red candle on Friday.  Notice that the 10 EMA (blue line) is just about to cross over the 20 EMA (red line), which hasn't done so since the January sell off.  Look at the RSI, as it's fell from the "above 70" area, and is now at the 50 line, and pointing down.  I expect it to break soon, which will give the bears more power.  The red and green ADX lines are criss-crossing, but I expect the -DI (red line) to rise back up soon, causing more selling.

The-Chart-Pattern-Trader-spx-daily

Now let's look at the daily chart of the SPY, with some different indicators.  The one thing that stands out is the clear break of the rising support line.  The first break was on Tuesday, and then the market back tested the line on the next two days, and finally failed to get back above it on Friday, as it sold off hard.  Looking at the Full STO's you notice that the black line is pointing back up and touching the red line.  This indicates that the market could go up on Monday, or even Tuesday too.  I expect it to fail and roll back down, not crossing the 50 level.

cobra's-daily-spy-chart

Let's look at the 60 minute charts now.  Now this chart is from Ron Walker's site (he's "the chart pattern trader"), and he has it marked as a "head and shoulder's" pattern, but I disagree with that labeling.  From what I've learned, a H&S pattern must have a rising trendline, with the right shoulder having the higher part of the trendline.  Meaning that it can't be a level trendline (support line).  It must slope up on H&S patterns, and slope down on Inverse H&S pattern.

The-Chart-Pattern-Trader-spx-daily

Regardless, it still looks like the market still pointing down.  The MACD's have rolled over and are pointing down, and are also below the zero line.  The Full STO's are still going down, and then the ADX line is gaining strength with the -DI (red line) on top and rising higher.  All are bearish signs, indicating that the market is likely to open down, or flat, and start selling off.  The only question is whether or not it will bounce at the triple bottom or just gap down below it on Monday.

Looking at the 15 minute chart, we see it is also pointing down, with the Full STO's still going down lower, while it's already below the 20 level.  This is very bearish.  That triple bottom support is about the only bullish thing I can find right now.  Look at the MACD, as it's still going down too, and the RSI is at the 30 level, giving strength to the bears.  Plus the ADX line is rising, giving power to the DI line on top... which is the negative line.

The-Chart-Pattern-Trader-spx-15-minute

I think that we are either going to see a gap down on Monday, and continued selling until we hit 117.50 spy for the first level of support, (which should give at least an intraday bounce), and then 115.00 spy, which should be a multi-day bounce.  Or, we open flat, trade sideways for the day while the MACD's and Full STO's roll back up.  If so, then I'd expect them to peak on Tuesday, and start back down by Wednesday.

The moves up should put in a nice bear flag pattern, as I don't expect the market to get back above Friday's high.  Maybe a 50% retrace, but probably less.  This assumes that we hold the triple bottom and don't gap down past it on Monday morning.  But either way, I'm looking for the week to be down again.

Red

The Bears Are Back…

55

big-bear-hug-for-you

Great day to be a bear, as the market sold off today, erasing yesterday's gains.  Most of the fear was based on the news released that Goldman Sachs could face criminal charges too.  Originally, they were just civil charges... which is no big deal to Goldman, because they have plenty of money to pay any fines.
But criminal is another story, as somebody could go to jail.  That's what I'd love to see, but I think it's more smoke and mirrors then actual arrests.

I'll do a weekend post that will be more in depth, with what I'm seeing for next week.  I do think we will bounce up on Monday, at least in the morning.  That's assuming no more negative news is released over the weekend.  That's the wildcard that no one can see.

Anyway, have a great weekend...

Red

The Bulls Are Back…

1,820

bull-holding-sign

At least the retail bulls were, but the big institutions didn't participate in today's rally.  For many months now, the volume on UP days is low, and the volume on Down days is heavy.  Why is that?  Simply put... the big institutions are selling big on the down days, and sitting on the sidelines on the up days.

They buy a little bit, just to get the market jump started, and then the retail trader jumps in and pushes it up the rest of the day.  That's exactly what happened today as the big boys gaped the market above the key overhead resistance, and then turned it over to the retail traders.

This really reduces the odds of nice correction now, as today's move rallied most indexes back inside key trendlines and support areas.  That doesn't mean the bear is dead, but he just got a bull horn jabbed into his side today.  It's a serious wound, and makes any more downside attacks limited.

I am surprise that the  bulls didn't go up to the double top level at about 1212 spx today.  They had the opportunity, as the volume was almost non-existent.  But, since tomorrow is Friday, I'd expect them to push it up some more and at least reach that double top.  The news released by the government tomorrow, will of course be manipulated to push up the market more.  Any news that they control will be made up, and not accurate.

The earnings report from various companies is tougher to manipulate, but the government encourages them to lie on them, so they will look positive for the economy.  So, since there isn't any major earnings report tomorrow, the only news left to report is various economic reports (GDP being the major one)... which again will be favorable.

It's looking more and more like we might be forming a sideways channel, as the bears can't seem to break the downside support levels, and the bulls can't go above the overhead resistance.  It really makes more sense to manipulate the market sideways, so the crooked banksters can unload their stock slowly to the retail trader.

The dollar is also looking bearish, and should continue to fall.  This will of course help push up the market, as they are still locked in sync with each other, and go in opposite directions.  Without the dollar pushing up, it's going to be hard to see the market sell off hard.

So, I guess it's time to put the old green up arrow back up, as the odds of a serious sell off on Friday is very low.

Red

green-up-arrow

Same Old Speech…

26

endthefed

Once again the Federal Reserve Board did nothing.  Not that I was expecting them to raise rates, but it's more about what they say, then what they do (or don't do).  I'm sure everyone expected them to leave the rates the same, but what are their plans for the future?

The answer is... nothing much!  In other words, they didn't say anything to give the market hope, or to cause a sell off.  That was one of the reasons the market was basically flat today (small up, but nothing like the down day on Tuesday).  This was too be expected, as most Fed Day's are UP day's.

However, even though the market did go up a little... it looked VERY Weak today.  Every time the market tried to rally today, it would quickly sell off.  This is one tired Bull, and I look for it to continue selling off this week.  Possibly another flat day tomorrow (Thursday), but I really doubt it on Friday.  I can't see many traders holding over the weekend with all the bad news out in the market today.

Greece is still in trouble and other countries are too.  Any trader that holds over the weekend, with another possible bad news event being released while the market is closed for 2 days, is gambling with fire.  Fear is back in the market and most people will sell first, and ask questions later.

While another sideways day is still possible tomorrow, I think we will fall to the 117.50 spy support level by Friday.  It could happen tomorrow, if the job's numbers aren't viewed positively?  Either way, the odds of a large up move are slim now, as the Bears have gained back a lot of power.

Best of luck to both the Bulls and Bears...

Red

s2Member®