Thursday, October 22, 2026
Home Blog Page 17

ES Morning Update October 16th 2024

0

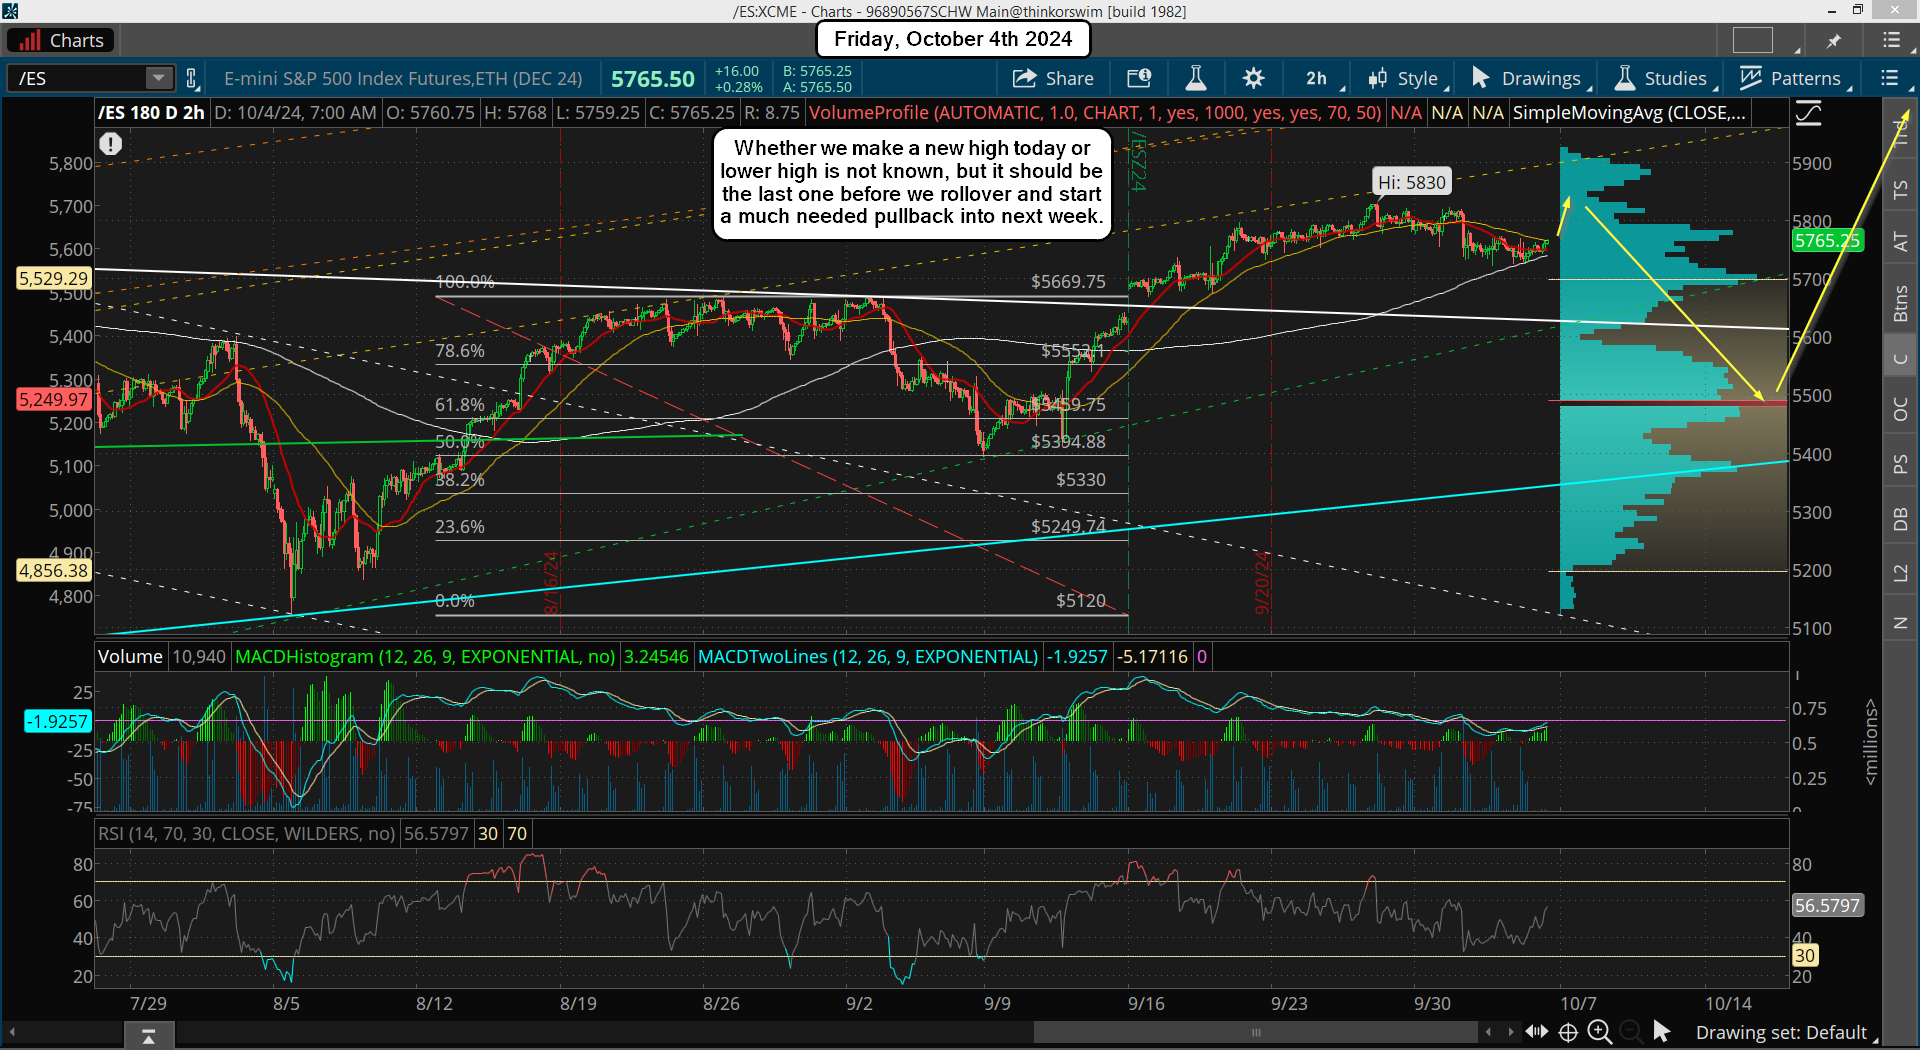
Ok, we finally got some supports break and it's looking like we have topped short term and we are starting the pullback for wave 4, which on my Main Wave Count is Small Wave 4 and on my Alternative Wave Count it's Tiny Wave 4.

In both cases the pullback should be to around the falling white trendline, and that's roughly the 5600 level on the ES. Maybe we stop shy and only reach the 5700 level where all the lows are at from the 10/2-10/7 period but usually they will hit the stops on the bulls first to shake them out and lure in bears looking for a deeper drop. From there (below 5700 down to 5600) they can bottom and then rally hard to over 6000, and that could very well be right into the election.

I think it will reach either the FET at 6082 or the FET at 6189, and that will complete a 5th wave up, which on both wave counts it will mark an important top that should be followed by a drop to my FP on the SPY of 483 in November/December. After that is where the wave counts diverge with the Main Wave Count marking the high as "the top" and a bear market to follow and the Alternative Wave Count having one more higher high first, like to my FET of 6435... then a bear market.

We'll cross that road when we get there. For the short term I'm looking for any bounces today to just be shorting spots as we drop into the 5600's for wave 4, which should unfold in an ABC pattern, and then a squeeze to new highs into the election with 6082 as the most likely target.

Have a blessed day.

ES Morning Update October 15th 2024

0

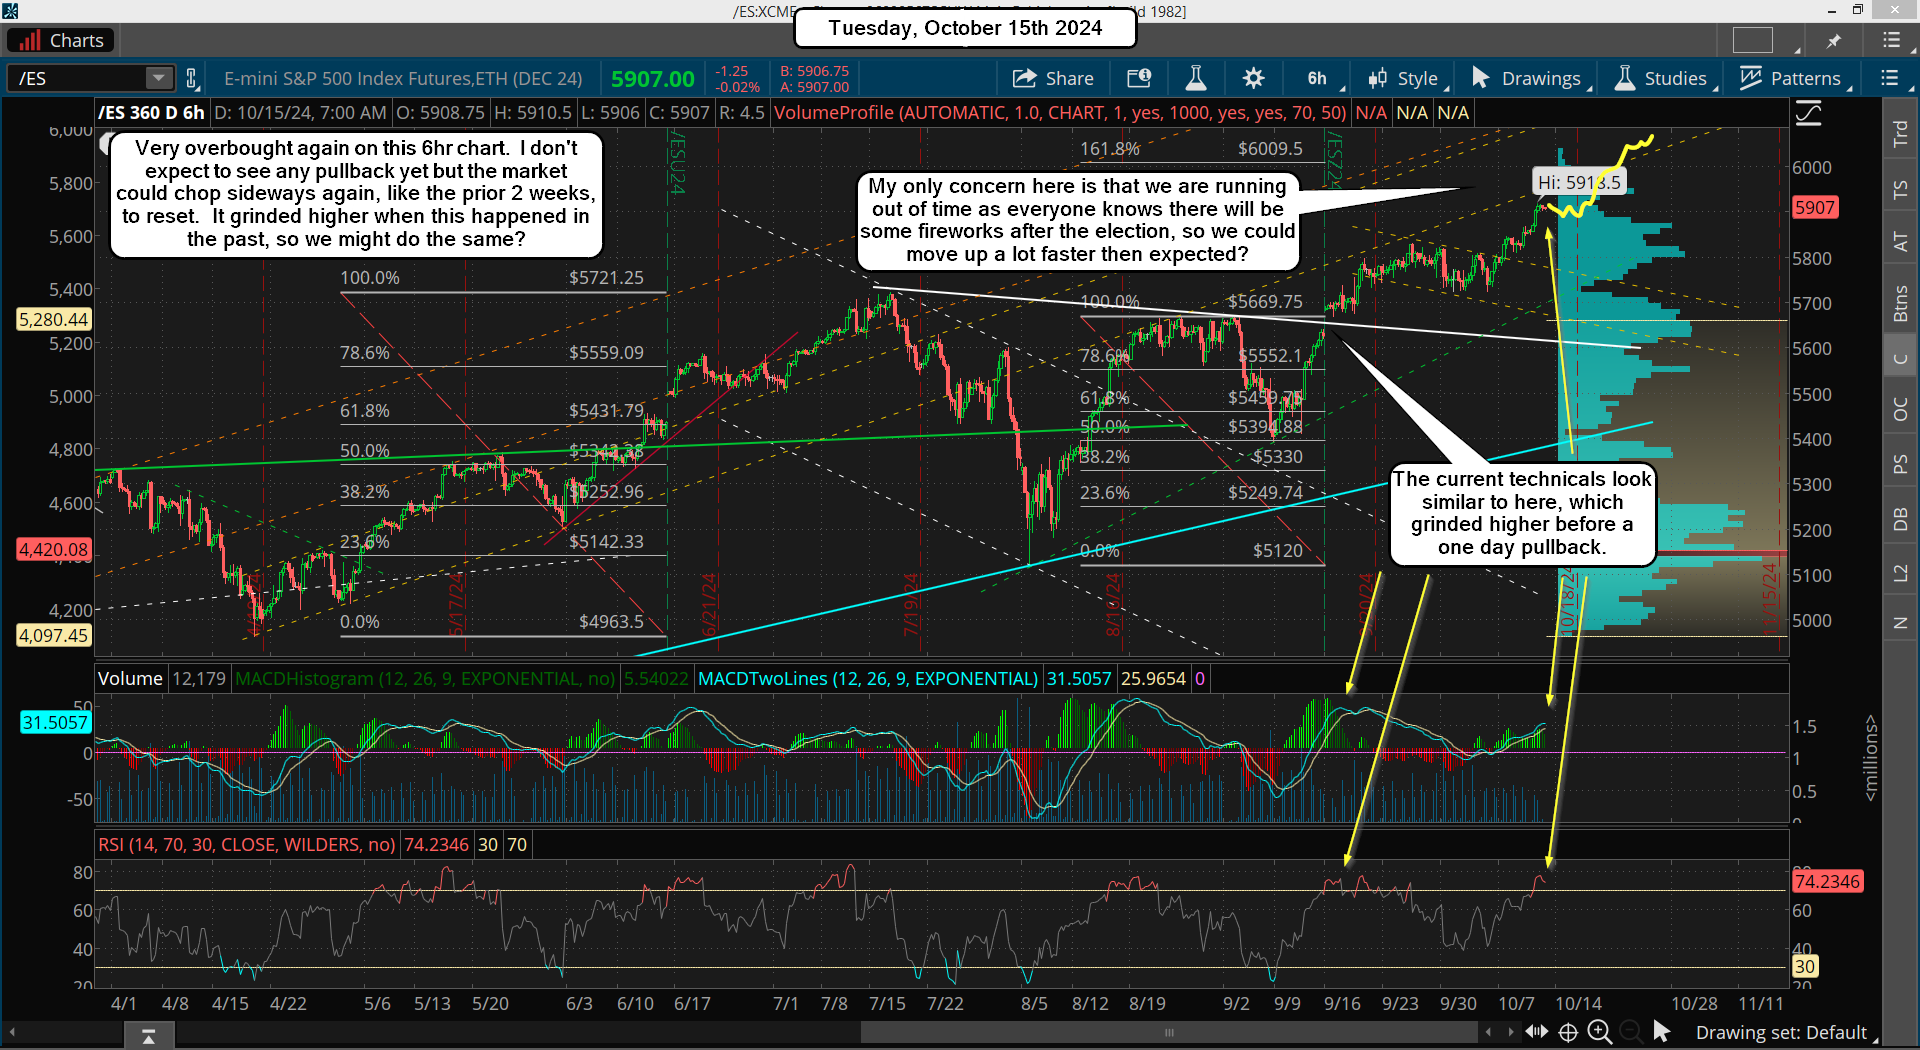
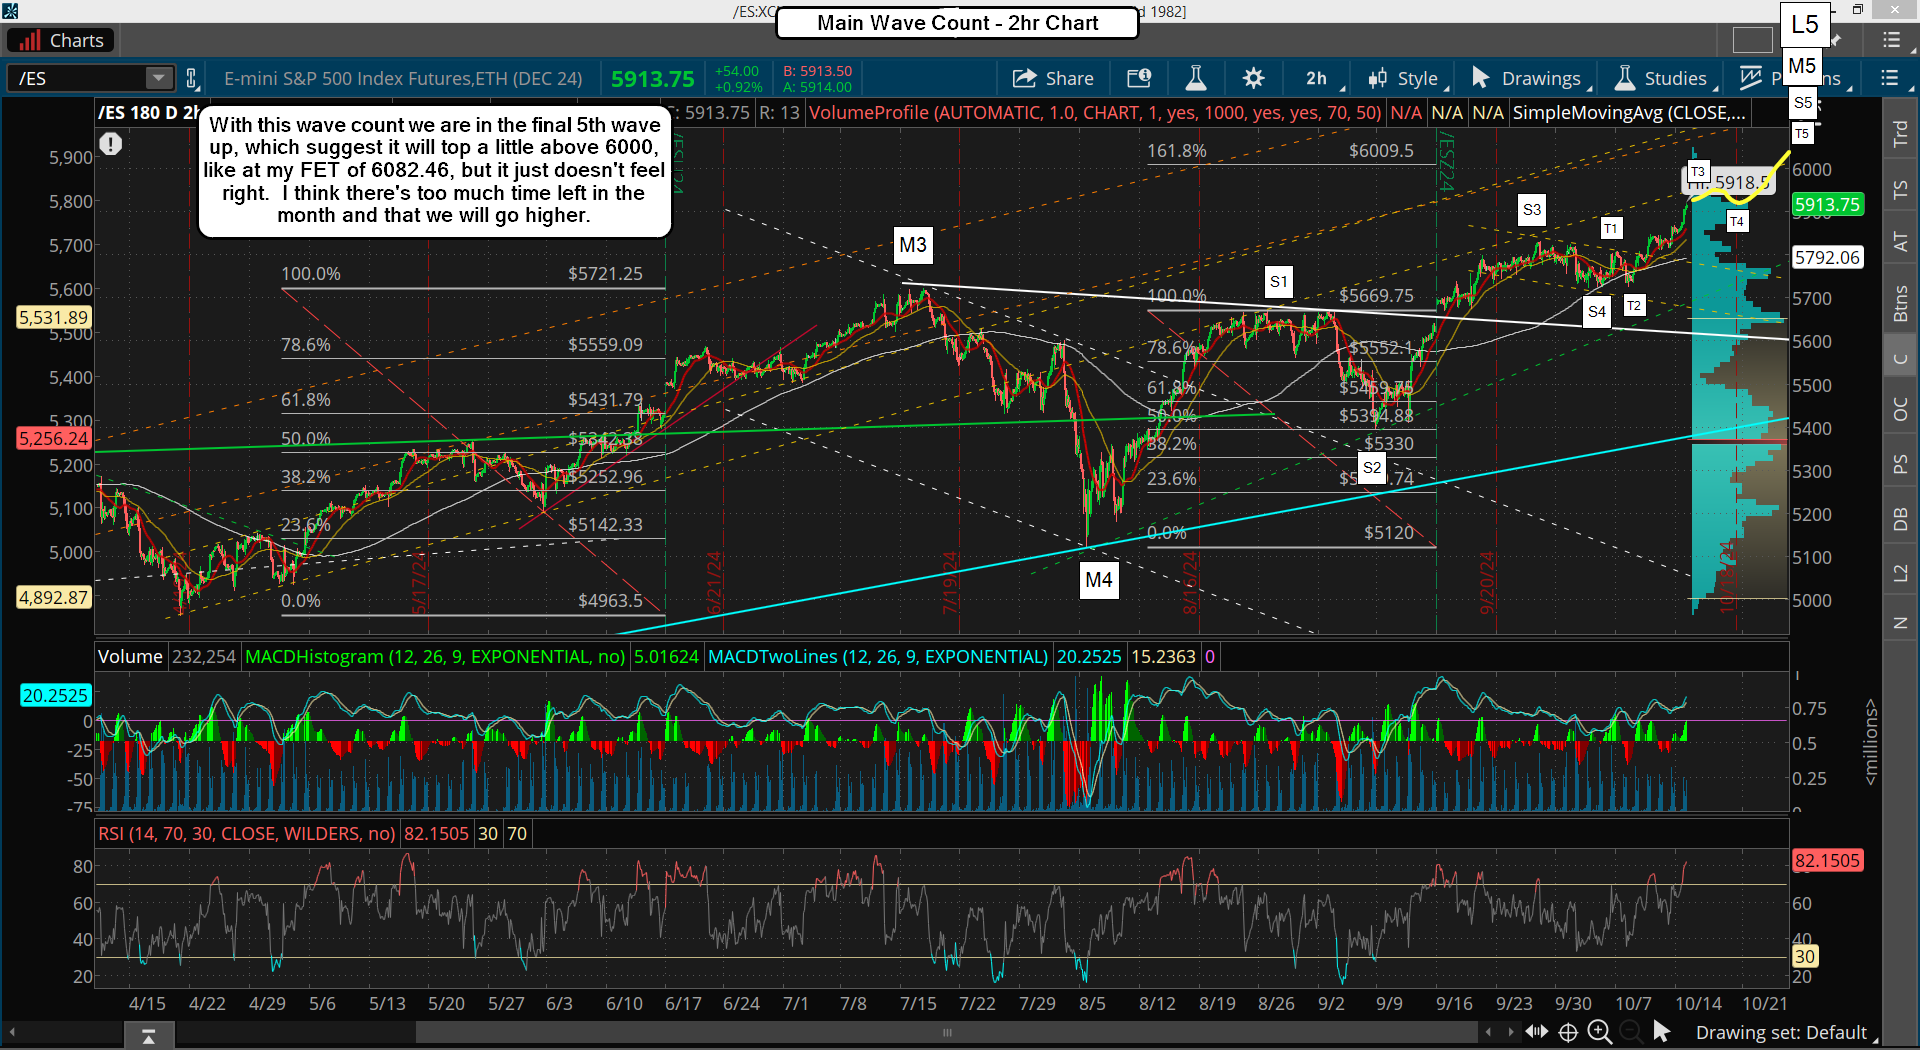
This market is just not looking like it's going to give the bears any chance at getting out with a small pullback. It's possible that the wave 4 down that I keep thinking is coming has already played out over the last couple of weeks as a sideways wave. If so, we are in the final 5th wave up now and any pullbacks from here will be small, like maybe 30-50 points? Below is the 2 hour chart with those adjusted waves on them.

With this main wave count we are in the final 5th wave up, which suggest it will top a little above 6000, like at my FET of 6082.46, but it just doesn't feel right. I think there's too much time left in the month and that we will go higher. Below is an alternative wave count that explains it better.

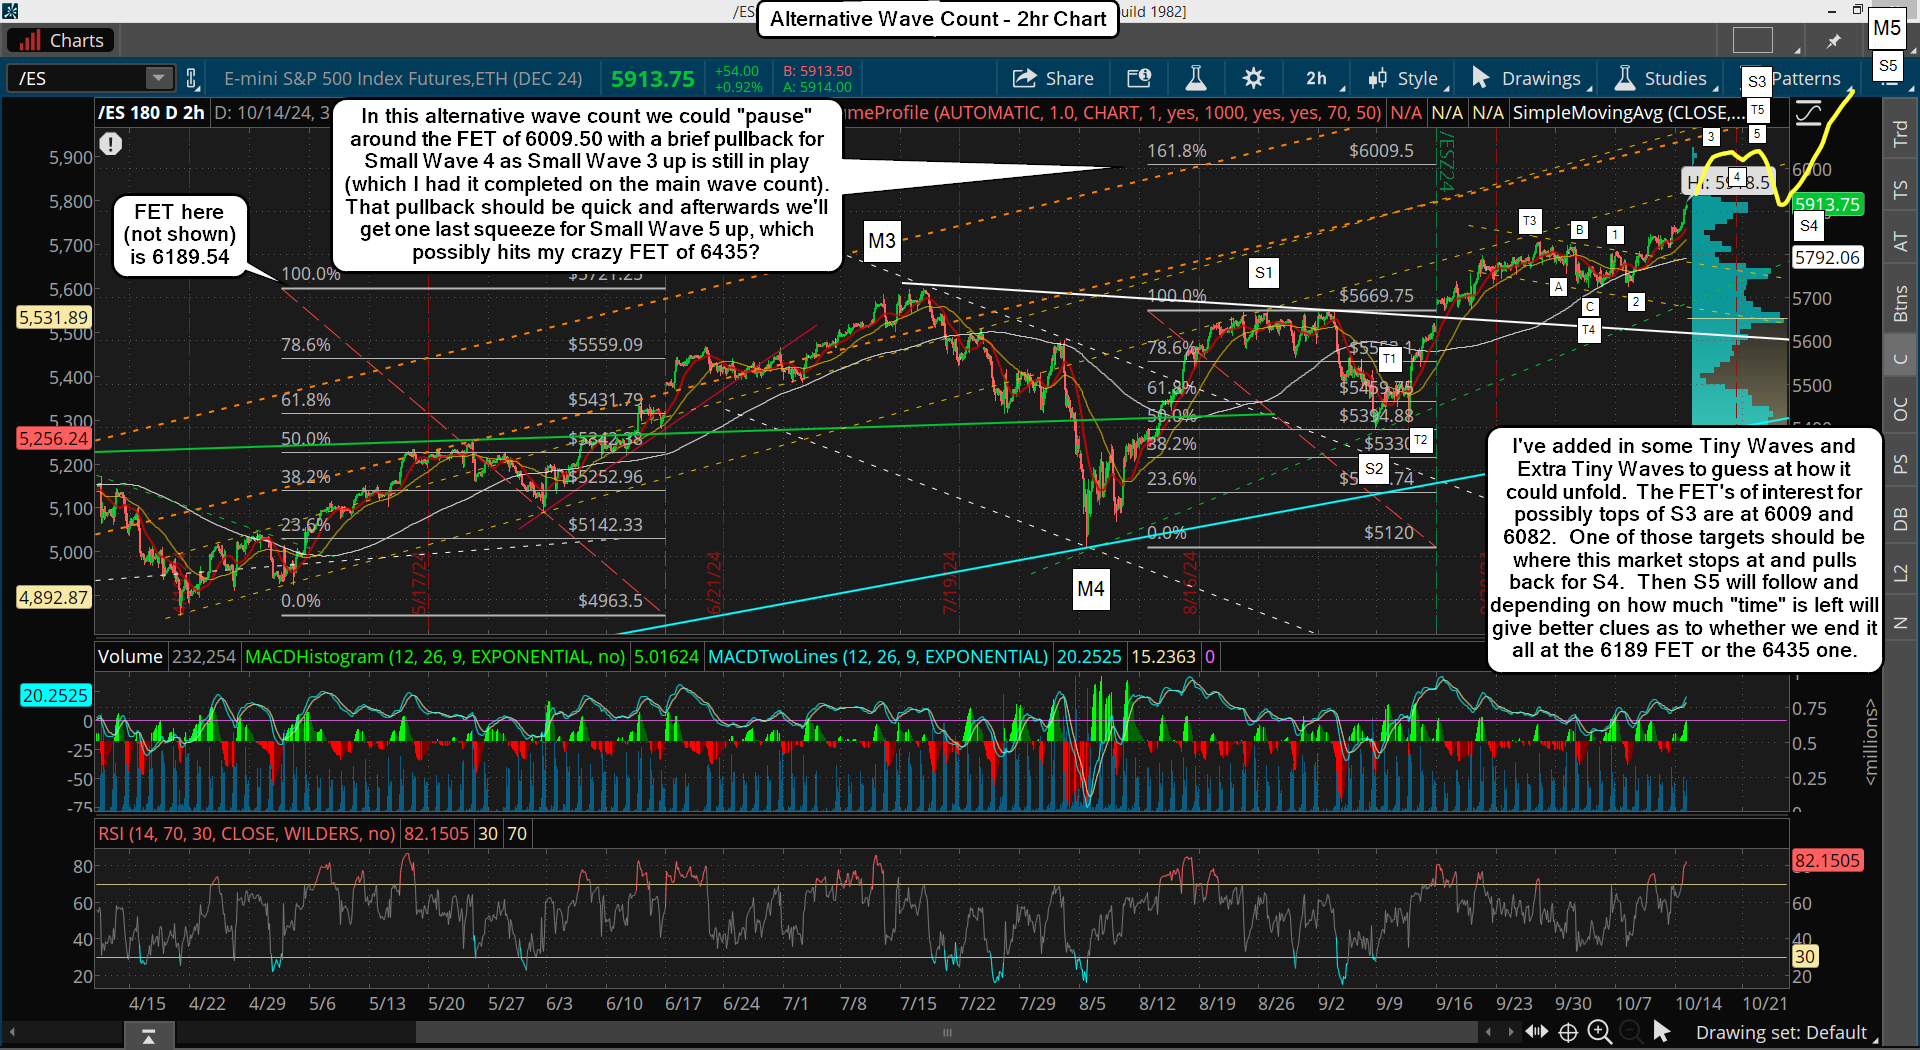
In this alternative wave count we could "pause" around the FET of 6009.50 with a brief pullback for Small Wave 4 as Small Wave 3 up is still in play (which I had it completed on the main wave count). That pullback should be quick and afterwards we'll get one last squeeze for Small Wave 5 up, which possibly hits my crazy FET of 6435?

That FET is based on shorter moves of course, and may or may not be the level it stops at before a pullback for Small Wave 4, which the other FET of interest is 6082, as I covered on yesterdays long post.

I've added in some Tiny Waves and Extra Tiny Waves to guess at how it could unfold. The FET's of interest for possibly tops of S3 are at 6009 and 6082. One of those targets should be where this market stops at and pulls back for S4. Then S5 will follow and depending on how much "time" is left will give better clues as to whether we end it all at the 6189 FET or the 6435 one.

Lastly I want to point out that the Nasdaq, both cash and futures, are quite close now to making a new all time high.  The coming double top with them is likely going to line up with the ES hitting one of my Fibonacci Extension Targets, which I'd lean toward the 6082 one, possibly the 6189, but I give it lower odds.

So, once we see the NDX and/or the /NQ hit (slight pierce) a new all time high we should be close on the ES to the FET of 6082, and that should be the point where we (finally) get a pullback for wave 4, and then one more squeeze up into the end of this month (or the election?) to reach either my FET at 6189 or 6435.

Have a blessed day.

ES Morning Update October 14th 2024

2

(Note:  I've changed the degree of the waves some in this update as I was wrong on them the last several weeks.  I was labeling expected Small Wave 4 down as Medium Wave 4, which is now corrected on new charts).

At this point I'm starting to think that we will NOT get any pullback  until either right before the election or right after it. Meaning they are going to chop everyone to death in a tight range (a hundred or so points?) until at least the end of this month, which is where we might drop into the election for Small Wave 4 down.

Or we wait until the day after and that's where we get the drop, which will be very fast and end by the middle of the month. Then we rip to 6000+ into the end of the year to reach one or more of my Fibonacci Extension Targets, which all of them are above 6000.

So, will the market reach 6000 before the coming pullback? I personally don't think it will because it's too obvious of a magnet. I think it falls short of it and does the drop first... then the year end rally takes us to 6000+ for the final blow off top. Between now and the election we should chop with some fake out drops that last a day, then reverse back up to the same level.

The 1 Hour Chart...
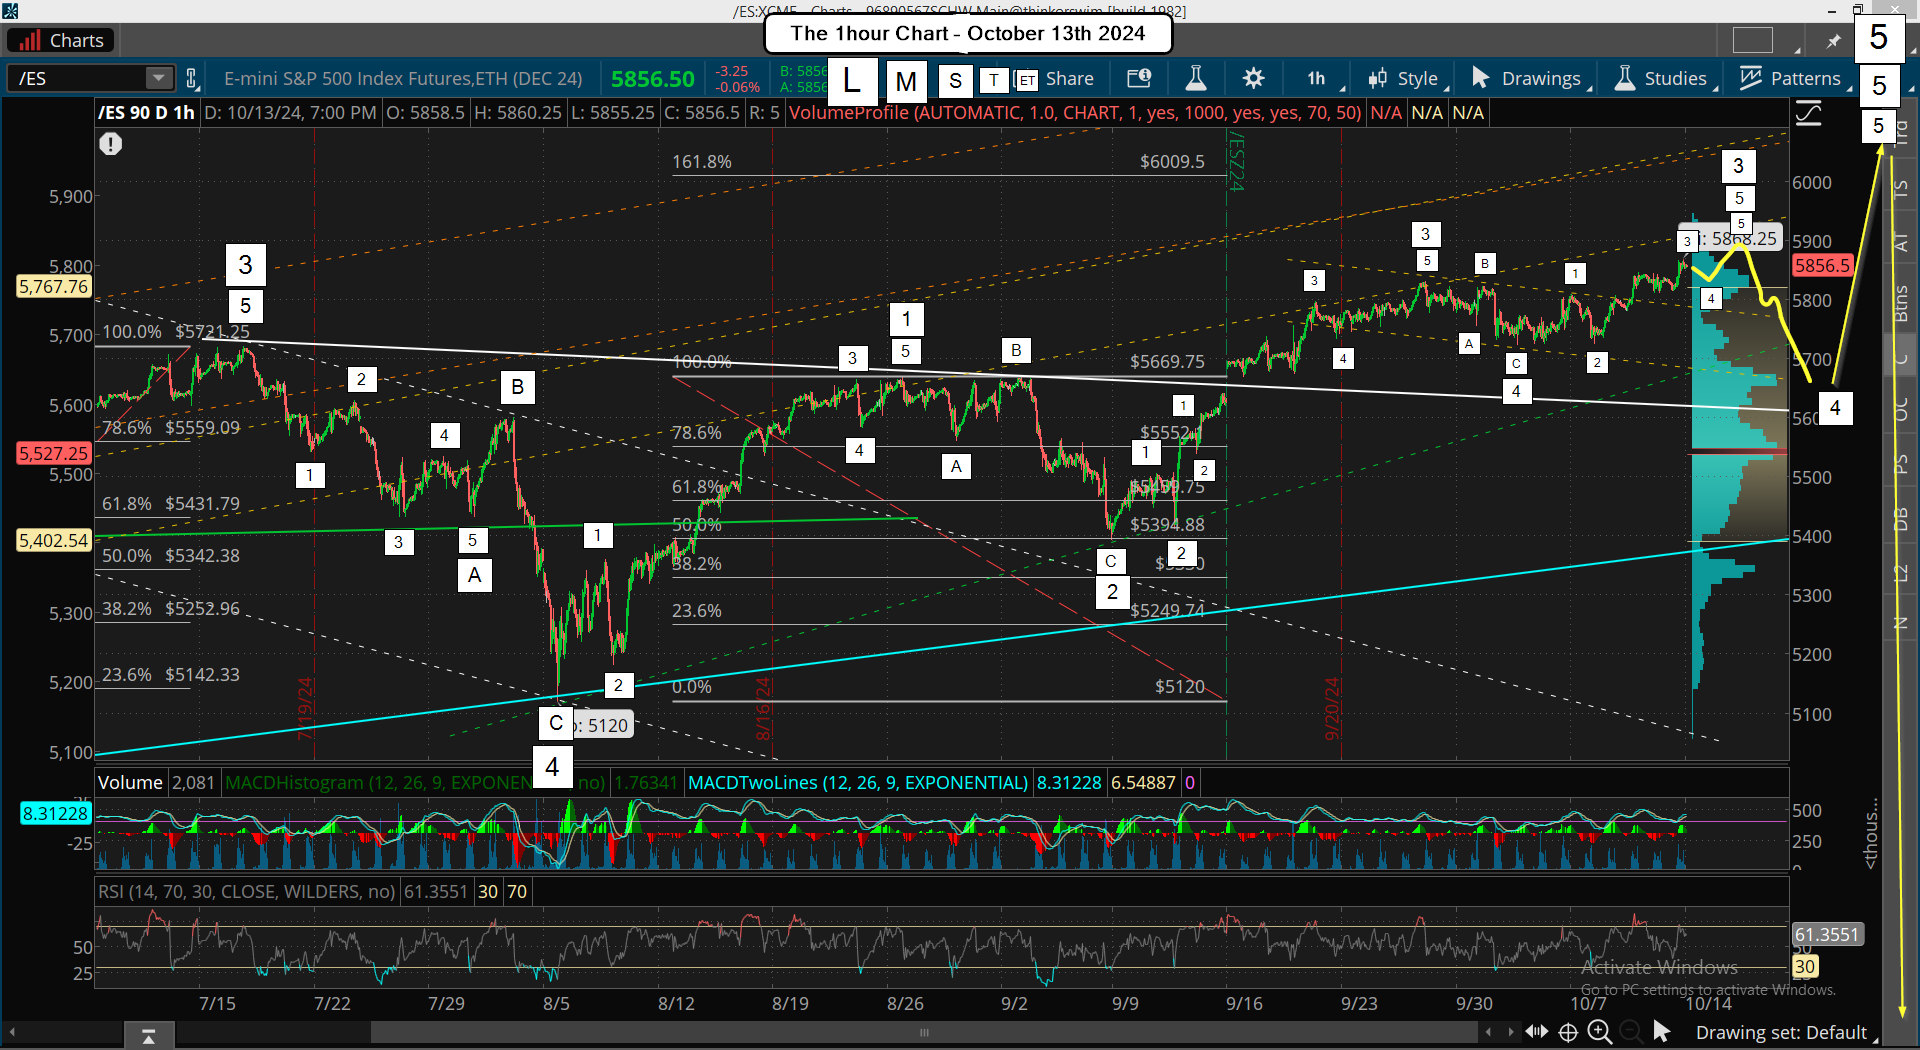
Then at some point, which I think will be right before the election, we'll get the drop for Small Wave 4 down.  I think it will be a higher low then the September low (around 5400).  Usually wave 2's and 4's of ALL degrees are some Fibonacci Level (23.6% or 38.2% are common and sometimes 50%) and they are simply calculated from different points based on their degree.

Meaning that the pullback for that Small Wave 2 down was calculated from the August low, which is Medium Wave 4, up to the first high inside Medium Wave 5 for Small Wave 1... which was the early September high.  The pullback there was about 50% for Small Wave 2 down and from that low we've been in Small Wave 3 up ever since.

The 6 Hour Chart...
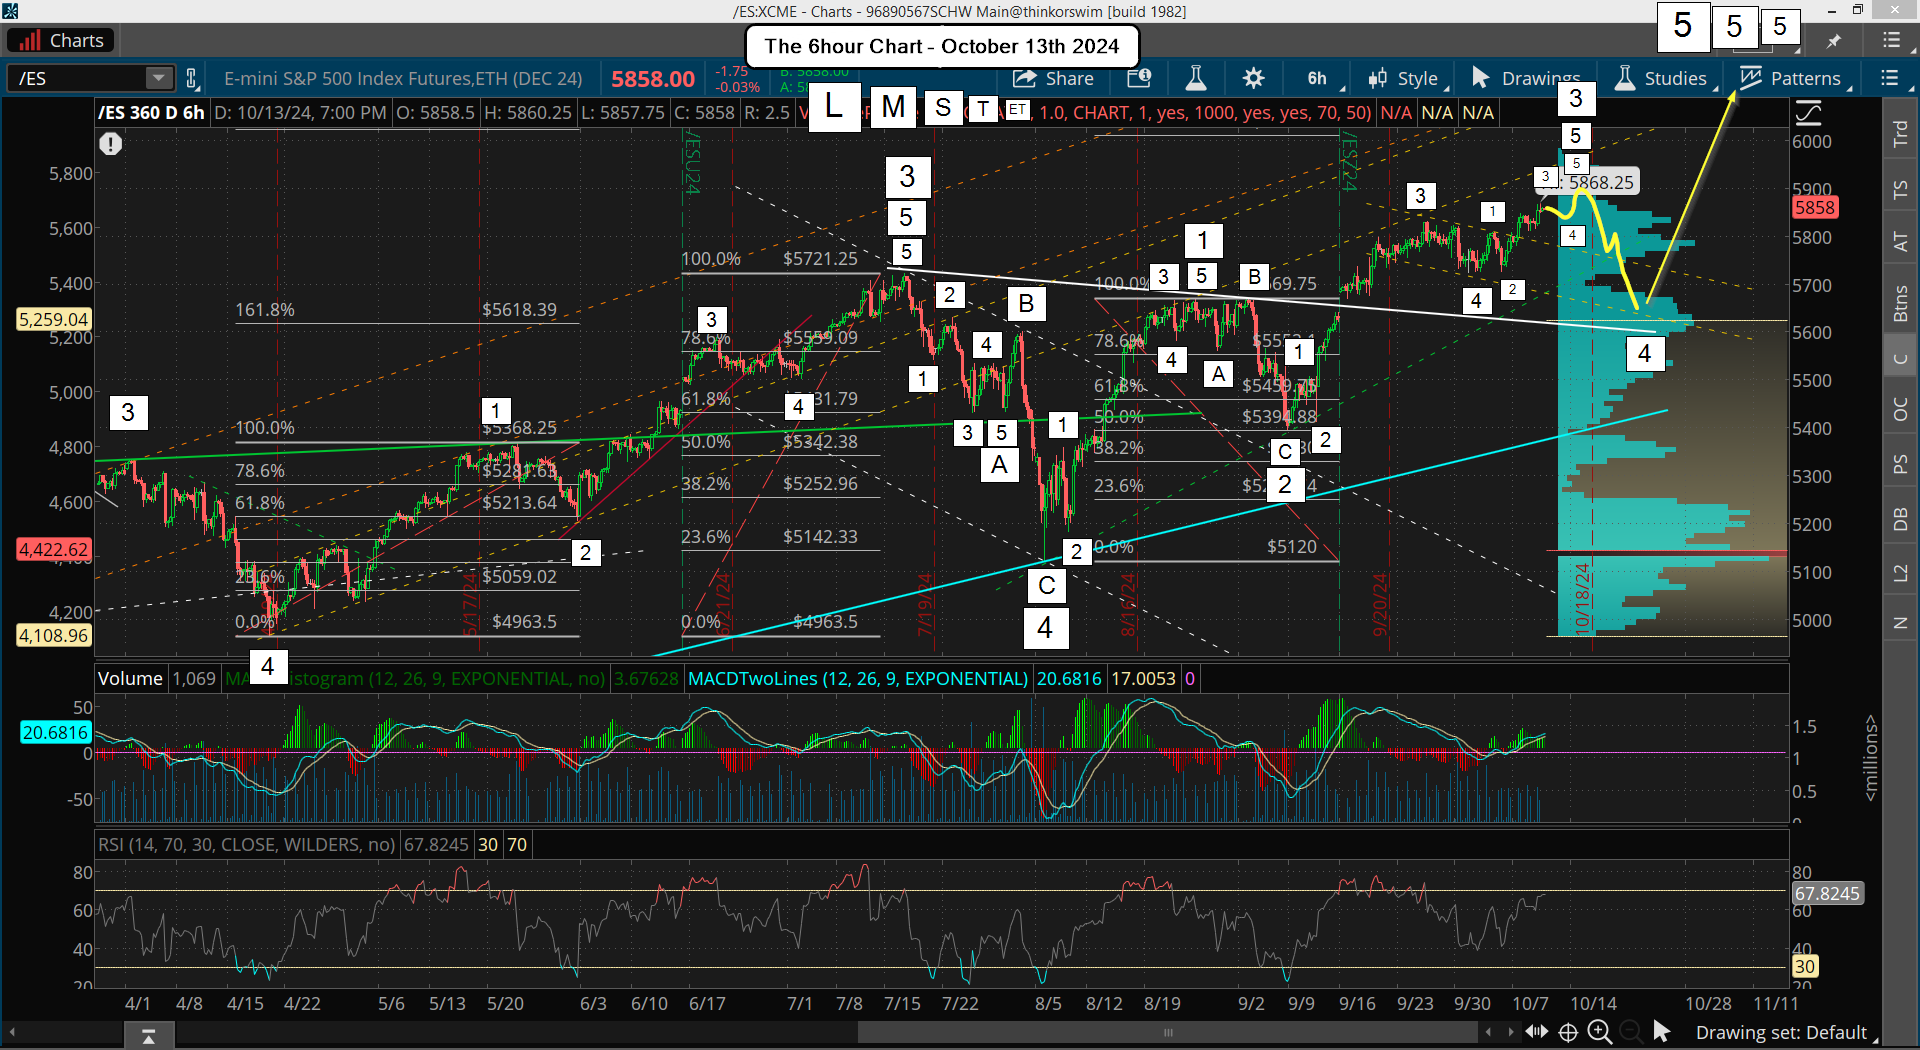
Once Small Wave 3 up finishes, which should be before the end of this month I think (maybe this week?), or it could drag out right into the election, (I doubt it though as that's too obvious as it's a repeat of election day in 2016), we should see Small Wave 4 down happen.  It should be some Fibonacci Level retracement from the start of Medium Wave 5 up, which is at the August low of 5120.

If for example we top at 5920 in the next few weeks that's an 800 point rally up, so at most we could see 400 points down for the pullback if it's a 50% retracement, or less if it's only 38.2%, and even less if only 23.6%... which is not even 200 points down.  It's certainly possible that we see only a small amount of points, but I think we'll at least take out any stops below the lows of the last several weeks.  That's roughly the 5700 level, so I think the target is somewhere between 5500 and 5700 for the coming pullback of Small Wave 4 down.

After it's finished we should rally hard and fast to reach much higher levels above 6000 as you know they won't stop right at that obvious target.  I don't know how long that will take though as it depends on when we get the pullback for Small Wave 4 down.

If it comes this week then the big last squeeze up could go right into the election, who knows for sure?  I'm just focused on seeing that pullback for Small Wave 4 at some point soon and then Small Wave 5 up is the blow off top that will last as long as it last.  It might drag into the end of the year and nothing much happen around the election?  I doubt it though as it's super important and should cause the market some kind of volatility.

Now this thought is a "wildcard" one but what if we get the pullback for Small Wave 4 this week and rally up to 6000+ into the election to complete Small Wave 5, Medium Wave 5 and Large Wave 5?  That would setup the election as the big top before a very large drop, which could very well be down to the two FP's on the SPY from earlier this year?  But the rally up afterwards would only be for a lower high into early January and NOT the start of another bull market run that lasted for several years after election day in 2016.  So it would be different afterall.  Remember that it was not even a one day drop back then as it was in the futures market basically.  If we drop to the 483 level that will take a week or two to happen as it will be from 6000+ and that kind of a move down can not happen in one day.

Ok, that's my thoughts going forward into the end of this year.  It's subject to change of course as it's always just a best guess.  I'll add one more thing that could happen, which is more of a "big picture" scenario.  While everyone is expecting a recession (or depression) in 2025 I think they could all be wrong and right but be tricked on how it unfolds.

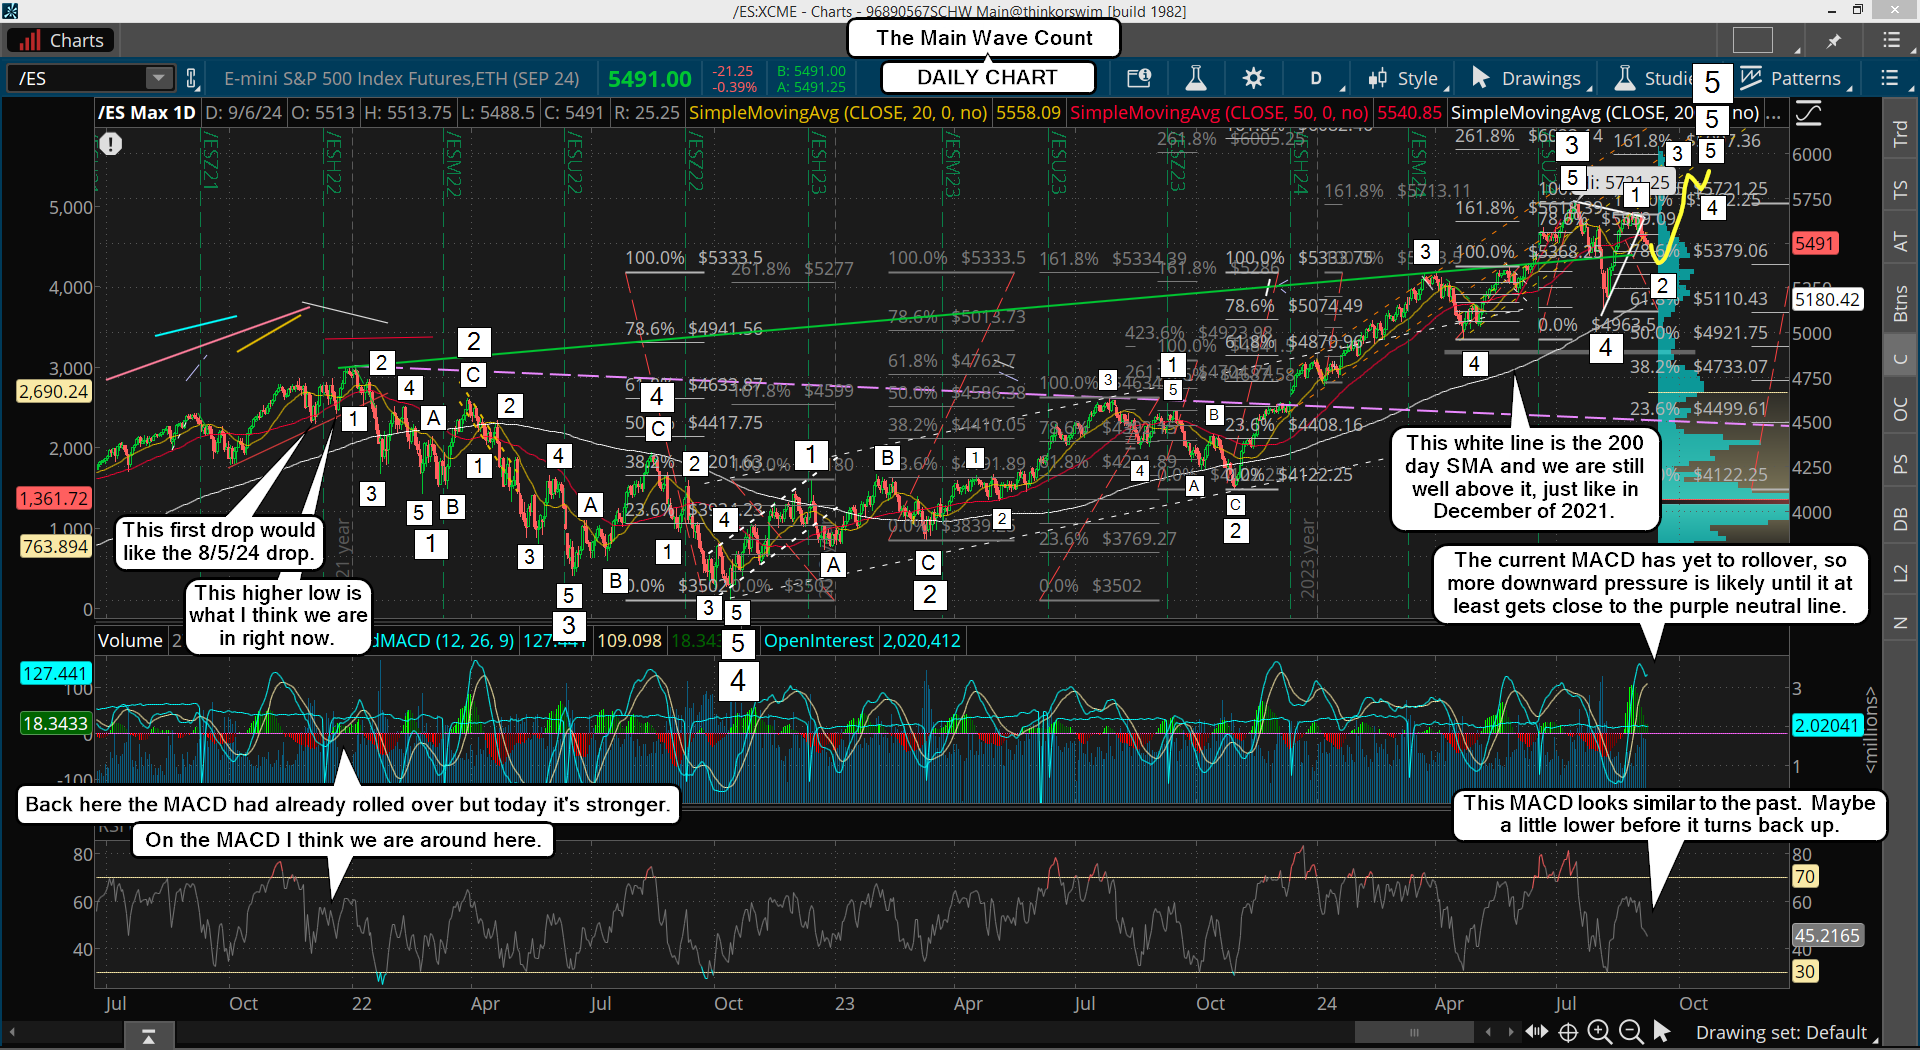
The Daily Chart...
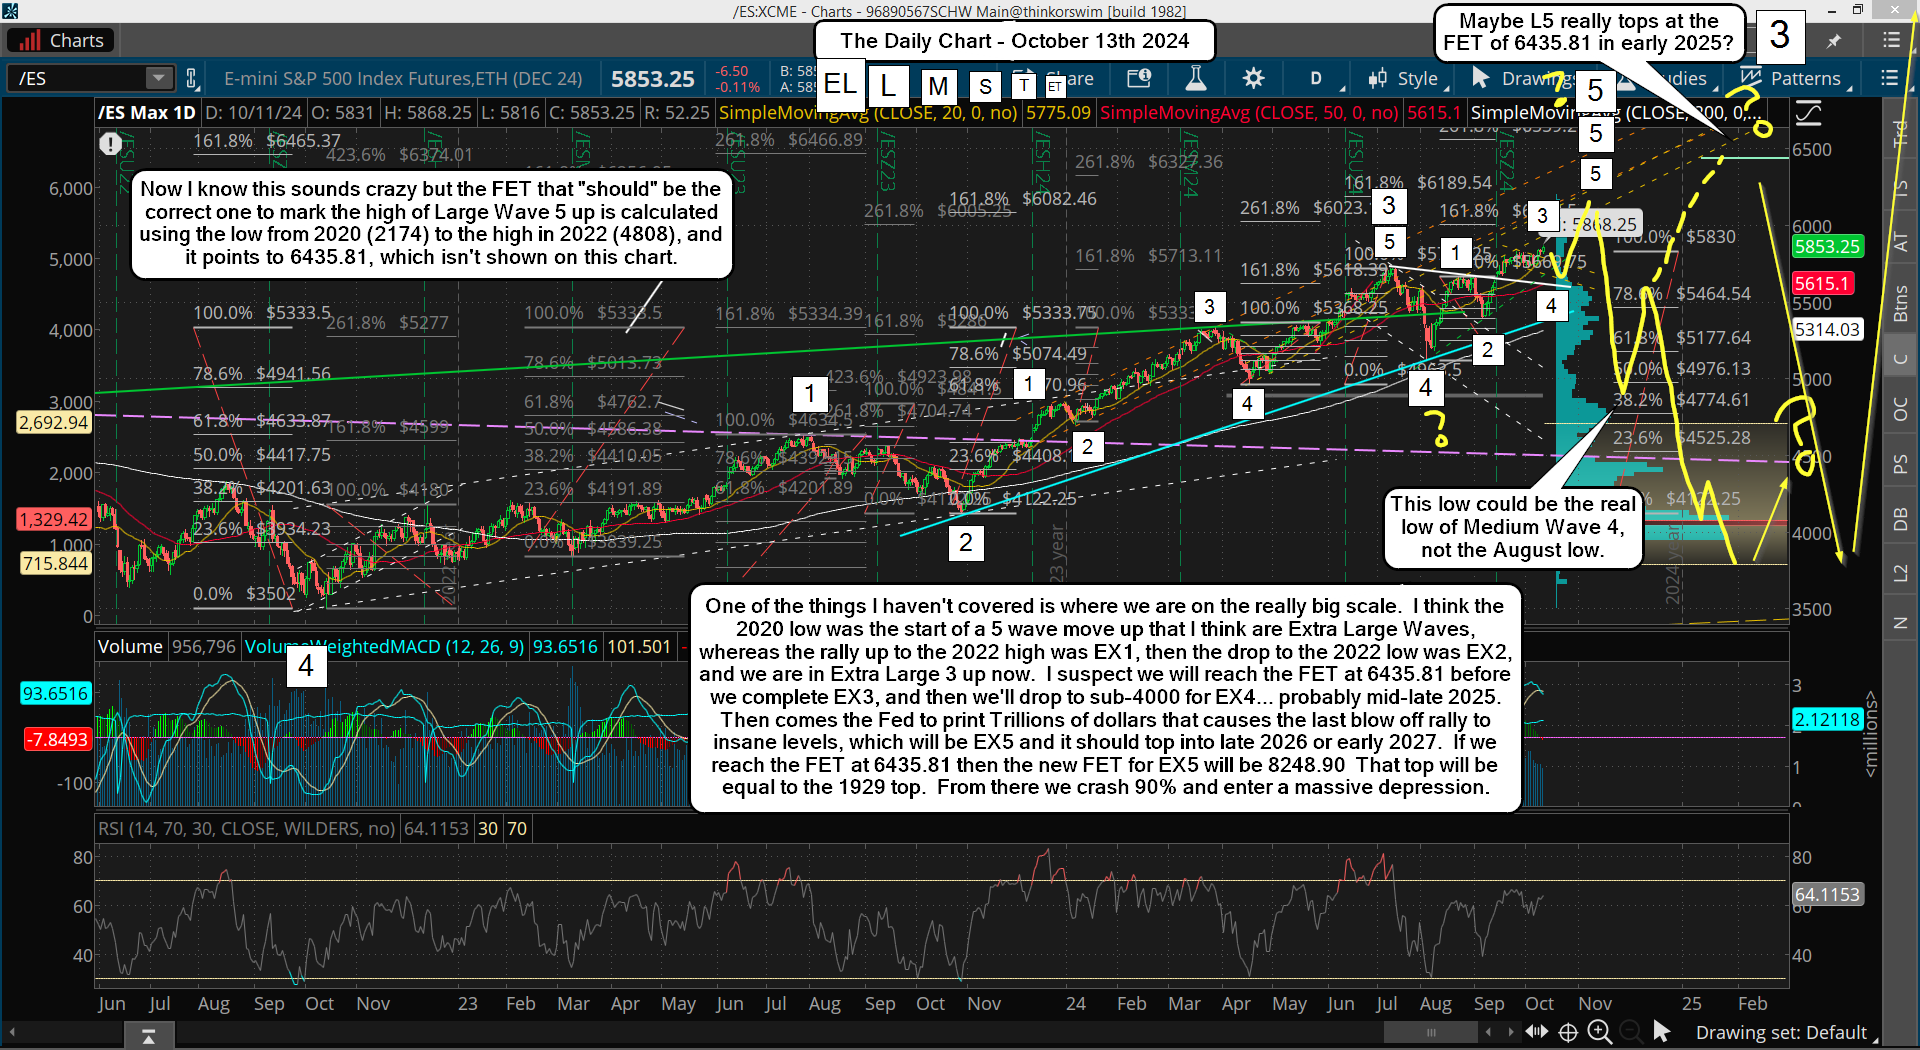
I've drawn some alternative paths that could happen into the end of this year and early 2025, which not many will see coming.  If we drop to the FP on the SPY of 483 after the election then everyone will short the rally back up.  But if we haven't hit the FET of 6435 before that drop (and I don't think we will) then we could squeeze into early 2025 to reach that level, and then drop to sub-4000 the next half of the year.

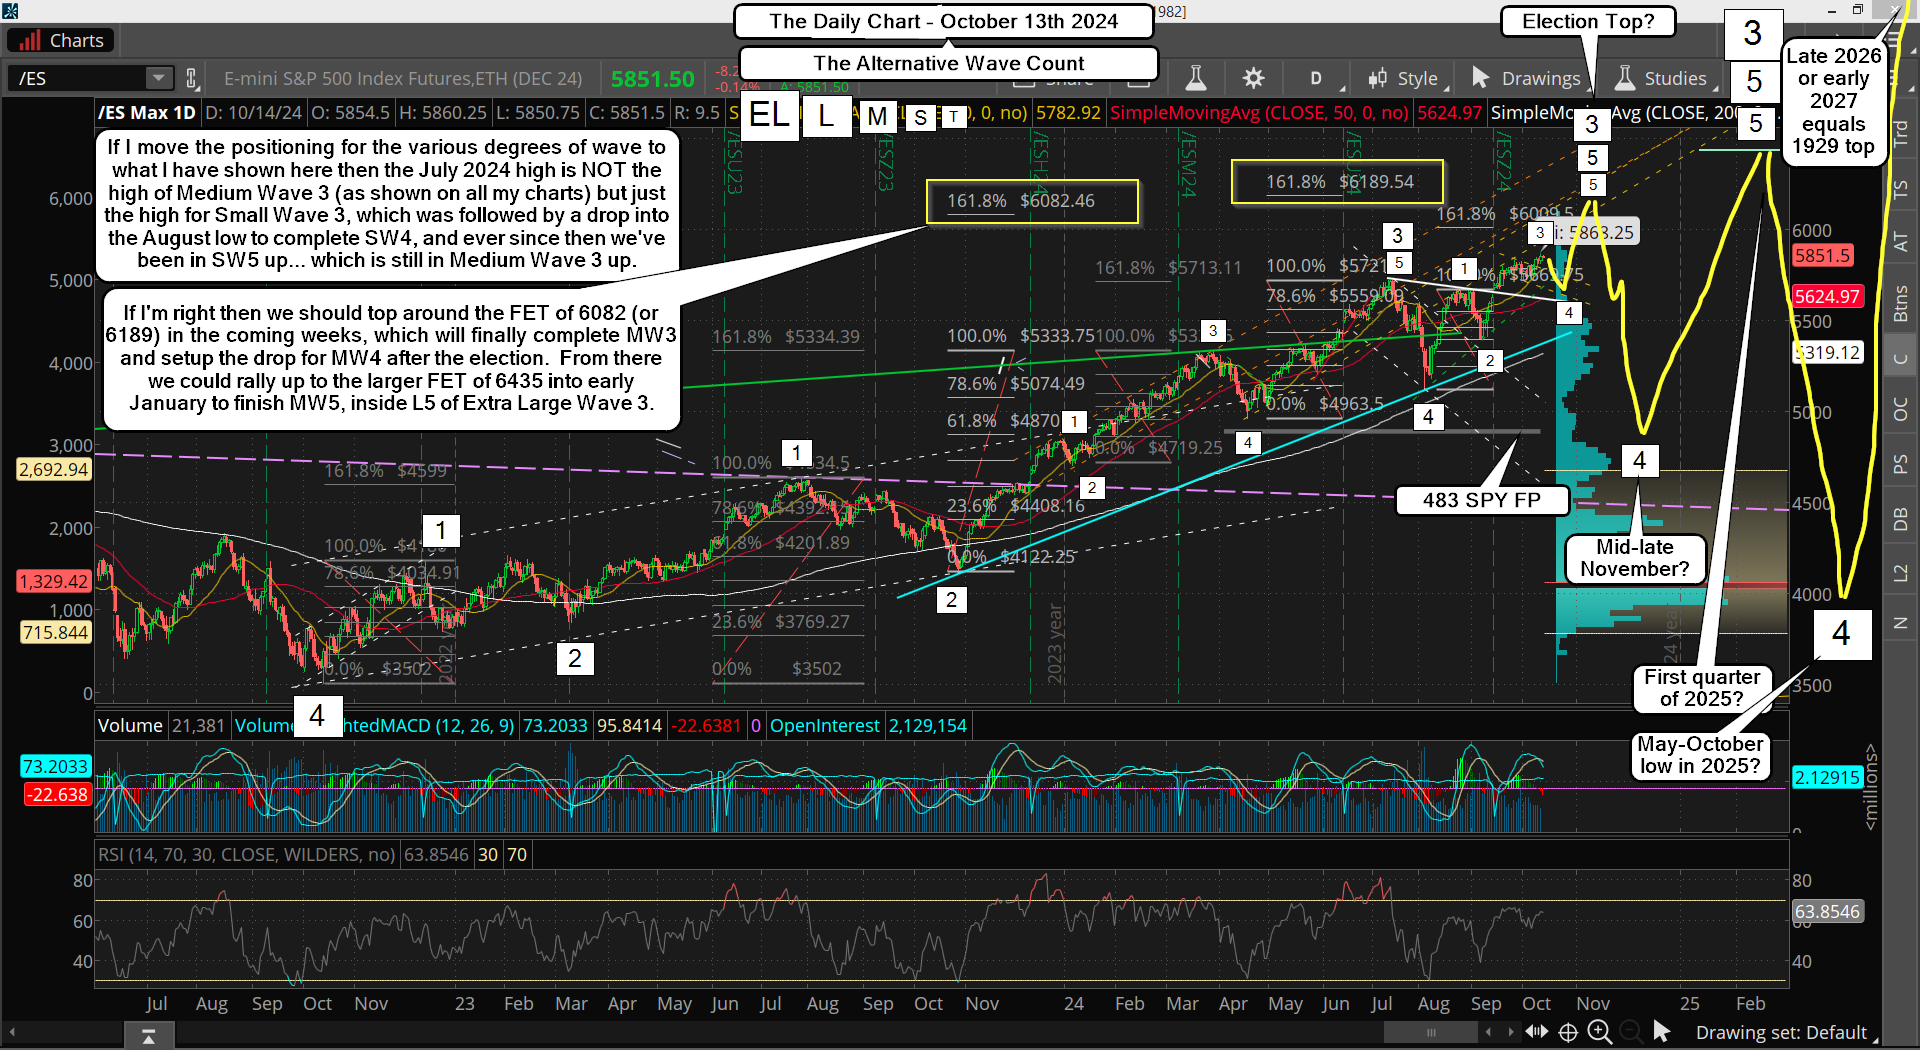
That would fool a ton of people as if you get close to the 2022 low of 3502 everyone will think it's going to be taken out.  But if I'm right we should bottom before that level for Extra Large Wave 4 and then have one more 2 year rally for Extra Large Wave 5, which might reach 8248.90 (a new calculated FET if 6435 is hit).  This is all just more "food for thought" but it's very possible that it plays out something like this, and the chart below shows the alternative wave count.

The Alternative Wave Count...
Have a blessed day.

ES Morning Update October 11th 2024

2

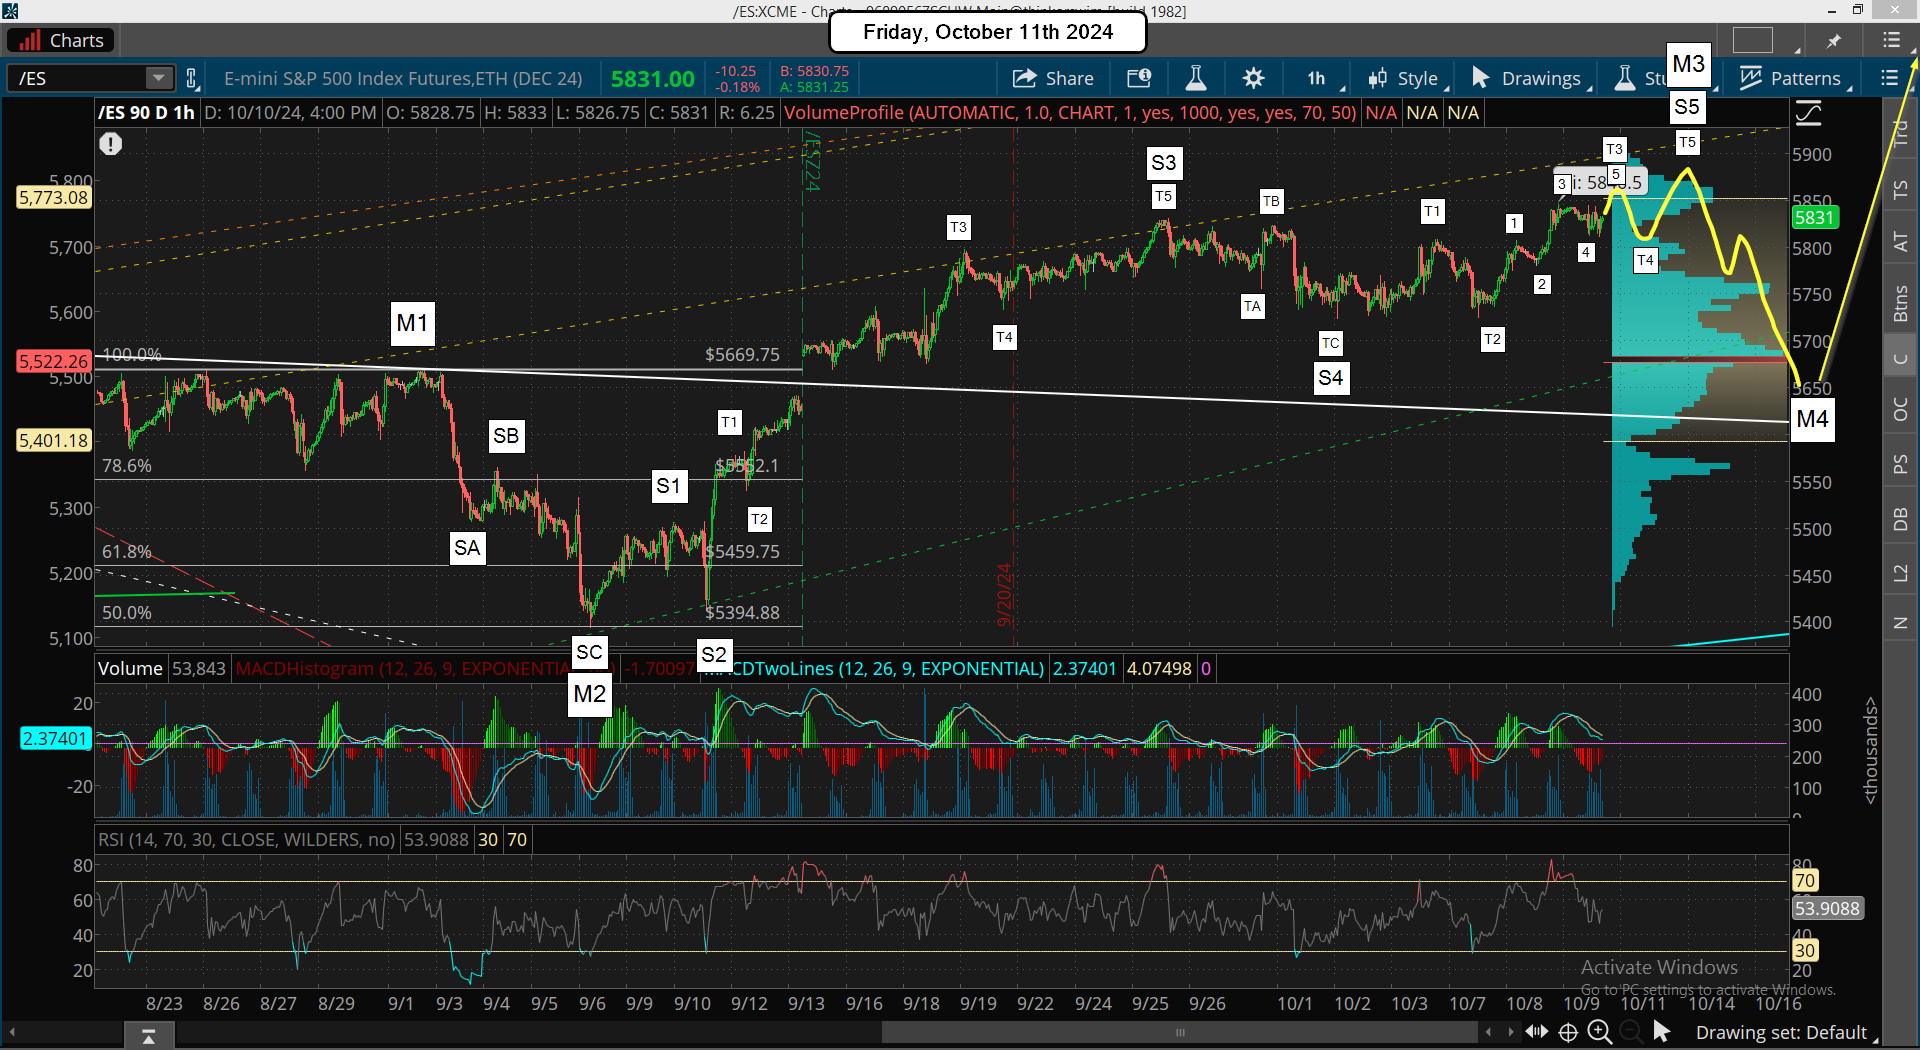
A big dud yesterday as the CPI did nothing to move the market down. But all the technicals still suggest a pullback is coming prior to the last big rally up to 6000+ into the end of this month early November. When will it happen is the tough question as I thought it would happen last week but it's just dragging out longer then I expected. As far as the wave count, here's an updated chart...

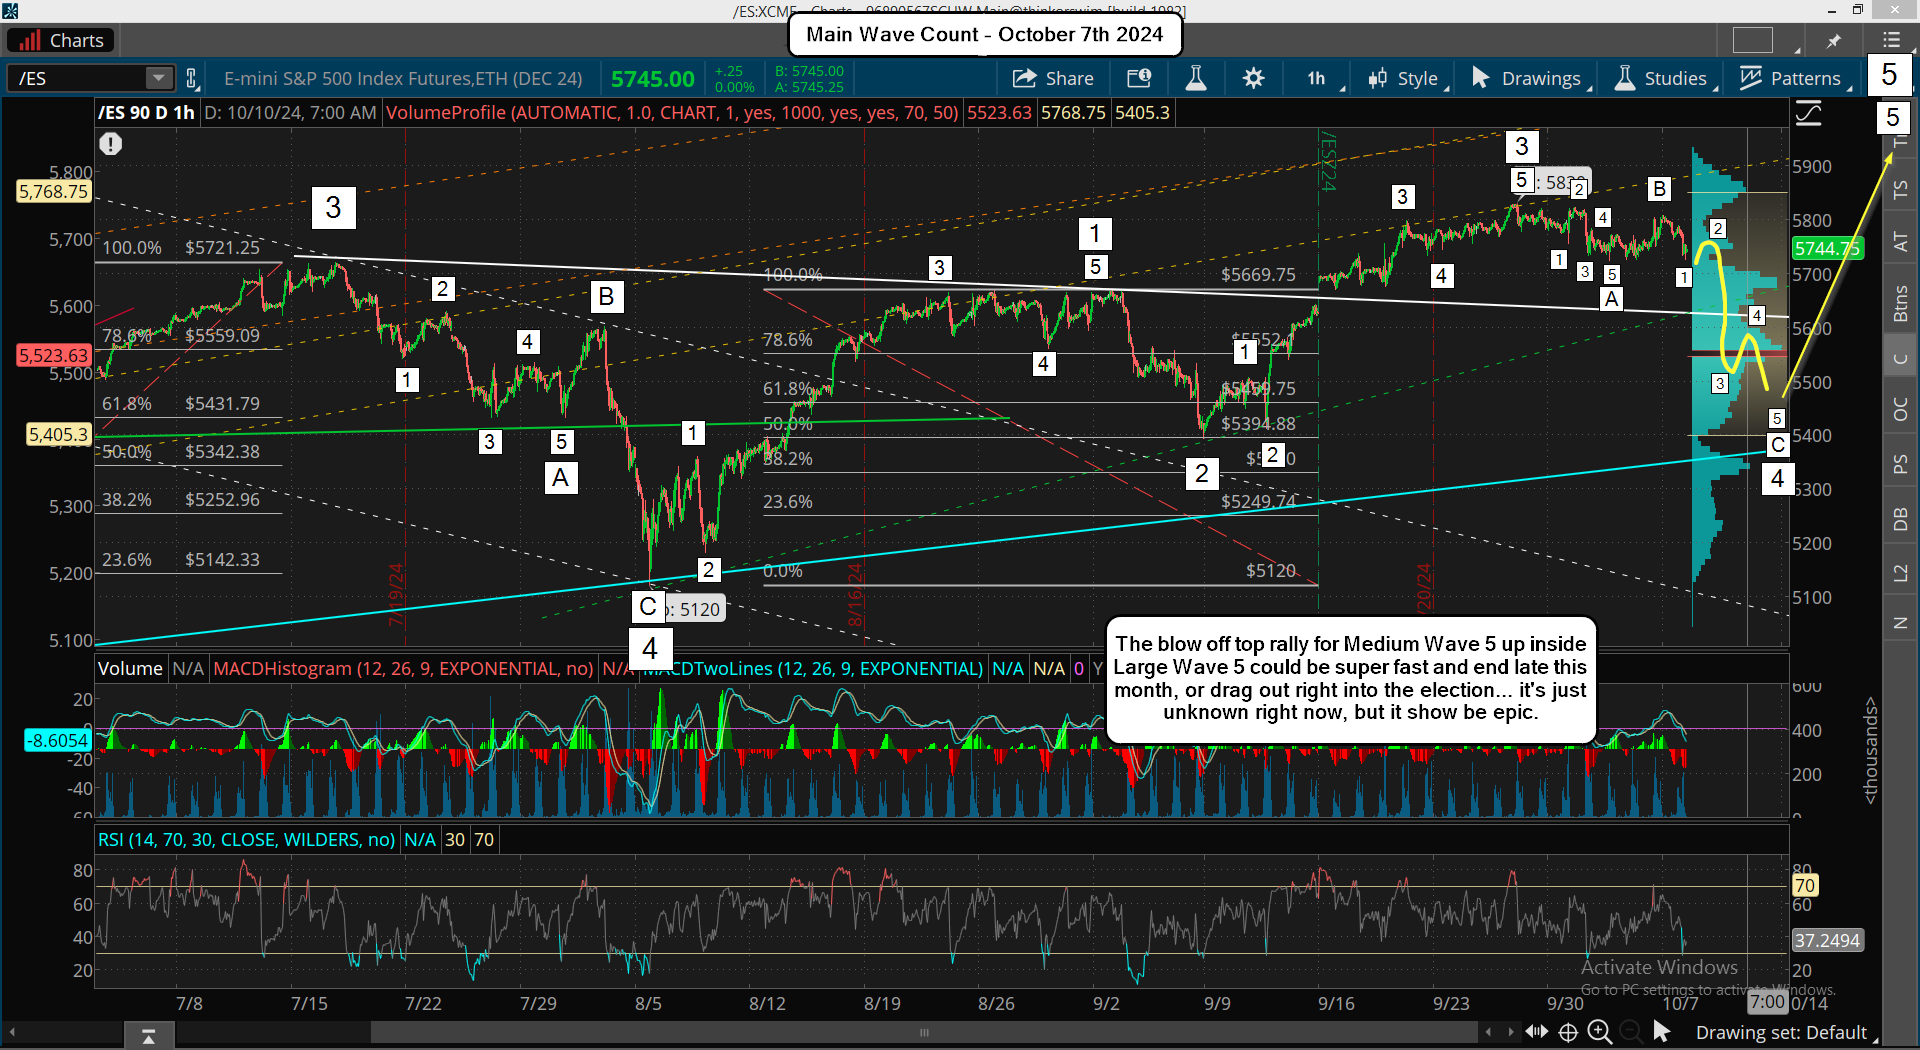
Basically, we are still in Medium Wave 3 up instead of it ending at the prior 5830 high. The choppy sideways action that last week or so could not have been Medium Wave 4 down as it was too small in points, so it was likely just Small Wave 4 down with the 5830 top just being the high for Small Wave 3 up. It means we are in Small Wave 5 up now, which will just complete Medium Wave 3 up. Once finished we'll see Medium Wave 4 play out, which still should be an ABC as it's a larger degree wave and should have smaller waves inside it.

On the short term I think we are inside Tiny Wave 3 up from the 5725 low on 10/7, which was the end of Tiny Wave 2 with Tiny Wave 1 up ending at the 5808 high on 10/6. That means Small Wave 4 down, inside Medium Wave 3 up, ended at the 10/2 low of 5724. If this count is correct we have another higher high coming today or Monday to complete to end Tiny Wave 5, like 5860-5880, which will end Small Wave 5 and Medium Wave 3. Then we should see Medium Wave 4 down happen into the end of next week most likely. After that it's straight up in Medium Wave 5 to 6000+ into the election.

Have a great weekend.

ES Morning Update October 10th 2024

2

Yesterdays rally up to a new high fooled me. I was looking for that move last week after the non-farm payroll report but instead they just did it as we go into the CPI this morning. It's now ran a bunch of stops above the prior high, and could go a little higher to hit more with some knee-jerk reaction from the CPI, but after that I just don't see the move continuing to 6000+ without some kind of pullback first.

Obviously this changes the short term wave count as now this new all time high is the Small Wave 5 up inside Medium Wave 3, which I had moved to have topped at the 9/26 high. Clearly that's not the case and the sideways chop the last week or so has been Small Wave 4 and we are in Small Wave 5 up now. Once it completes, which should happen after the CPI's shakeout, fakeout moves, Medium Wave 3 will finish too, and we should see Medium Wave 4 down follow.

I still think the move is coming before 6000+, and that it should be very short lived, like 2-3 days max. The downside target is still the same, which is somewhere between 5550-5600 on the ES. We've seen drops like this before and it could all be finished in one day, I don't know? But the faster it happens the more bears will short it and that means the move up afterwards will be that much stronger as well. Let's just see what happens.

Have a blessed day.
List Of P-Diddy's Guests...

ES Morning Update October 9th 2024

0

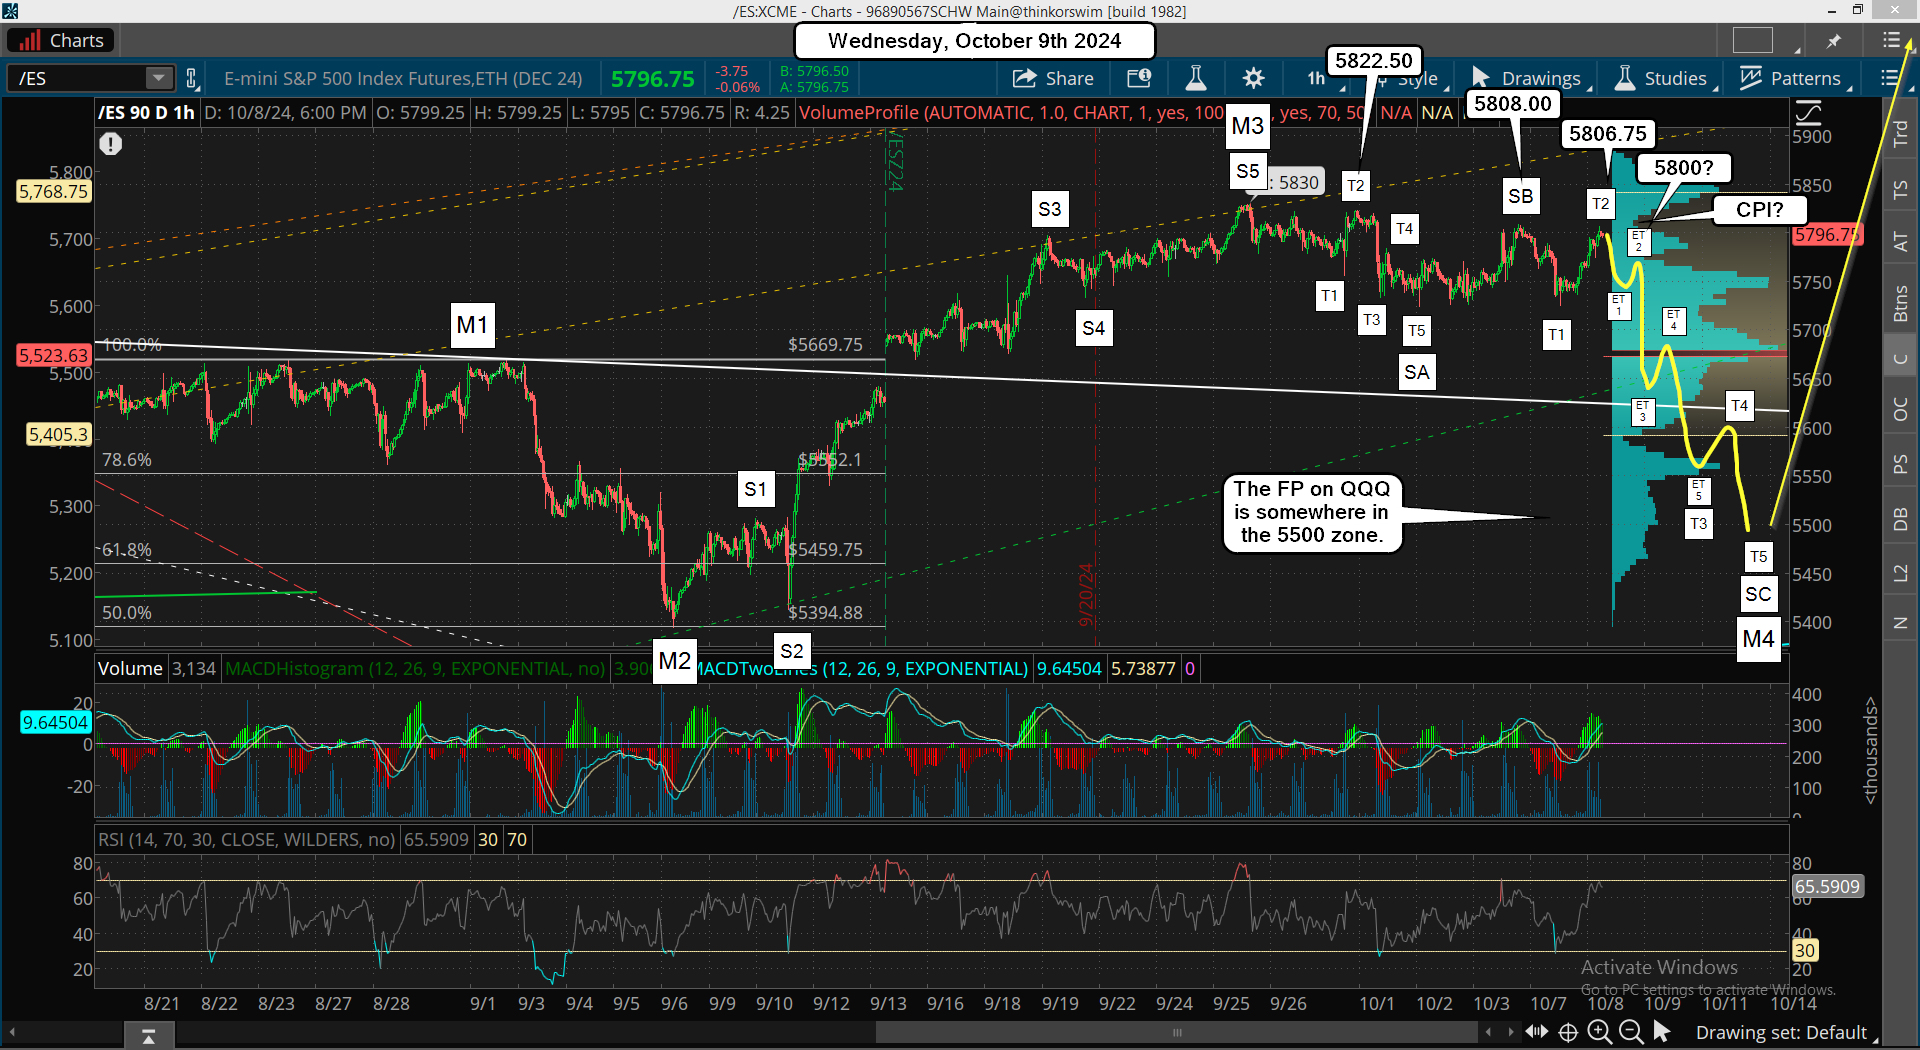
We had the move up yesterday for Tiny Wave 2 inside Small Wave C down, which stopped just shy of the 10/6 high of 5808 that ended Small Wave B up and started Tiny Wave 1 down inside Small Wave C down. We hit 5806.75 into the close yesterday for Tiny Wave 2, and this is all setting up a large move after the CPI this Thursday.

I think it's down of course but it could be up too. I'll take my chances though as I just don't see the move up to 6000+ until we get a pullback first. We also have the minutes from last months FOMC today at 2pm EST, which might cause some movement? But usually nothing much is said new so I think the most important event to cause a big move is the CPI on Thursday  Here's a chart...

What I'd like to see for today is a slow move down into the close that stops just above the horizontal support from yesterday to lure in some bulls looking for a break higher on after the CPI, but that might be wishful thinking, who knows? If the wave count is right though we should be starting Tiny Wave 3 down, and again, that might subdivide into 5 smaller waves.

So the perfect scenario would be down early in the day for Extra Tiny Wave 1 and and small bounce back up into the close for another lower high for Extra Tiny Wave 2 up. Maybe something like a move down to 5750 early and back up to 5800 later on. It would keep everyone guessing on the next direction as not many would see the bearish wave count. Will that play out? Who knows? We shall see.

Have a blessed day.
ES Morning Update October 8th 2024

0

Since yesterday failed to rally up to a new high I have to think Medium Wave 3 is finished. I've moved the Tiny Waves around a little bit to mark the finishing point for Small Wave (and Medium Wave 3) at the 9/26 all time high of 5830 on the ES. From there Small Wave A down inside Medium Wave 4 starts, and it completed a the low on 10/3 of 5725, which was the end of Tiny Wave 5... then the Small Wave B up ended at the bounce high of 5808 on 10/6.

The decline today is just Tiny Wave 1 inside Small Wave C down, and of course all C waves unfold in 5 waves and the 1's, 3's, and 5's inside them could subdivide even more. But since this is only a smaller degree wave it's likely just going to be 5 waves, which will be tiny waves.  Here's a chart below...

Once this first Tiny Wave 1 completes (might already be done?) we should get a small bounce for Tiny Wave 2, and if I had to guess this entire move should be over with by the end of this week. Now Tiny Wave 3 down "might" subdivide into 5 waves, which will be Extra Tiny Waves, and I only point that out because the CPI is this Thursday and there's a lot of time between now and then, so it might need to subdivide to eat up that much time.

Whether or not we drop into the CPI is not known.  We could top from some bounce and drop hard for the Tiny Wave 3 of Small Wave C, or we could be going into it with a low, but either way once the FP on the QQQ is hit I think the bottom will be in for Medium Wave 4 down and Medium Wave 5 up will follow and last into the end of the month (most likely).

It could be faster I guess but I'll be looking for a big blow off top to happen. I really feel strongly that the satanists that run this world will hit a ritual number again like they did at the 2009 low when they hit the 666.79 on the SPX. Meaning we could hit 6066 on the ES or SPX, or 606.66 on the SPY, but I do think they will do it.

So if you are short already you know the downside target now to exit at, and to get long for the last rally before the big drop happens.

Have a blessed day.

ES Morning Update October 7th 2024

0

The Non-Farm Payroll Report did give the market the rally was I looking for, which faded after the open into midday and then went back up into the close, but it never did make a new high, so it could end up being a "truncated" Small Wave 5 up. It's hard too say for sure but I still think we will go down this week for Medium Wave 4 with this Thursday or Friday being the most likely time for the low, but if they still want a new all time high first it should happen early in the week, like today or Tuesday at the latest.

As for the coming pullback, it should be fast and short lived as the A and B wave will probably look small and not be noticed, which traps bulls before a dump.  Meaning we could stay in a range between the low around 5700 up to the all time high until the Small C Wave sets up.  That might last into this Wednesday, which then you could see a quick 5 wave move down into Friday to hit the new FP on the QQQ from last Friday's post.  We have the CPI on Thursday, which could be blamed for the drop?

That will be the scariest move and will perfect for getting the bears to call for a crash. Of course that's also when they will get trapped and be used as fuel to be squeezed hard right back up for the last rally before a bigger drop.  It should last for several weeks, and could be right into the election?  They never make this easy. It's always tricky, so for me I'm just focused on the down side target to be hit as that's the bottom for the move and next will be the final rally up.

Have a blessed day.
ES Morning Update October 4th 2024

0

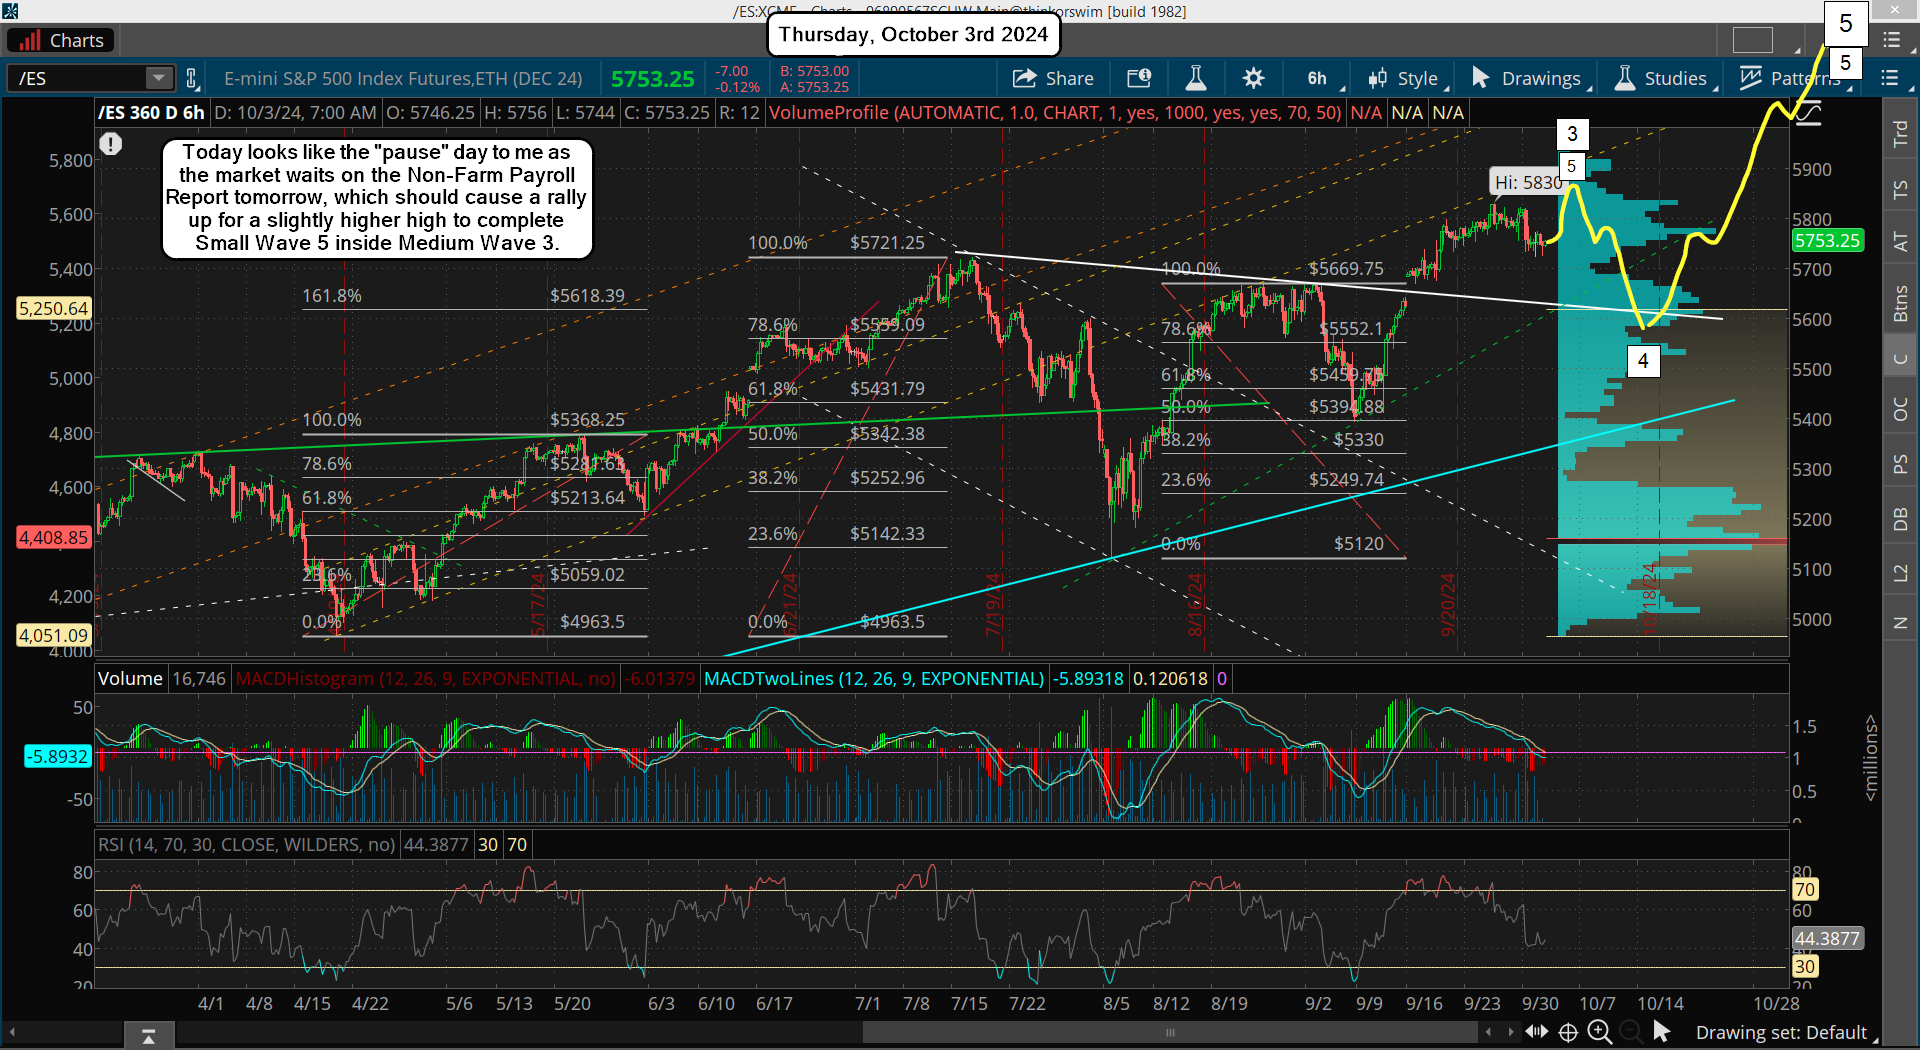
Today is the big day, at least I think so. If I'm right we will have a fast squeeze up after the NFP Report this morning, which ideally we run the stops above the 5830 level, but of course that's not guaranteed. Maybe it's only a slightly lower high, or I'm completely wrong and we tank.

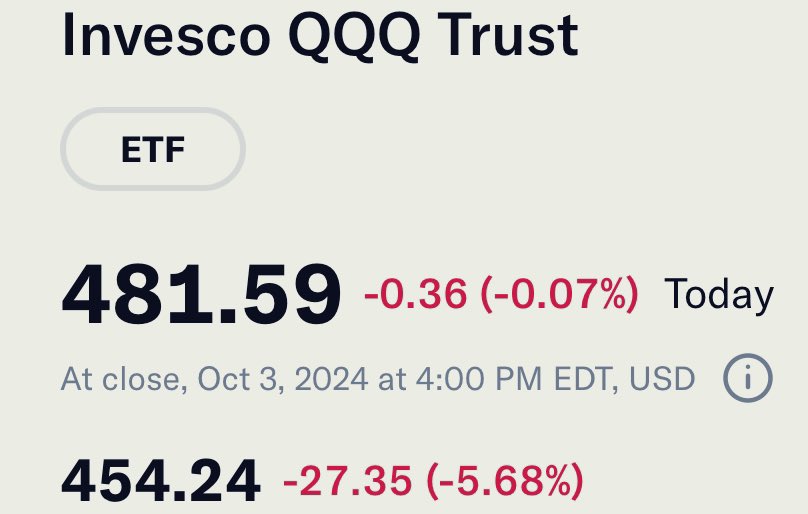
But usually there is a fake out move first, and up would be the biggest trick I think, and then down the rest of today and into late next week. Now, thanks to a member of the blog who sent this to me, I have a new FP that should mark the low of this coming pullback into next week. Here it is...

That is a slightly higher low on the QQQ then the September bottom. If the ES/SPX drops the same in percentage then 5.68% down from the close yesterday will equal about 5415-20 on the ES, which is a slightly highly low on it too, when compared to the 5394 low on September 6th.

On the SPX though it would be slightly lower then it's 5402 low as 5.68% equals 5377 from yesterdays close. Now I doubt if that prior low gets taken out, so most likely the drop for the ES/SPX won't be the same 5.28% on the QQQ, but slightly less. But it certainly gives us the target to exit shorts and go long for the last rally up to 6000+ into late this month.

Get read as today and the next several weeks are going to be wild.

Have a blessed day.
ES Morning Update October 3rd 2024

3

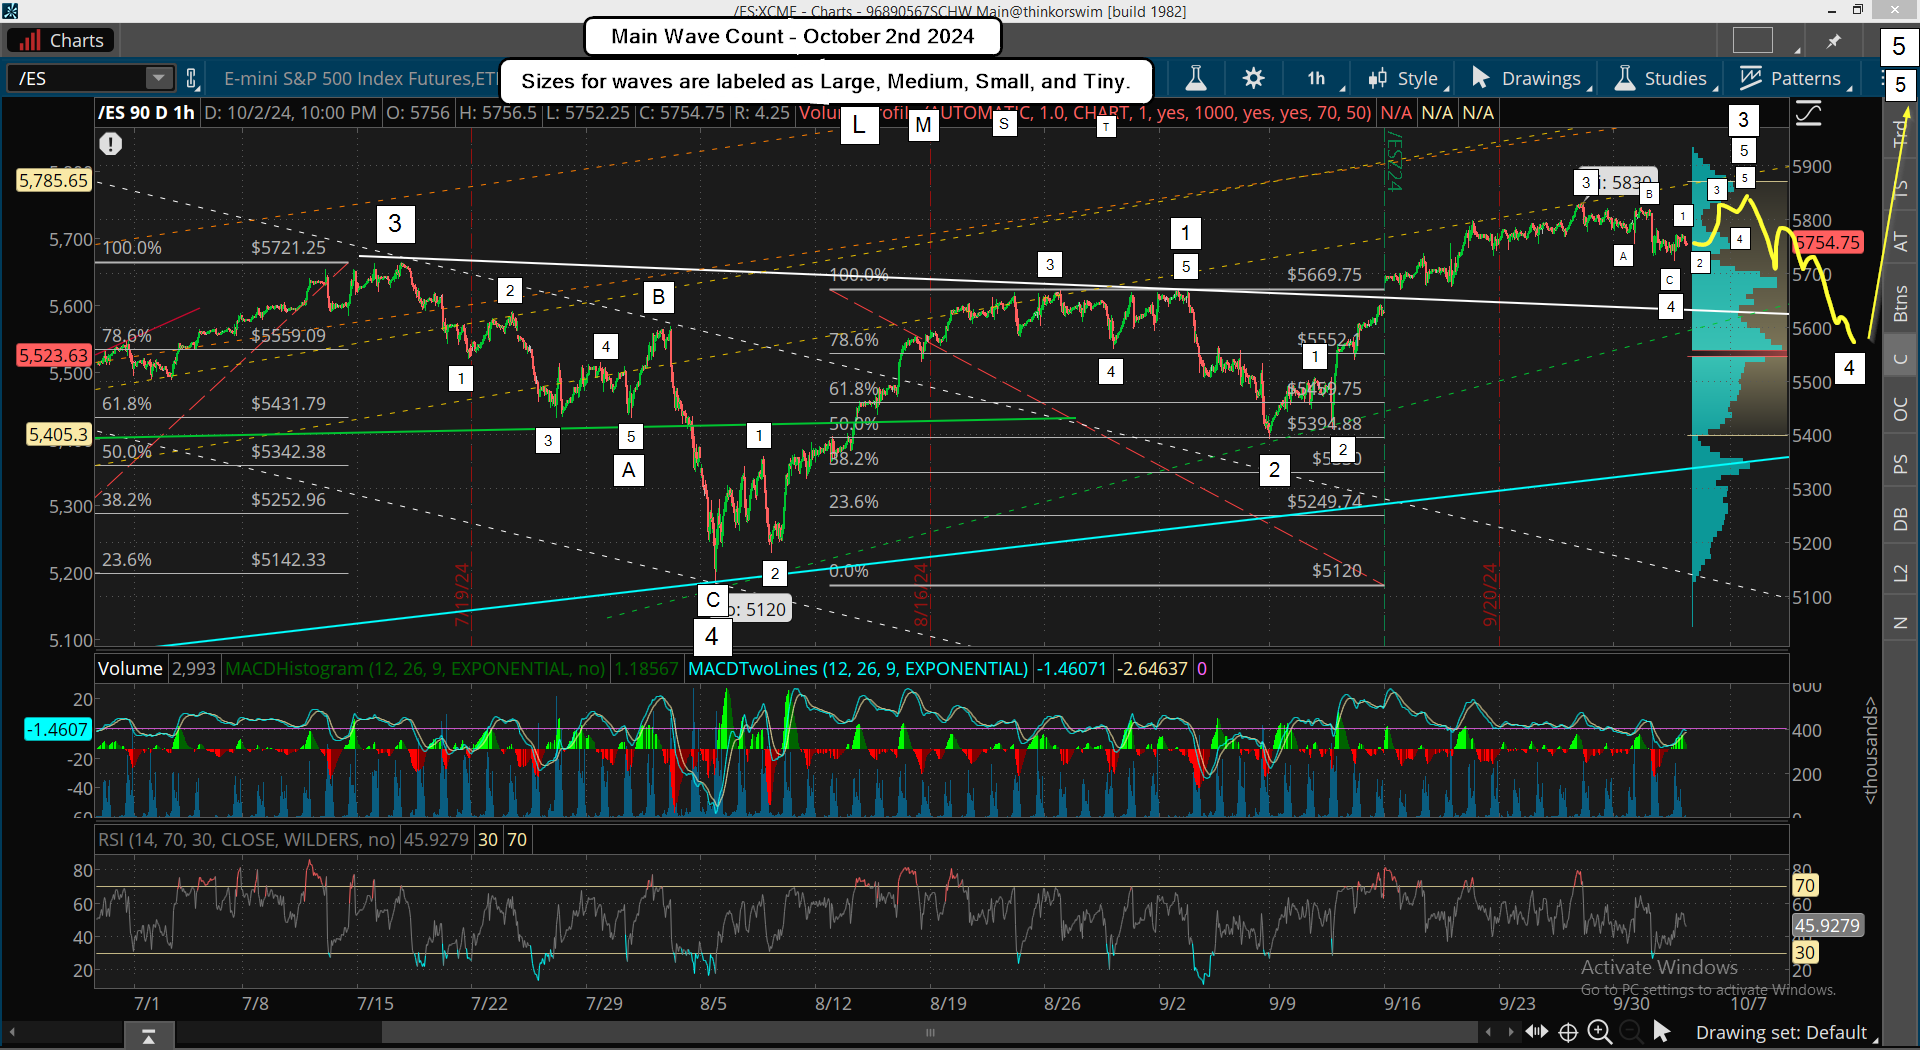
The market most likely finished Small Wave 4 down early yesterday, which puts us in Small Wave 5 up now. Of course it will have 5 Tiny Waves inside it, but it's not worth trying to macro manage (guess) on those kinds of moves... in my opinion at least. I think it's better to just wait for Small Wave 5 to finish, which will finish Medium Wave 3 up too.

Again, I think it will make a slightly higher high to hit the stops above 5830 on the ES and odds still suggest it will happen after the Non-Farm Payroll Report on Friday. And we could see the early part of the day hold up there around that new high in the cash market for awhile (remember that the report is released an hour before the open so the squeeze will play out then). But that rally up should NOT hold all day and should rollover and start down into the close. It might not be a lot but it should be back down in the 5750-5800 area, and of course that move will just be the start of Medium Wave 4 down.

Naturally it will unfold in an ABC move, so the first drop will be the A wave down, which will be a Small Wave. On a smaller scale it should unfold in 5 Tiny Waves, and most likely will be finished by next Monday or Tuesday (best guess of course). After that would be a fast squeeze up for the Small B Wave, which I don't think will last more then one day. Lastly will be Small Wave C down, which might have 5 waves inside it (Tiny Waves) but many times they are hard to count as C waves can look more like a straight line down when on the small and tiny scale.

The drop into the 8/5 low to complete Large Wave 4 was Medium Wave C down, and it looks like one long wave, so I have to think it could look similar for a small wave too. This looks like it might complete by next Thursday (or Friday) and then we rally up into OPEX the following week to start Large Wave 5 with 6000+ as the final high... and that could be right into the election?

The next FOMC meeting is the day after on Wednesday November the 6th, so if there's ever going to be a large drop will be after that time period as both events will be blamed for it. As for the coming low price target for next week I still think it will be higher then the 5394 low on 9/6 as Medium Wave 4 should not go lower then that low for Medium Wave 2.

If I had to guess I'd say we'll pierce 5600 and hit the mid-5500 zone and that's all. After that should rally but again, it will be choppy for a week as the Small and Tiny Wave 1 up and 2 down carve out, which will align up a Wave 3 later this month, and that's all inside Large Wave 5 up. I think this month is going to fool a lot of people as while I still think we have a fast "crash like" drop coming I think it won't happen until after the final high of 6000+, which should be into the election.

Have a blessed day.
ES Morning Update October 2nd 2024

0

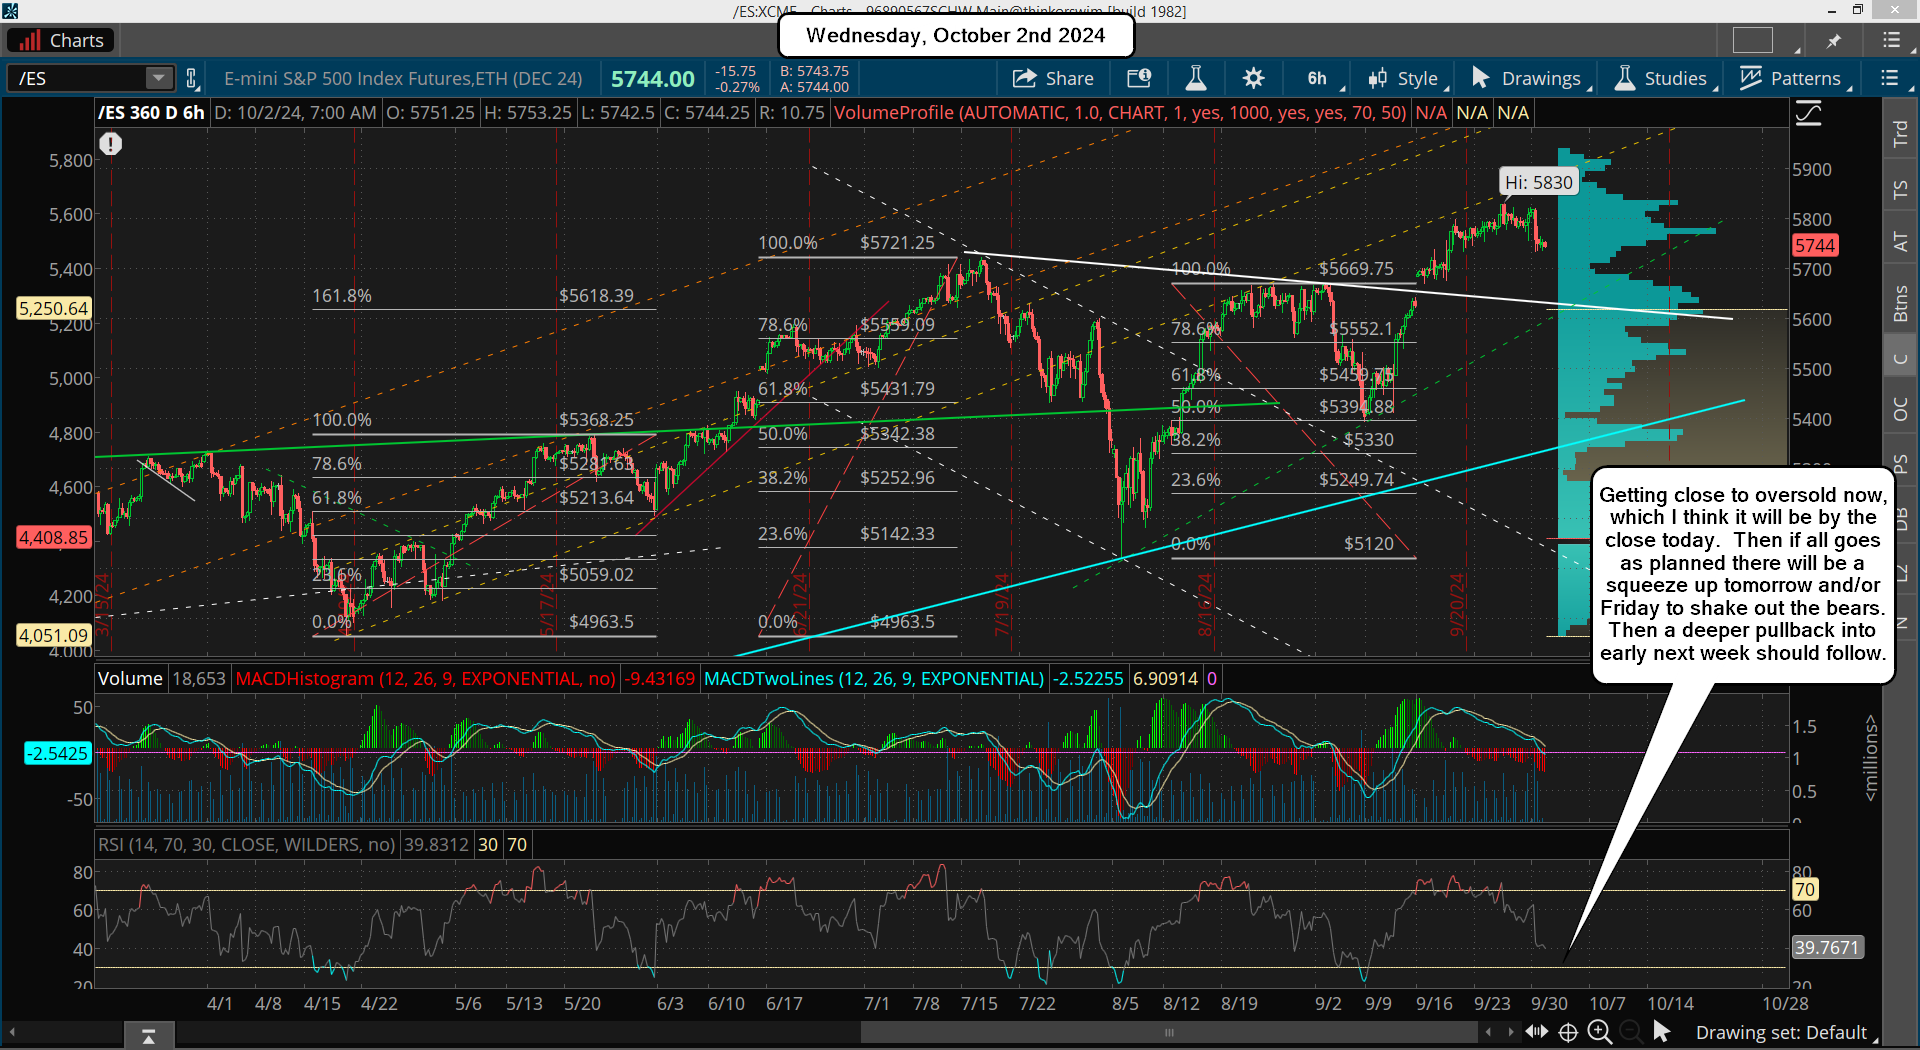
Yesterday I posted a chart update on Twitter with an updated short term wave count, which showed yesterdays drop as a Tiny C Wave inside a Small Wave 4. Below is that chart again...

Once that completes, we should see a strong rally up to above 5830 for Small Wave 5 up inside Medium Wave 3, which might be into Friday? Meaning we should start today to get the Tiny Wave 1 up and 2 down out of the wave, which sets up Tiny Wave 3 up to happen after some positively viewed Jobless Numbers on Thursday.

I'm just looking at the technicals first and adding in the "events" to get things going as I really don't care what the numbers are. It's about the charts, not the "events", but they are sparks to get things going and that's why I'm mentioning it. If this plays out then Friday's Non-Farm Payroll report should cause the top and drop, which since it's out before the open the high in the SPX cash "might" happen Thursday into the close?

Now keep in mind that the market might also rally up Friday and hold into the close to make everything look rosy for the weekend. Then something negative comes out and we drop for Medium Wave 4 early next week, and if that happens the market will need to hold above the prior low for Medium Wave 2, which was 5394 on the ES. As long as that happens then it can still go back up to 6000+ the rest of the month or right into the election.

It's going to be a wild October with many moves up and down I think, but at some point late in October, or possibly ealy November, the top will appear and then the market will fall off a cliff, which I think will hit my 483 FP on the SPY and that will put in the low for this year. Then a December rally and another larger drop in the first quarter of 2025 with 3800 SPX very possible.

As for today, again I'm looking for some chop down around the low with the Tiny Wave 1 up and 2 down getting finished to setup Thursday for a squeeze.

Have a blessed day.
ES Morning Update October 1st 2024

3

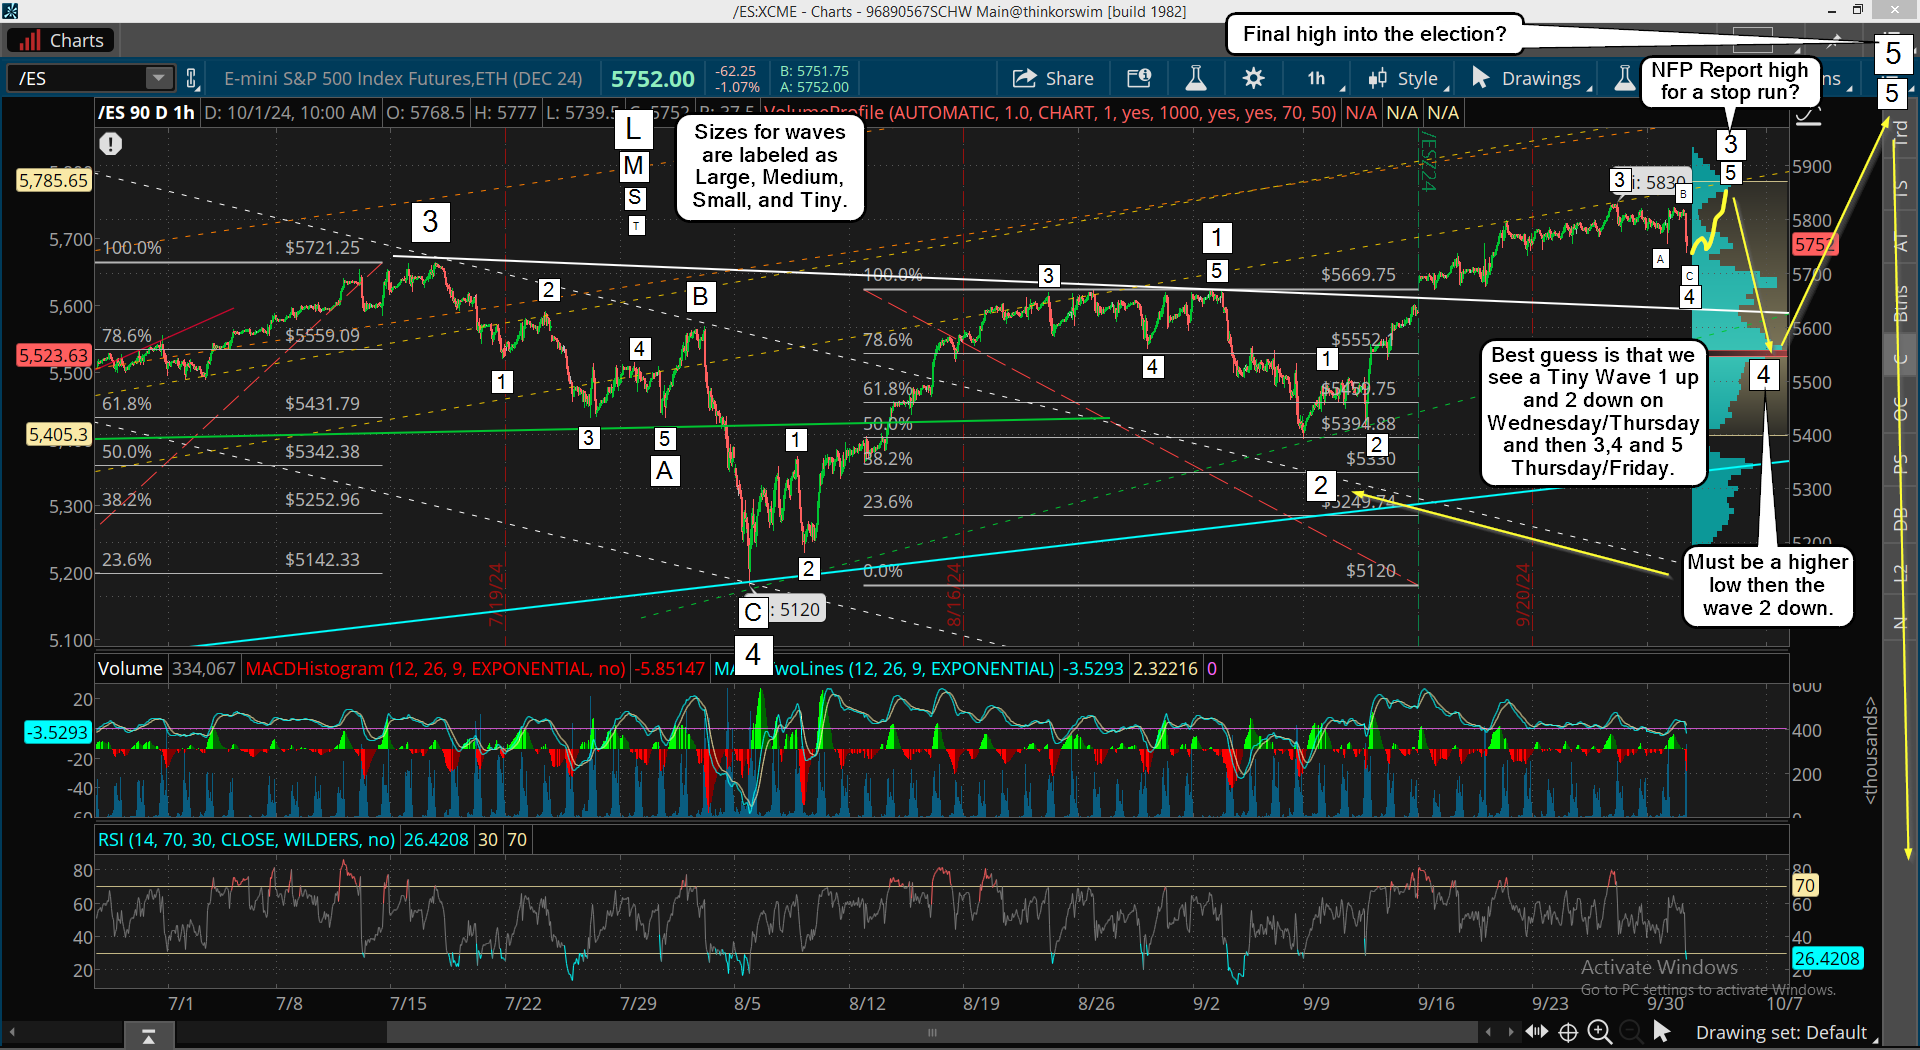
We got a small pullback yesterday but then a late day squeeze came in and stopped horizontal support from breaking. This might continue all week long and turn the wave 4 pullback into a sideways correction, which will still be a valid wave but a frustrating one for any bears that are trapped or bulls wanting a pullback to get long at. It could also be just an A wave inside an ABC pullback for wave 4 that could still have a C down later this week to that falling white trendline of support.

This market feels more like it's just waiting for some kind of news event to rally higher (or sell off?), which might be this Thursdays Jobless Claims number or the Employment Situation on Friday (more commonly called the Non-Farm Payroll Report).

If we go into it with a low then I'd look for the NFP Report to cause another rally after it.   Of course if it's at a high into it then I'd look for a pullback.  Or, we go into it sideways, which would be the hardest to figure out.  I lean toward that happening as it will keep everyone guessing.  If that happen the market won't rally much from it most likely because it won't have pulled back first to get short term oversold.  I'd then look for 5850-5860 to hit the stops above 5830 to be the target.

Then we should reverse back down and start either the wave 4 that I'm looking for, which would be to the falling white trendline, or to start the big drop to possibly the FP on the SPY at 483 as the top "could" be in at that point?  There is no way to really know for sure on the move to 6000+ that many are looking for.  If we drop to the support zone, where the white falling trendline is at,  into next Monday or Tuesday it will be up to the Fed to say something positive on Wednesday the 9th at the reading of the September meeting.

Of course Powell and leak something out at any point really but the market will want to hear that they are doing more rate cuts to get going up strongly again with that 6000+ target in mind.  If they disappoint and say no more rate cuts the market will fall off a cliff and the top will be in I think.  Bottom line her is that I think we need more time to pass before it will finally exhaust itself.  Then a pullback should start of some degree.

Have a blessed day.
ES Morning Update September 30th 2024

0

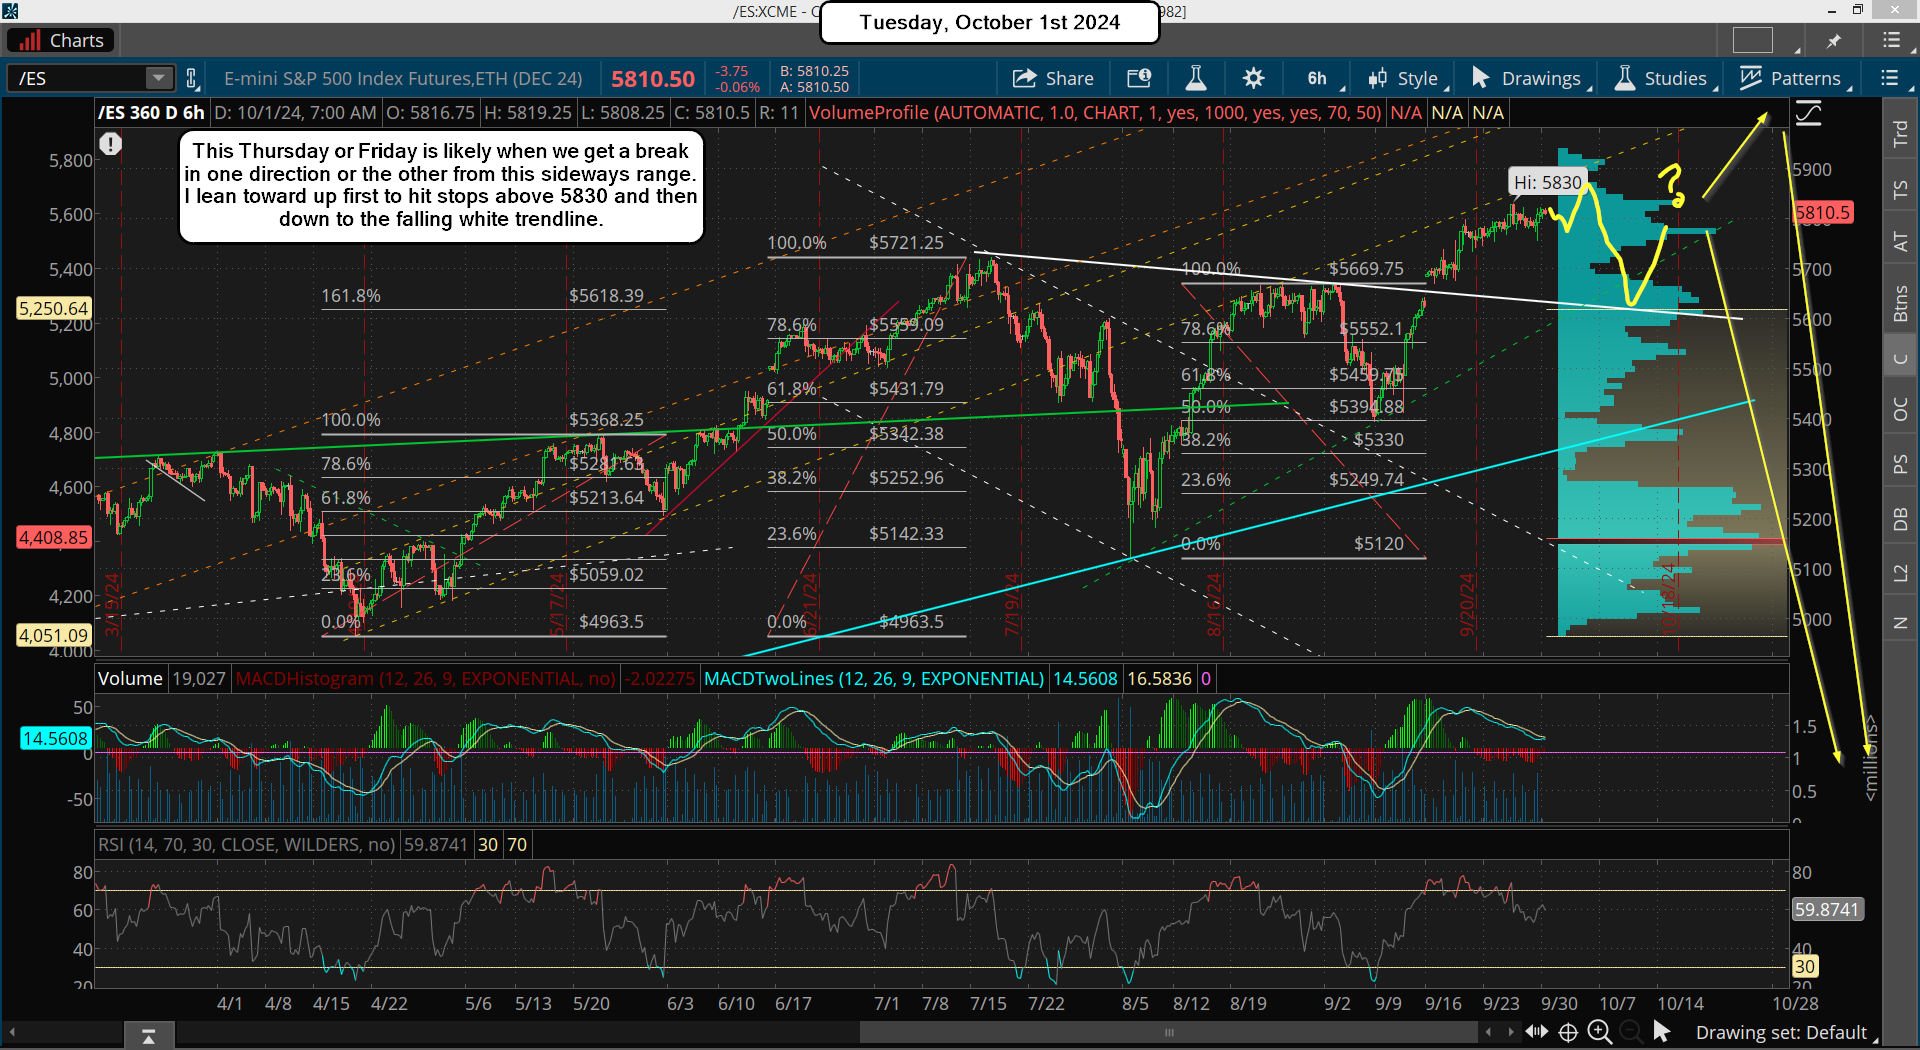
This week is where a pullback should happen, which might me late this week and carry into next week. But after that we should have one more way up to finish everything before we get a large pullback. This top could come before the end of this month or drag out right into the election, it's hard to say which. A lot will be determined by how much the coming pullback will be, which I guess it could be down to the 533.01 new FP on the SPY but that just seems too deep for the current wave count. I put that count out last week and below is that chart.

I have the wave 4 going down to that FP but again, I think that's too low. I don't see the falling white trendline breaking, which is around the 5630-5670 zone. I don't see any more then that as any deeper will kill the uptrend momentum, and that's about all you should see for a wave 4 down I think. So, if that white trendline holds, and I think it will, then we could see the last rally up end before the election I think, and I do think that's most likely. It just seems too obvious to top out right into the election as everyone is expecting it. A top in late October and drop into the election could get the A wave down out the way, and a B up after the election for a few days, then a C down into mid-late November. This is more common as it will trick the masses because a B wave up after a Trump win will make everyone think it's like 2016 when he won, but in reality it will just be a short lived bounce inside an ABC down.

For this week we might be choppy early on and the late this week we get some pullback, and again I don't see much more then the falling white trendline on my chart. I don't see this pullback as tradable and will just wait for that last move up later October for the best shorting opportunity.

Have a blessed day.

ES Morning Update September 27th 2024

0

Today is the last day of the bullish cycle on the daily period. It's been in a bearish cycle on the weekly period for awhile now but that takes time to align up with the daily period, and that's coming next week. Just like small, medium and large waves there are periods of bullishness and bearishness of larger and smaller degrees.

The weekly bearish period cycle takes awhile to really get going and it's not really started yet. The "cycle" is bearishly aligned but since the daily cycle is still bullish the market can drag out into late October or even early November if they really do plan on hitting that 6000+ I spoke of yesterday. That's really impossible to know for certain but I want to keep it as "possible" going into October.

AskSlim did a great job of showing how we could pullback into early October and then bounce back up for a lower high (his thoughts) into mid-late October and then do the larger drop late next month or November.  Here's his video...

The Speculation...

What I'll be looking for is how fast the coming pullback happens. If it's really fast, which spikes the VIX, then that should wake up the bears and cause a ton of them to pile in short, which if that is at the 533.01 FP on the SPY, where two trendlines of support are at... I could then see another new high. The next Fed date is 10/9, which is just a reading of the minutes from the September meeting, but sometimes they give out new breadcrumbs of what's coming in the future.

I would not be shocked if Powell mentions another .50 cut is coming at the November meeting. If he says that then that will be the fuel needed for the rally to 6000+ as the market "front runs" the event. Then when it happens at the 11/7 meeting the market tops and tanks afterwards. But if the market declines in a slower manor in the beginning the bears will keep buying it (and the bulls) thinking there's another higher high coming into the election.

If that happens there should not be another higher high and we should be going down to my yahoo FP of 483 on the SPY. It's really a tough call here to figure out but I'm leaning toward the 6000+ move because of how the Fed's seem to be trying super hard to keep the market up into the election for the Demoncrats. Then we tank after Trump wins (I pray he does), and they get to blame it all on him, which of course it won't be his fault but they will say it is anyway.

Back to the Technicals...

Another reason I'm starting to think it's possible that 6000+ happens into the elections is that the weekly (and daily) charts need to get a little more overbought in my opinion. It's more of a gut feel based on past technicals as the monthly chart has reached the overbought level with it popping its' head over the 70 level on the RSI yesterday to hit 72.20 or so. I don't know if it's going to hold up into next Monday when the month closes or not but it's there now, so this market is very close now rolling over and starting another recession like 2022.

Of course the monthly time frame is not used to pick an exact date for the final top but it is suggesting that we are near the end of the bull market since the 2022 low. We could easily extend into November before it does, so it's important to remain open. The pattern looks a lot like the 2022 top right now, which stands out like a sore thumb I think.

Every trader must see it so I don't know how they can repeat it exactly. In fact if it did repeat the first move down would be to the 483 FP before any strong bounce. Maybe it happens, who knows? But it's so obvious to me right now that I just can see them making it that simple.

Have a great weekend.

ES Morning Update September 26th 2024

0

So I've been thinking about what would be the trickiest move by the market in the coming weeks and what that would consist of is a sharp pullback next week that just traps the bears before another big squeeze that goes up to my old FET's of 6082.46, 6189.54 or 6009.50 into the election. This would surprise everyone looking for an October crash and dump the market on Trump if he wins. Biden will take credit for the move up the last several years and Trump will be blamed for the coming recession. It's the perfect trick on the bears in the coming weeks and I really think it's got some pretty good odds of playing out like this. Let's look at the wave count now...

As you can see on the chart above the coming pullback would be a small wave 4 inside medium 5 up of large 5 up. The 5th wave can go to any level, which could reach my FET's around 6000+ into November. On previous wave counts I still had this labeled the same but I had the small 4 down as a short lived and small (in points) pullback, with the small 5 up to mid-5800 or so. Here's the old chart from 9/6 showing it.

The market followed that chart pretty good but I think we could see a bigger pullback for small wave 4, which would then setup the bulls for a more powerful squeeze to follow for small wave 5 up. I was sent this new FP below on 9/24, which points to 533.01 on the SPY, and that would be about 400 points down on the ES/SPX for this small wave 4 down. It would be the perfect trap on the bears before one more last rally up.

If this happens, and I do think the odds are high that it can play out like this, then I must respect this scenario and NOT get overly bearish when this FP is hit. If the short term charts are oversold enough at this point then I must be ready for that big squeeze to follow.

Have a blessed day.

ES Morning Update September 25th 2024

0

I didn't write a post yesterday as there was nothing to add that wasn't covered on Mondays post. Same thing for this post as nothing is going on but sideways chop, which of course makes another bull flag. But, the "time" is running out for the bullish period as by the end of this week it will be over with from a cycle point of view and then the market will enter a bearish period.

So it doesn't really matter to me if the bulls breakout again from this bull flag and run a little higher as their time is coming to an end soon. Maybe we get that last squeeze higher tomorrow after the Jobs numbers and/or GDP, and then Powell speaks at 9:20 am too, so he might try to lift the market higher? It's a bull flag building so all it really needs is a spark to get it to pop but I don't think it will last past the end of this week, and if it happens it will just be another "better entry" spot to get more shorts.

Have a blessed day.

ES Morning Update September 23rd 2024

0

This market is likely going to hold up into the end of this month and grind higher. I thought we might have topped last week but there's still too much "time" left before the bullish period turns to a bearish period. It could drag out into early October a little too, but that's about when the bullish time period (cycle) ends and the bearish coming in play. Any early pullback this week will likely be reversed as the bulls are still in control for another week and early next week. They never make this easy (shocker... LOL), but I still think we will get a nasty drop before the election. It might not even start though until the second half of October. But weakness will start to come into the market by mid-month. Let's zoom out and look at the big picture...

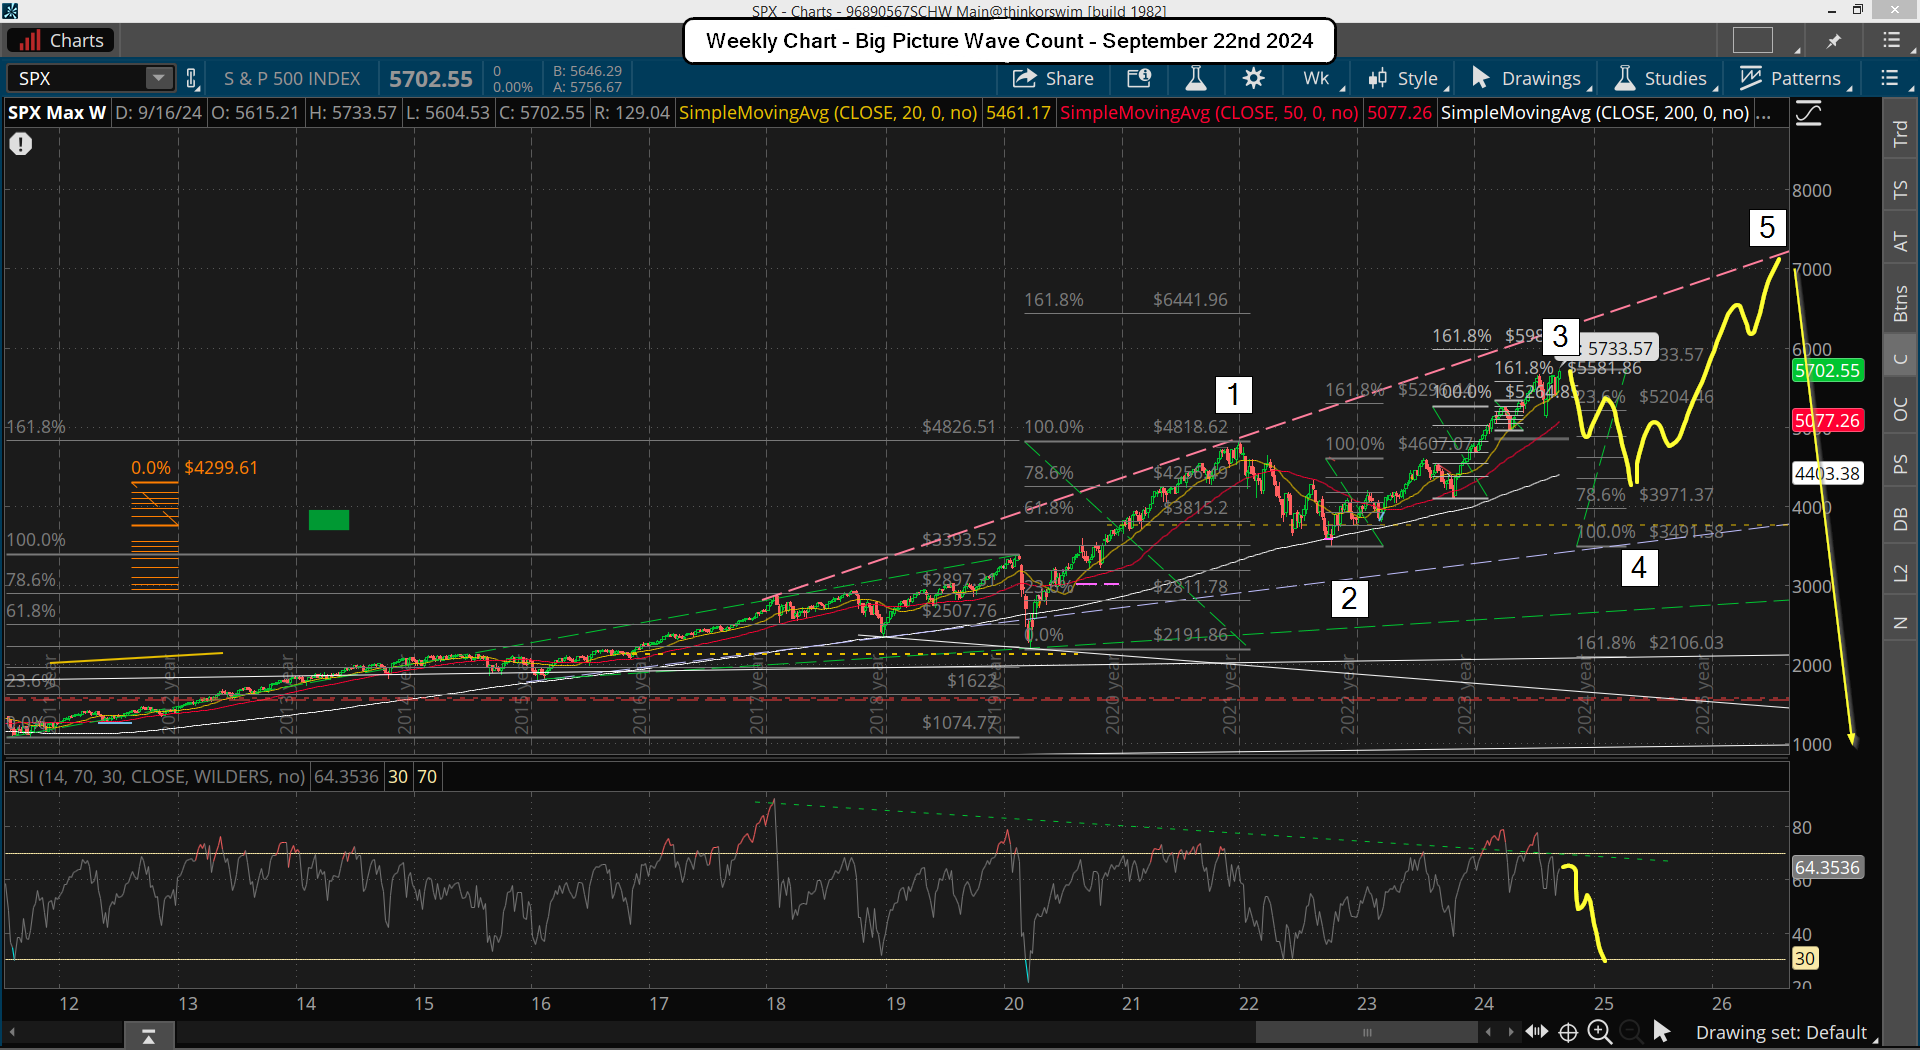
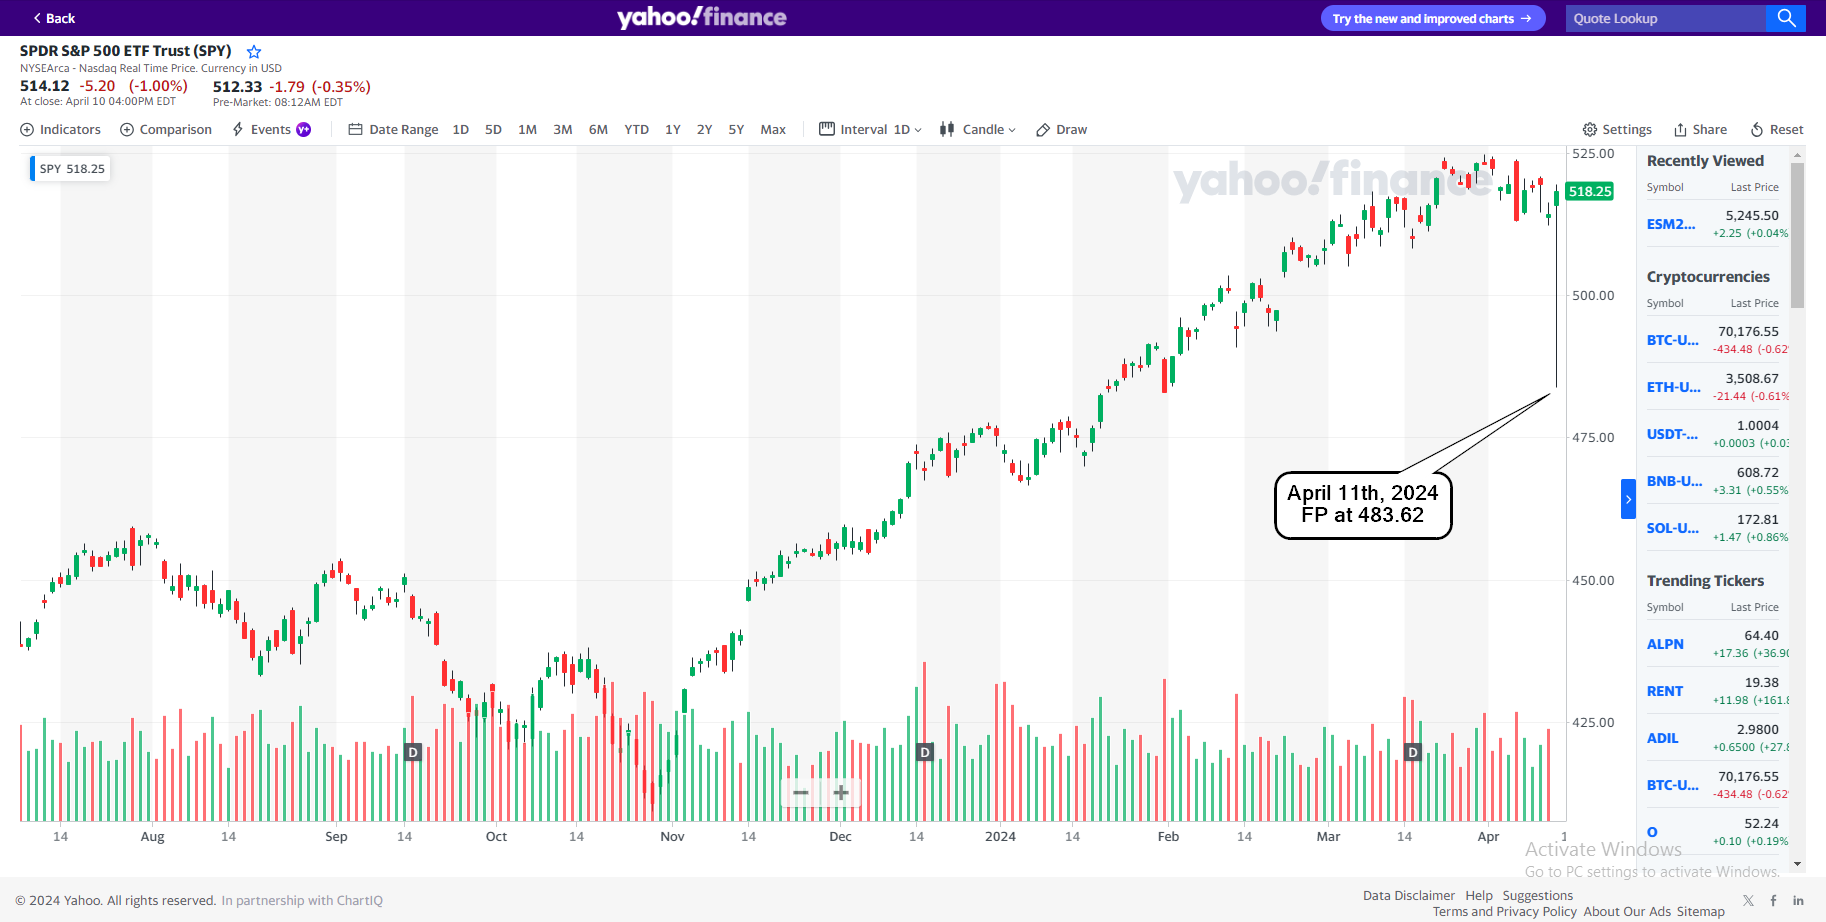
On the SPX weekly chart are my long term thought. I believe we are going to have an ABC correction into 2025 which is a wave 4 of a much larger degree with the wave 3 up starting at the 2022 low. The final high for the wave 5 should be in late 2026 or early 2027. At that point we will see another 1929 style crash. For the now though the first A wave down of the wave 4 should hit my FP from the Yahoo site back in March of this year. It's 483 on the SPY, which of course should be pierced and then I think the A wave is done. From there I think we rally up 50%+ for the B wave into the end of the year, and that will be followed by the C wave down in the first quarter of 2025. I'd look for the 200 week simple moving average to be hit and pierced but the 2022 low should NOT be taken out. My guess is at least 61.8% up to 78.6% will be the retrace low from 2022 low up to the current all time high. Now let's look at the daily chart below...

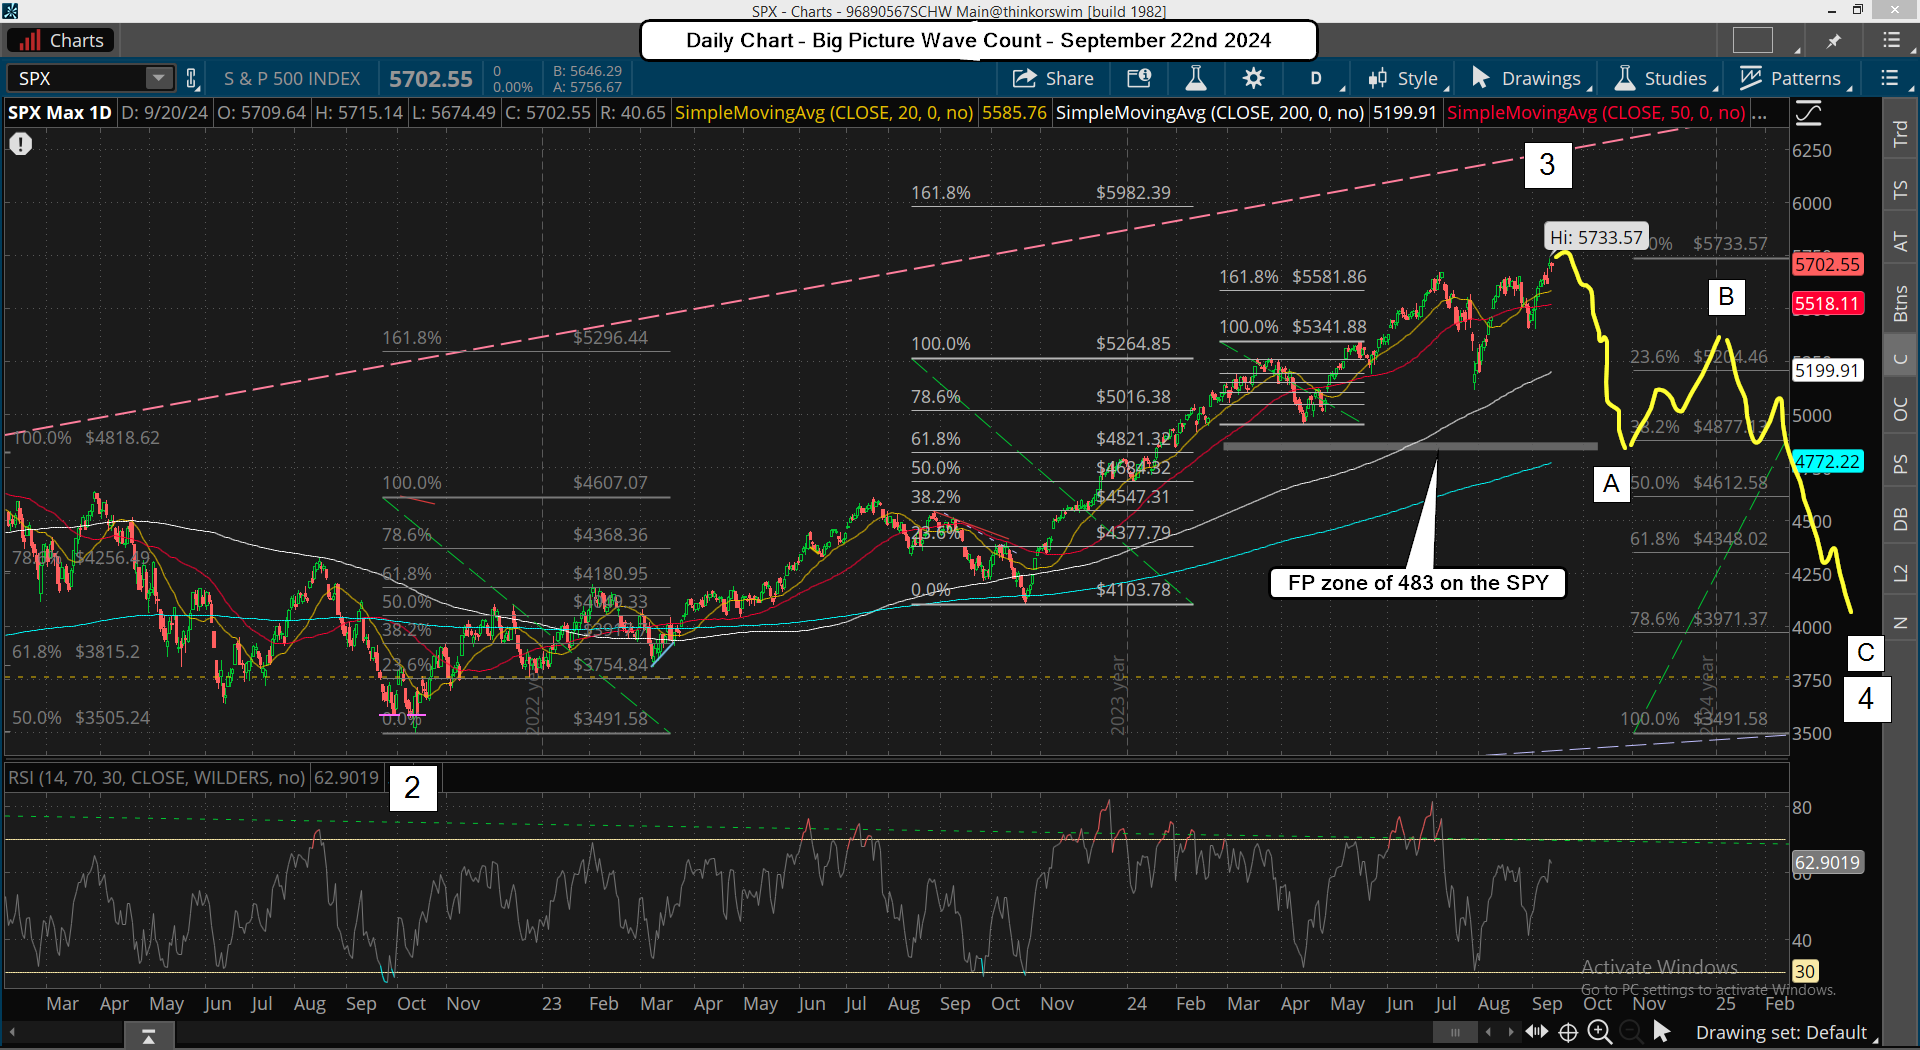
The daily chart above shows you my thoughts going into the end of this year and early 2025. For the short term this week still has a bullish bias to it, so I don't expect to see much happen but chop. We could pullback any day this week for a brief shakeout but afterwards it should go back up again. The 5800 level (and a pierce through it) on the ES is like a magnet for the bulls. We could see 5820-40 hit in a blow off move into this Friday or next Monday as the month closes out. After that we should start to see the early parts of the expected correction for the A wave start. It would be the wave 1's and 2's of course and might be tricky that first week of October. Then mid-late month is when I'd expect to see the wave 3, 4 and 5 of the A wave down take us to the 483 SPY FP.

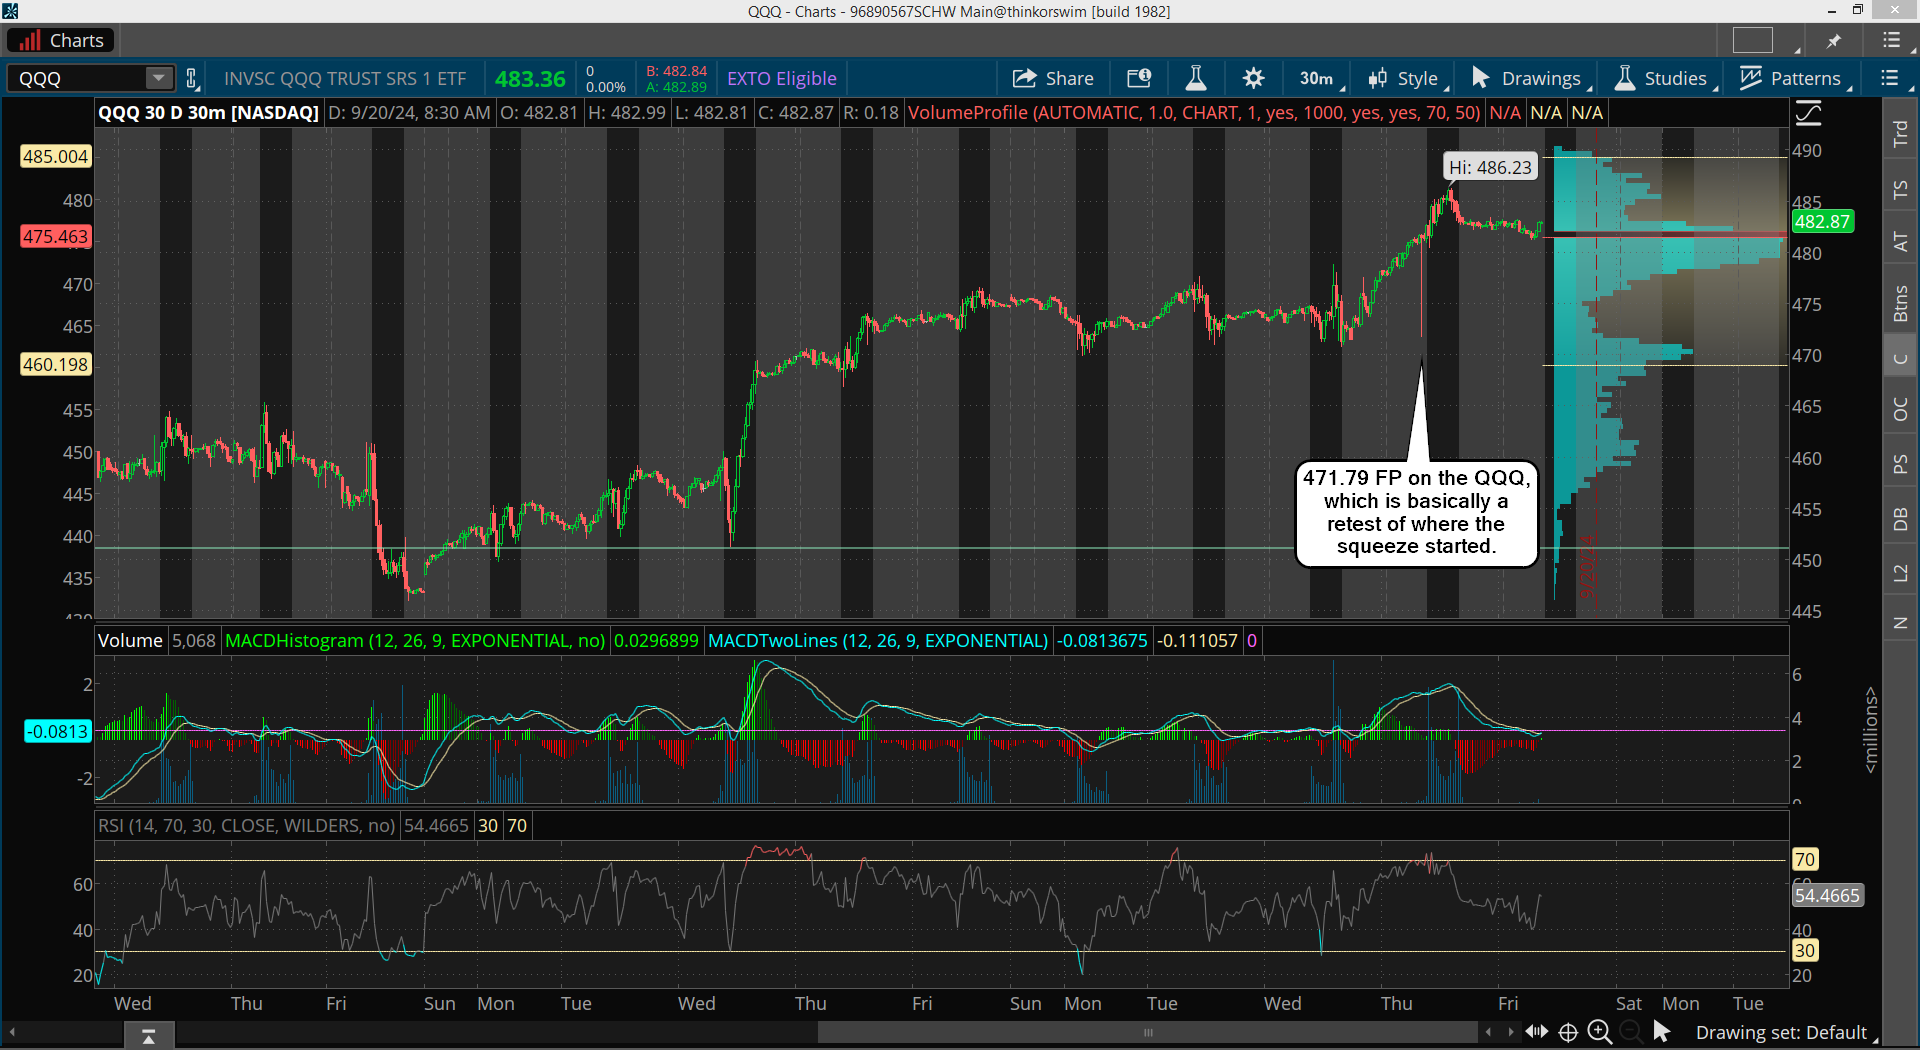
Lastly, on the very short term, there was an intraday FP on the QQQ that should be the target low for any pullback this week. That's an exit for trapped shorts I think, and I'd wait for the last squeeze to 5800+ into the end of this month before attempting to short again. Here is that FP, which is basically targeting the closing area last Wednesday.

Have a blessed day.

ES Morning Update September 20th 2024

2

We hit my zone of 5775-5800 on the ES, so we could have topped? If we go any higher it shouldn't be very much, like a 10-20 points... "Maybe".  Most likely though we pullback some, and while it might be choppy at first I expect the August 5th low to be tested (probably taken out) by the end of October.

The beginning will be full of drops and squeezes for the wave 1's and 2's (or A's and B's) as it sets up the C down later next month. Meaning next week might start the pullback but it could reverse back up again late in the week to setup early October as the best time for a big drop.  As for today, I don't have much opinion as it's OPEX and could go dp anything.

Have a great weekend.


ES Morning Update September 19th 2024

0

We got really close yesterday to the 5775-5800 zone that I was looking for on the ES, but it miss by a little.  Now this morning we've hit the zone, so this should be it for the rally I think. My thoughts are that we'll hold up in this range until the end of the week.  Remember that most OPEX weeks are choppy or bullish as they need to make all the puts expire worthless they tend to hold the market up until that happens.

Tops are a process and take their time to complete and then out of nowhere a nasty drop happens. I think it starts next week for the first leg in it, which could end by the end of this month where "turns" commonly happen at. Then a bounce the first week of October and mid-late October is where the really nasty drop happens.

Have a blessed day.

ES Morning Update September 18th 2024

1

Well, today is the big day where most everyone is expecting the Fed to lower interest rates by at least 0.25%, possibly 0.50%. Will they do it or will they shock the market and do nothing... or worst, raise them! I don't know the answer of course but the market has made new highs on the ES and SPX and the DOW too.

But not on the Nasdaq futures or cash, nor the Russell. So there's divergences forming now between the indexes and I don't see them making a higher high anytime soon. As for what will the Fed do today... I don't know. But the rally up into the meeting scares me there's a ton of people looking for this rate cut and are expecting much higher prices afterwards. When the masses are all thinking the same thing I have to think it's not likely going to happen. Can we go higher afterwards? Sure but I don't see a run up to 6000+ like I previously thought was possible.

Maybe we get a squeeze to 5800 but then again... maybe they surprise everyone and the market tanks. Most of the time the Fed doesn't ever do anything to shake up the market, so if things go as "usual" then it will be a non-event and we'll continue to grind higher until the daily chart gets too overbought. Right now it's not and can push higher, but the weekly chart is still bearish, so any move up from here will be similar to paddling upstream in a canoe... meaning it's not going to see big 200-300 points moves in a few days, but it can go up a little more.

Here's my main wave count from 9/6 and it could still play out... but I don't see 6000 as that's too high and too predictable.

So, assuming there's no surprise by the Fed, I think we are going to need more time before this market rolls over.  This looks like it could drag out into the end of the month.  Possible we squeeze to around 5800 and then pullback a few hundred points into the end of the month.  Then rally back up one more time for a lower high into early October, which would be a wave 2 with the first pullback a wave 1 down.  Then we see a 10%+ drop later that month.  That's my thought on it.

Have a blessed day.

s2Member®