Friday, July 24, 2026
Home Blog Page 3

ES Morning Update December 2nd 2025

0

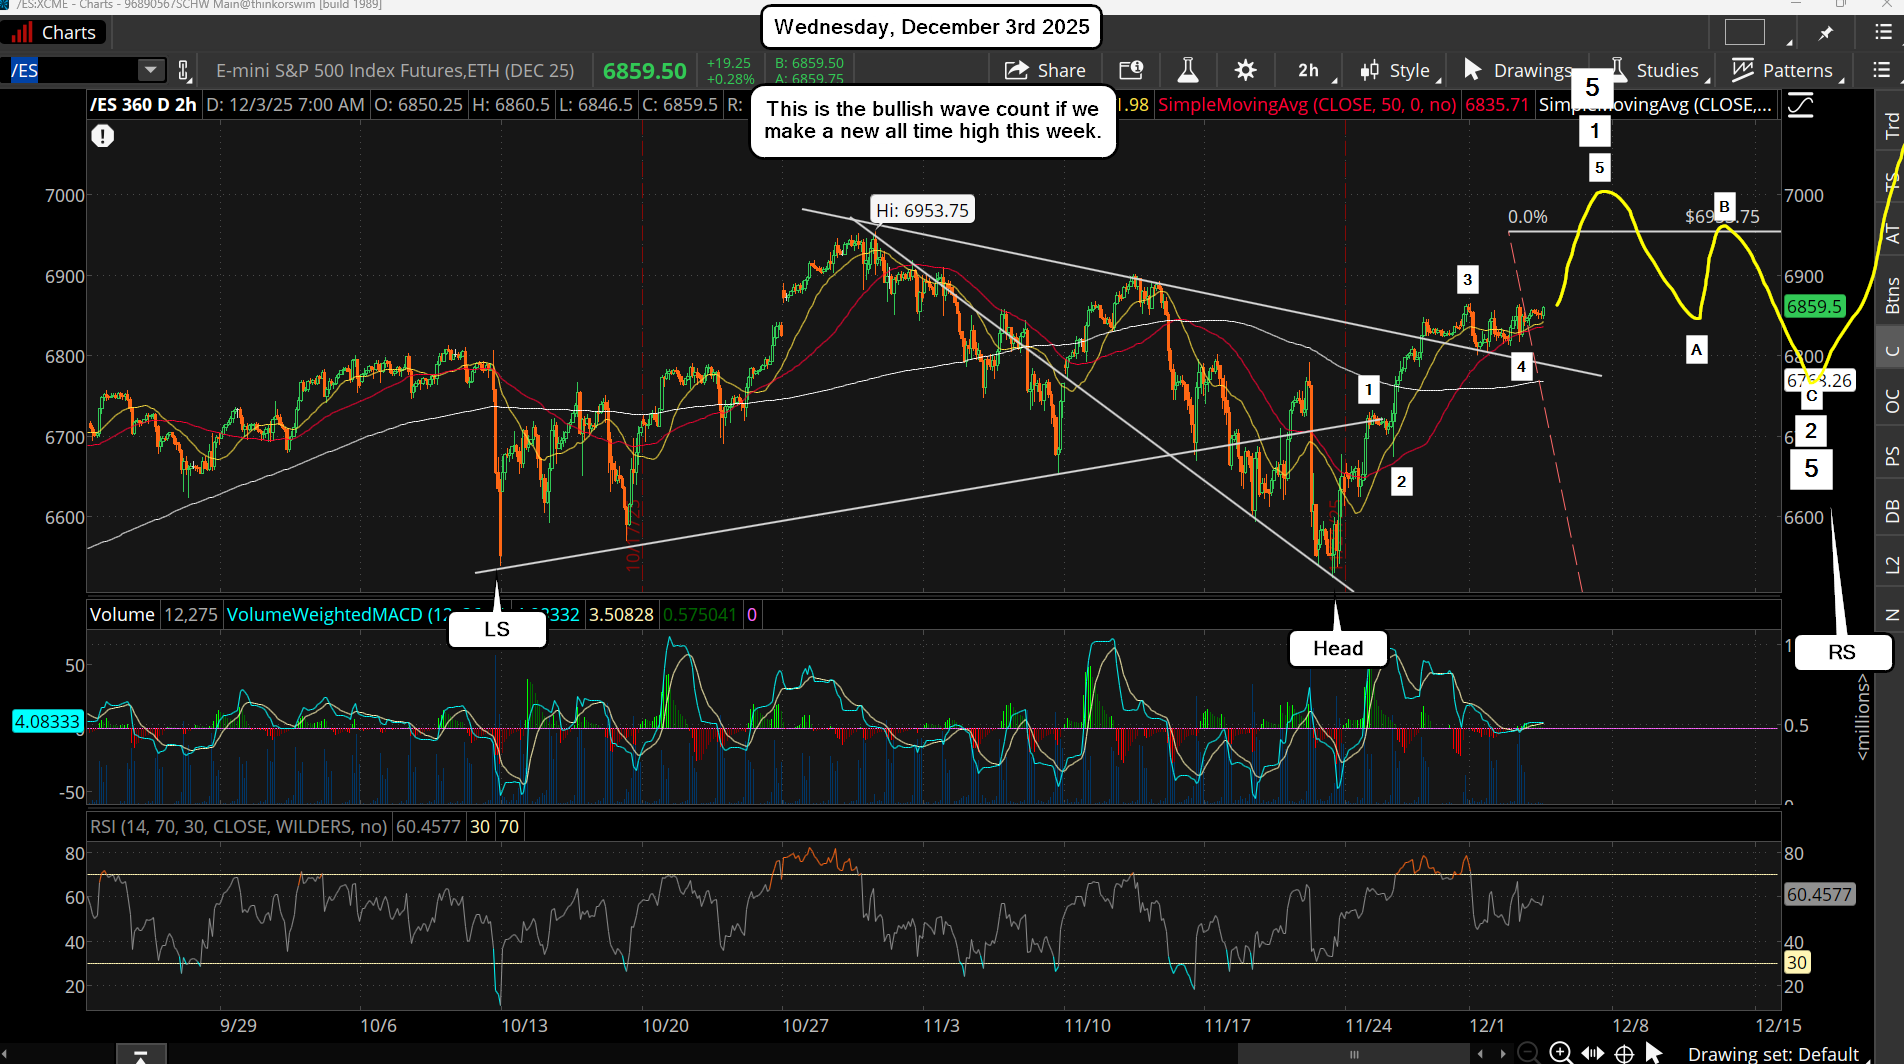
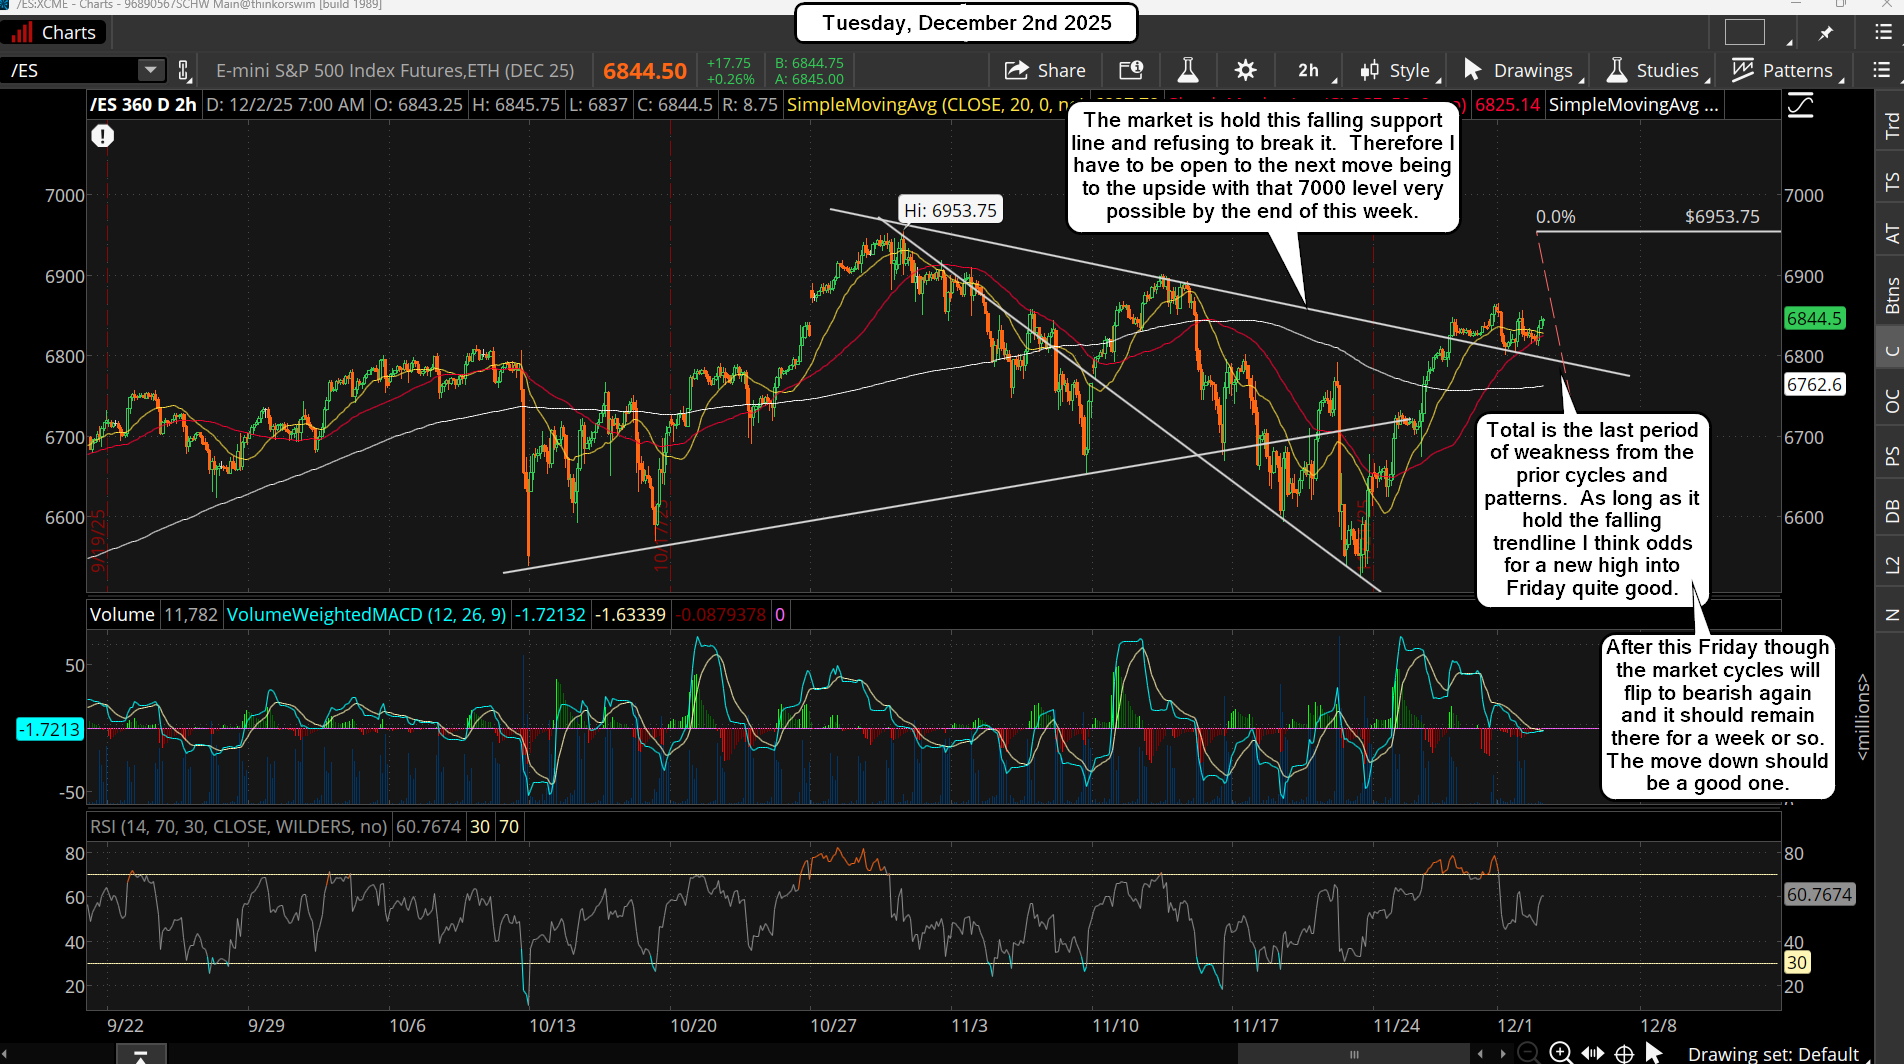
We did get a tiny pullback yesterday but it wasn't down to the FP on the SPY like I had hoped it would be.  Who knows for sure?  Maybe it's not a real fake print but just a late fill?  Regardless... today is the last chance for that to happen I think before one more move up to "try" to make a higher high.

I have it on my chart from yesterday as only being a lower high, as that's what happened back in 2022... but it's not an exact match for price, so it could make a higher high going into the end of this week.  There's a large amount of volume on the SPY at the 700 strike price for the calls, which means there's still a chance we could see that hit into this Friday.

The pattern basically suggests that Thursday/Friday are up days, whereas back then it made a lower high then what would be equal to last Friday. But that doesn't mean we will do the same this time around, as we could make a new all high as we are only a 100-200 points away now.

Bottom line here is that I'll be looking to short whatever price we reach into this Thursday/Friday. If for some crazy reason they do decide to hit 7000+ I'll short it hard as it will be a perfect short in my opinion.  Or if it's only a lower high I'll still short it as the pattern and cycle suggest next week we get a pullback.  I'd just love to see that last squeeze to take out all the shorts first.

In summary, the best shorting spot should be this Thursday/Friday in my opinion... no matter if it's a lower high or higher high.

Have an blessed day.

ES Morning Update December 1st 2025

0

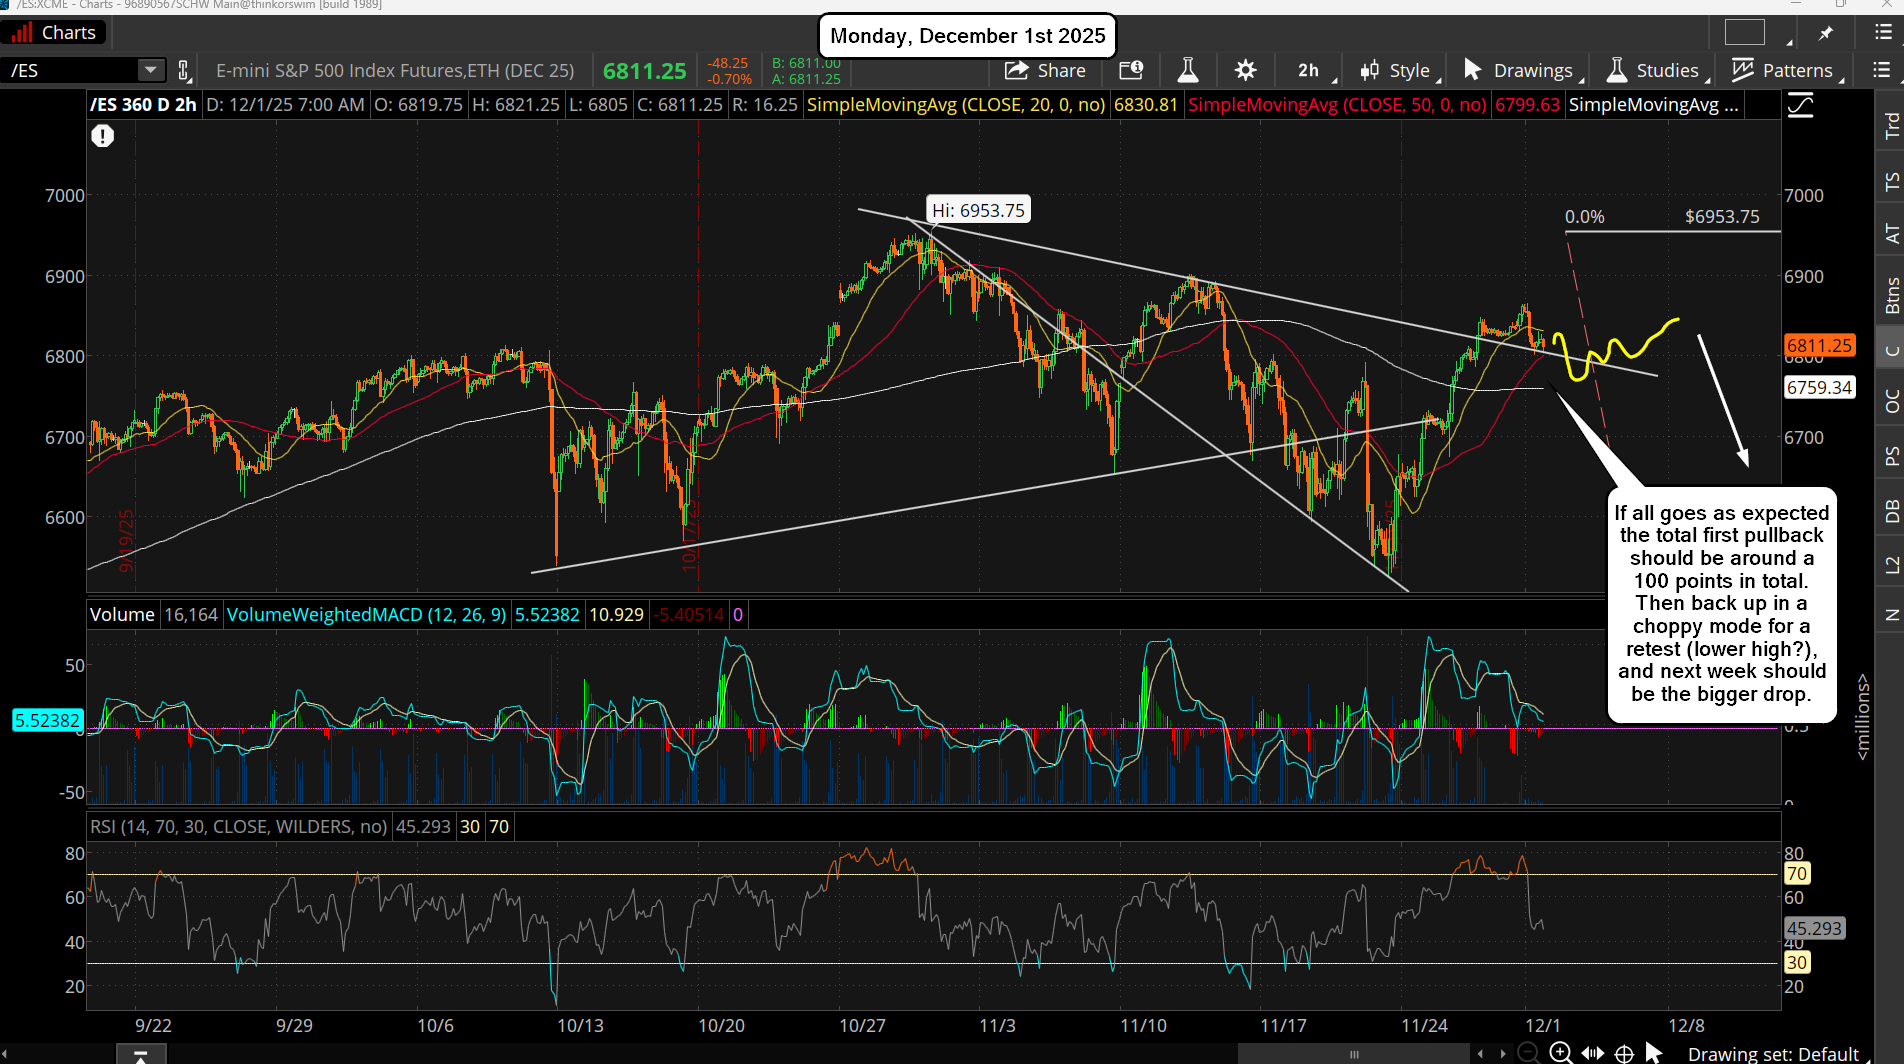
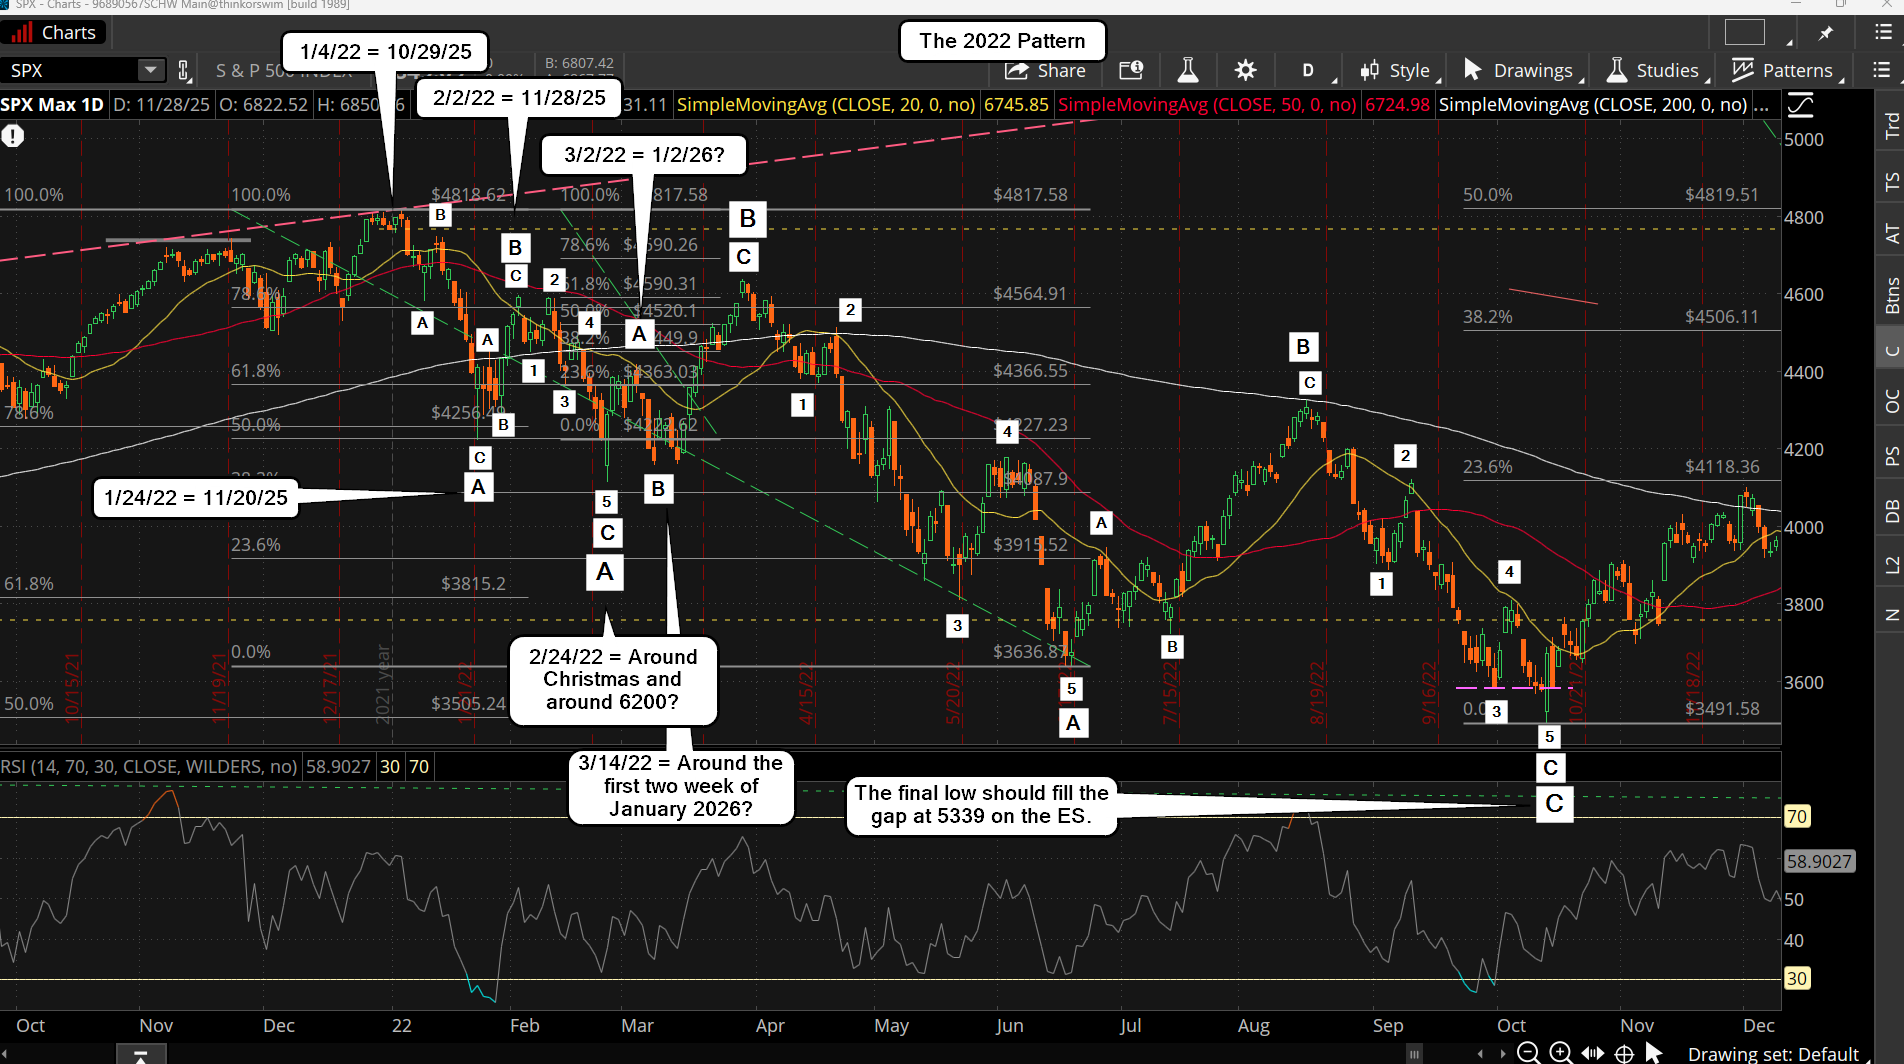
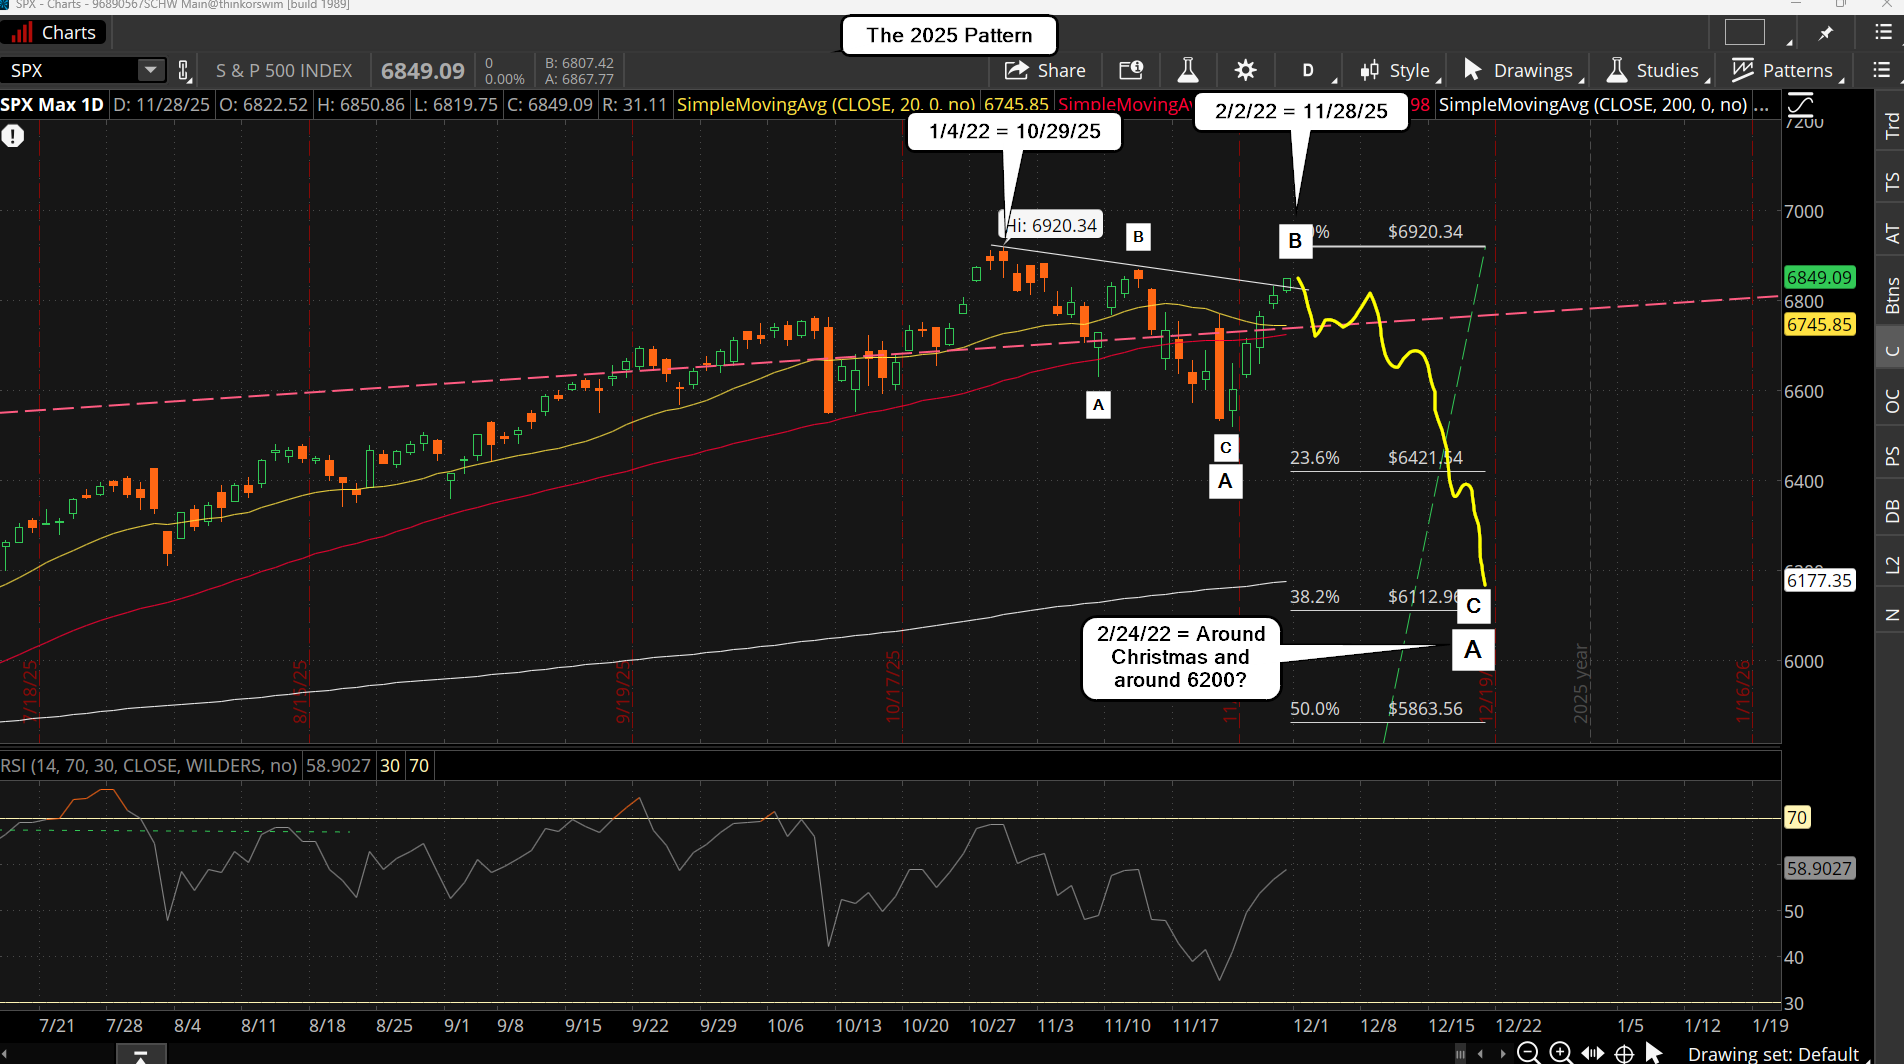
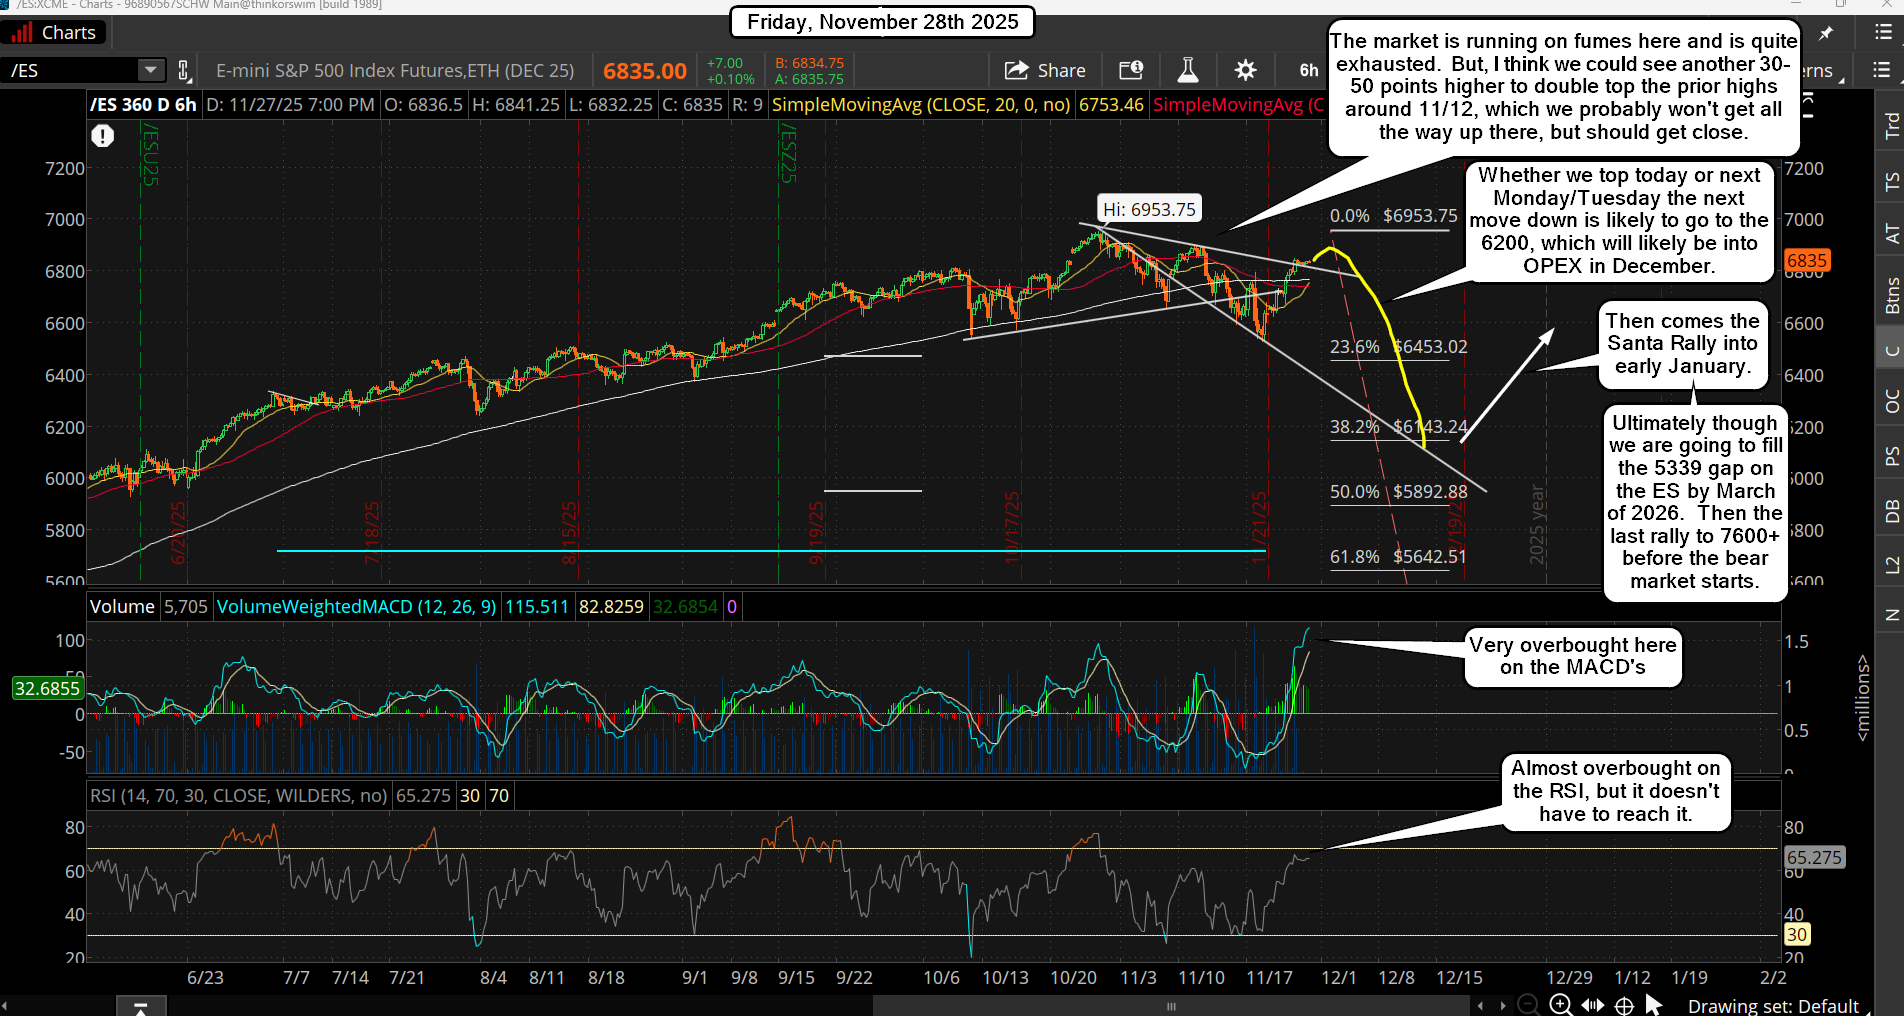
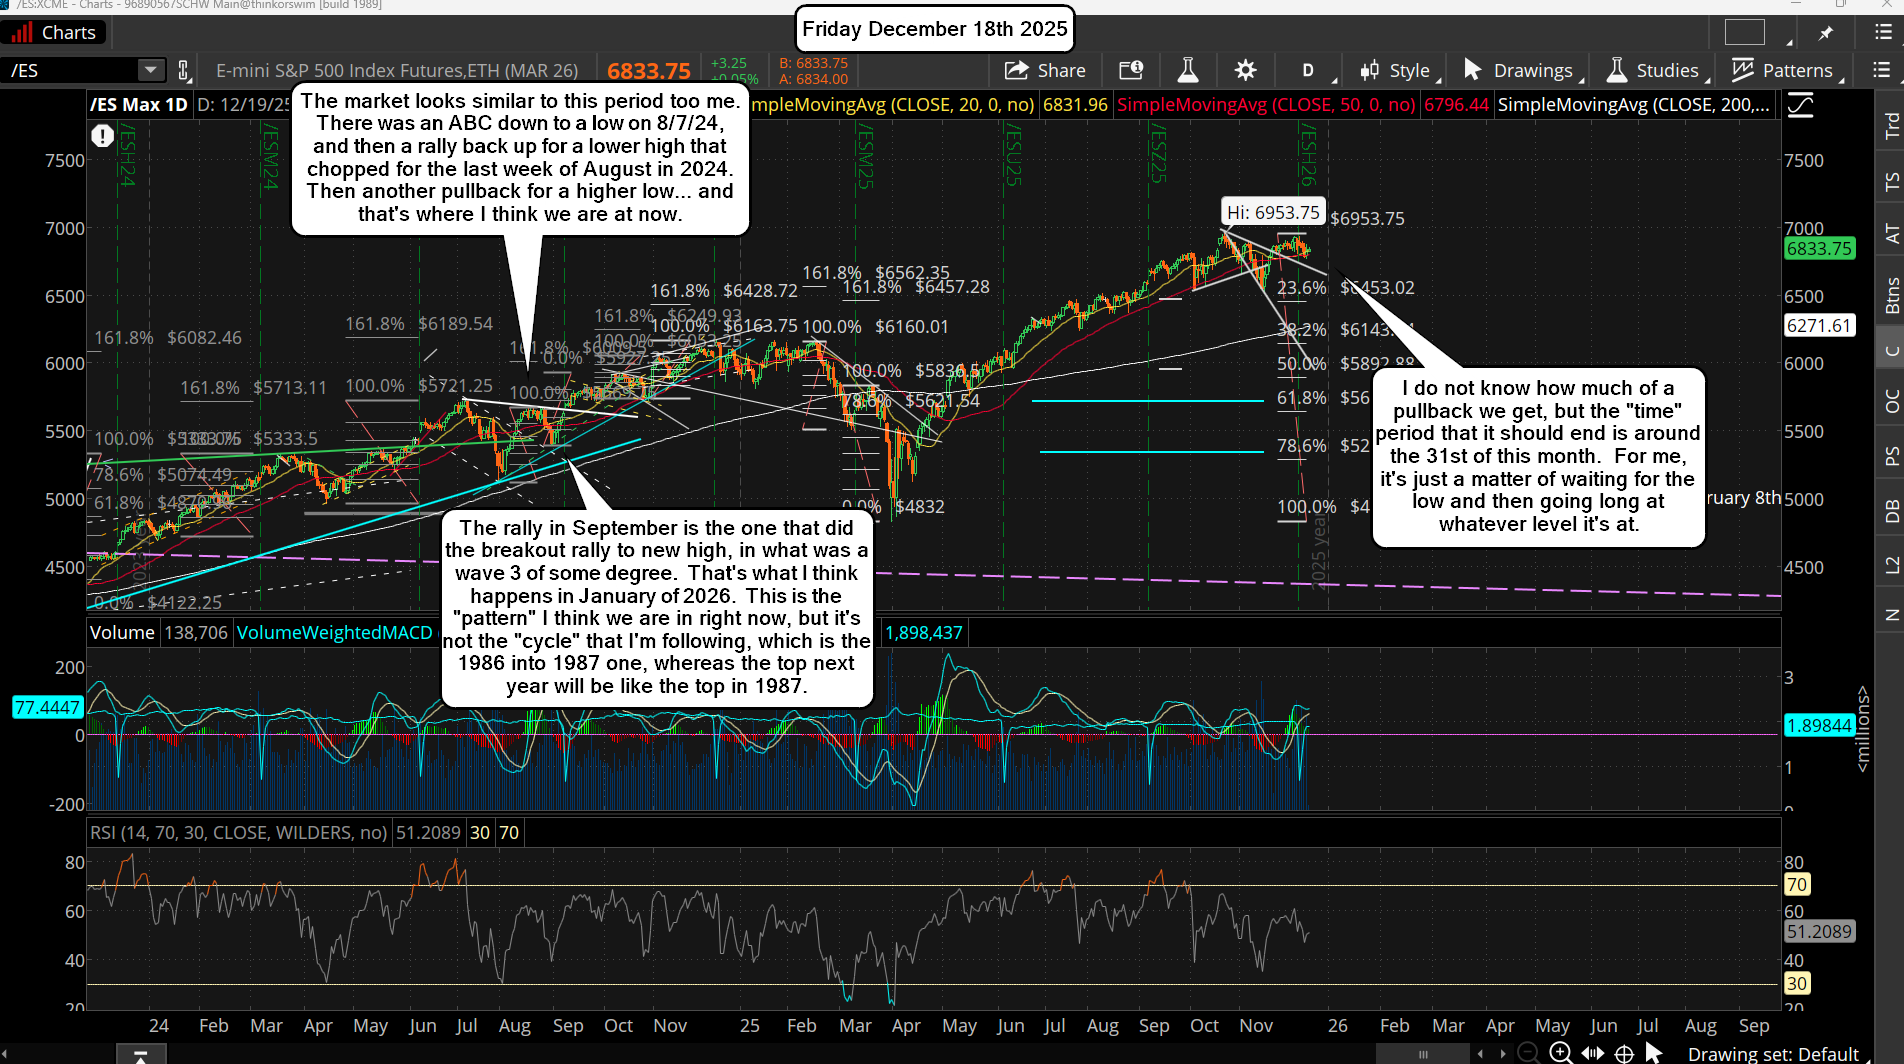
We got the 30-50 point move up on Friday as I thought was possible. I did take a short and will get another one early this week if given another good spot to take one. The rally that we had last week was very similar to the 3/17/22 to 3/30/22 rally, but not equal in "time" though. That entire decline looks similar in "pattern" as there was an ABC move down from the high on 1/4/22 to the first low on 1/24/22. Of course it's not "day for day" an exact match but it sure looks like our decline from 10/29/25 to the low on 11/21/25. Look at the charts below...

Even the about of the pullback was similar as that first ABC down in 2022 was roughly to the 23.6% Fibonacci Level when starting from the 2020 COVID low up to the 2022 high. If you start at our April 2025 low (which also was similar to the COVID crash in "pattern") and go up to the current high, then the decline we had few shy of the 23.6% level, but was close. After the big bounce that happened in 2022, which is similar to last weeks bounce, the next decline went down to make a new lower low on 2/24/22, which if we did that again I think we will be looking for roughly the 200 Day SMA around 6200.  Look at the charts below...

If the pattern remains similar we could see a quick 1-2 day pullback early this week, then a move back up for a slightly lower high this Friday then last Friday, which is like the two highs on 2/2/22 and 2/9/22. If this happens again it will be next week when we see the bigger drop, which carries into the following week as well. It could bottom right into Christmas if the pattern continues to repeat. Even the Santa rally is in that prior chart, and it would be one that fools everyone as back then it rallied from the 2/24/22 low until 3/2/22 (which could be equal to January 2nd 2026?) and the dumped for a couple of weeks to dance around the prior lows but not break them. Then a big rally back up followed, and that might be equal to a second half of January 2026 move? If it repeats February and part of March will be ugly for sure.

But I'm getting ahead of myself as while the pattern has been tracking recently it doesn't mean it will continue. We'll just have to take it week by week, and for this week I'm looking for a wave 1 down inside a C wave to play out, and a wave 2 back up. Again, that's similar to the 2022 pattern as well, whereas last weeks rally was a bigger B wave up, with the ABC down from the all time high being the bigger A wave down. We should be starting the bigger C wave down this week and end by Christmas. That entire move will be an ever larger A wave, and the rally back up in January will be a larger B wave.

So, for the short term, I see a 673.72 FP on the SPY that was put out last Friday. I'd say that will hit early this week and it will be my wave 1 down. Then we bounce into this Friday for wave 2 back up.

Have an blessed day.

ES Morning Update November 28th 2025

0

I hope everyone had a great Thanksgiving yesterday. I enjoyed it for sure. Oi, back to the market. Oddly we still haven't seen any red day for a week now where the market "paused". It's just been a grind up day after day with no way to get out if you are a trapped bear. I have to think that if the bulls plan on making a new high they need a red day.

Today would be ideal as the markets close early at 1pm EST and they could keep it as a small one. But if they decide to go up another 50 points (or whatever) they are going to exhaust themselves I think. Meaning they won't have anything left in the tank to make a new high next week. Pullbacks are healthy and if done right they get new bears to short and then those bears are fuel for the next move up.

But right now I fear they are running out of bears as a non-stop rally like this has most bears throw in the towel on shorting and then they become bulls and start taking longs. When that happens you know we won't see 7000+, or even just a slightly higher high as when everyone is long there's no more buyers to get it up higher.

So if we see another good up day today I fear will will not see a new high and will rollover next Monday to start the next leg down. If we get a decent red close then we can go higher again next week. I'd love to see 7000+ to short but without a "pause" day (slightly red) those odds go down quite a lot. If we see another nice green day today I'm going to be looking for a short.

Have a great weekend.

ES Morning Update November 27th 2025

0

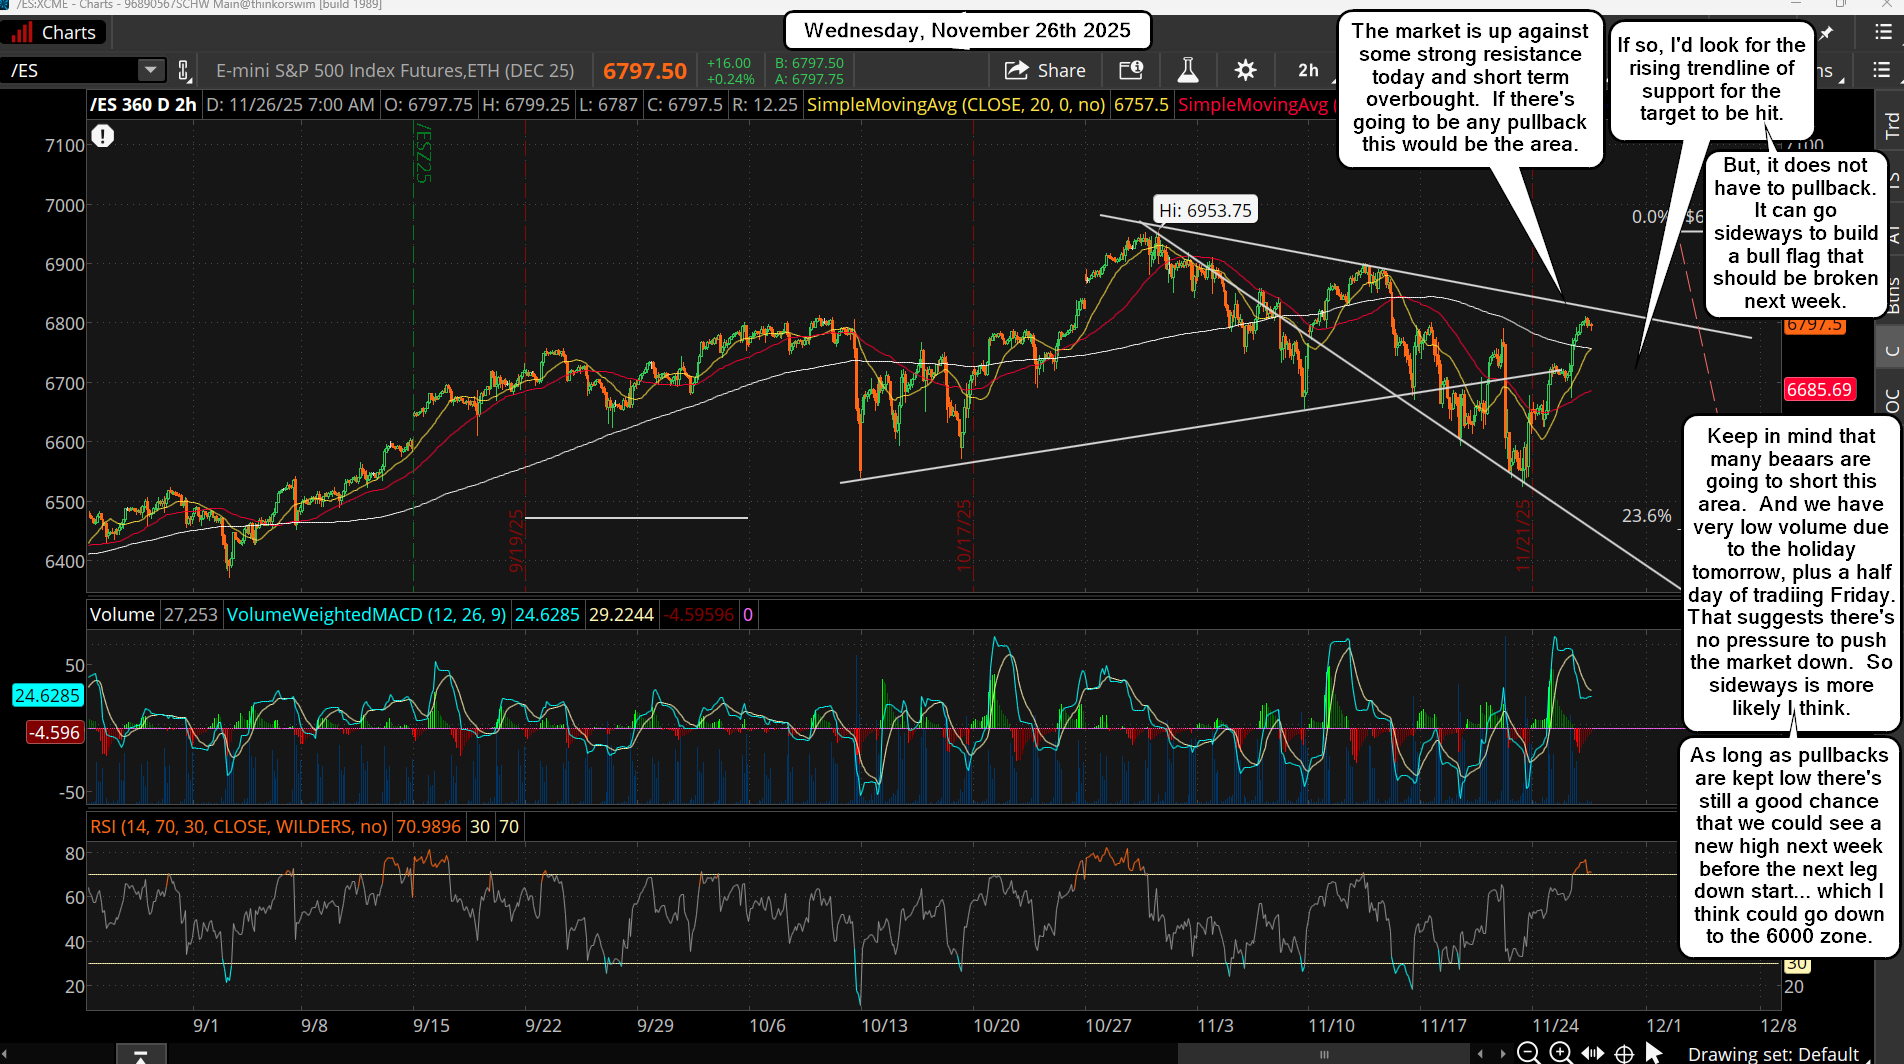
Well, the bulls did pause for the first couple of hours yesterday but the dip was bought and we saw the market grind higher afterwards, and into the close. Maybe today pauses some? It doesn't have too of course, as it could continue to have intraday pullbacks that reverse back up afterwards, but we should see more resistance when the falling trendline on my chart is hit today or Friday.

That will be the likely spot where bears short again I suspect. It's roughly 6820-6830 if hit today. If there's a pullback I think it will only be to backtest the 6780 zone from yesterdays high, as that's a triple top zone from 11/16 and 11/20, along with 11/25 of course. It should be support and from there we should continue higher into next week. Don't forget that Friday closes early at 1pm EST and of course we are close tomorrow.

I may or may not post on Friday.... probably not as there's no reason to do so. I think next week is up early on with a fade late in the week. I also think we top next week and start another leg down into late December, which a lower low is likely. Whether or not a new all time high is made next week is unknown, but again, if they do... the drop will be deeper.

Have a Happy Thanksgiving.

ES Morning Update November 25th 2025

0

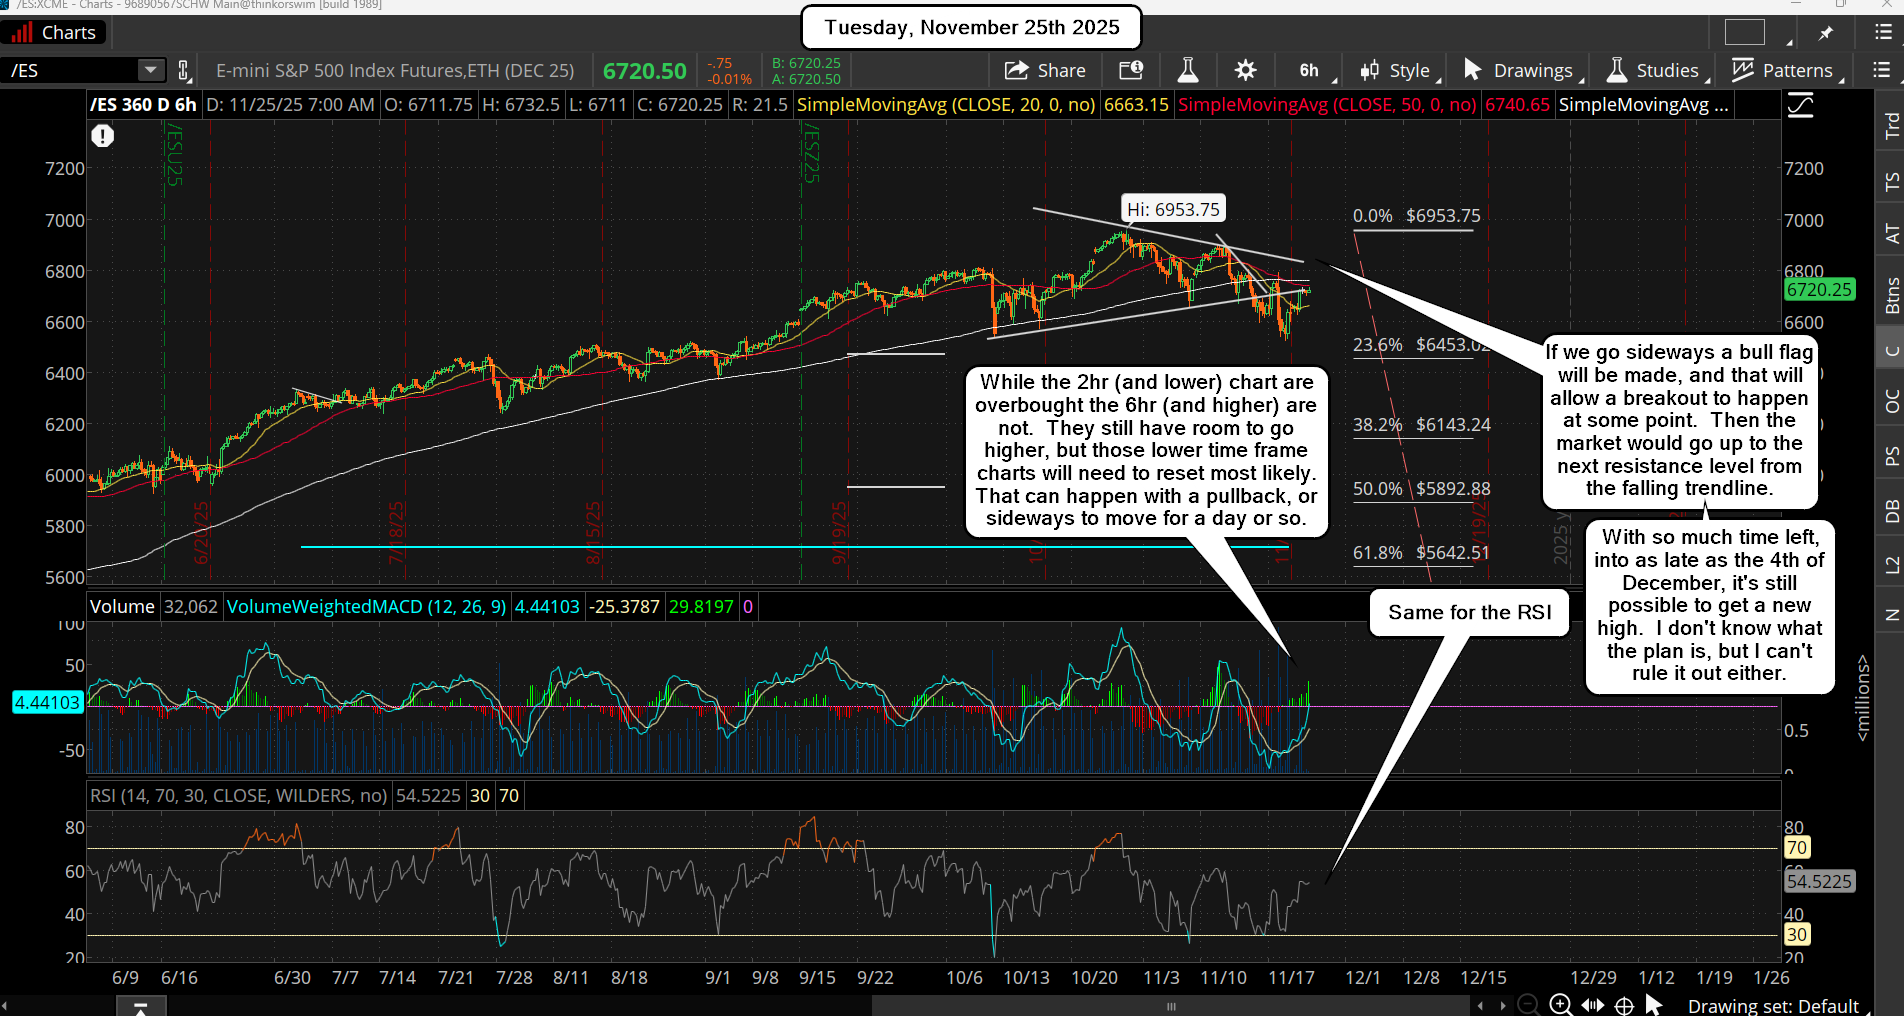
Short term charts are pretty overbought now (2 hour and below), so today could be a "pause" day where we might close slightly down or slightly up. But as long as it's not a big pullback it should be bought back up as the market is still in the bullish cycle period until as late as the 4th of next month. It doesn't have to go that far in time but I have to think that we should at least stay up into next week to work off some of the extreme bearish readings. Meaning it might not make a higher high, but should chop around whatever higher level it reaches for awhile before rolling over in the second week of December. Personally I think they will reach a new high to take out the stops on the bears that are shorting now, and those that have stops above the current all time high. But I don't see it reached this week... as it's likely going to drag into next week due to this week being shorten due to the Thanksgiving Holiday. Not more to add, so I'll keep this update short.

Have an blessed day.

ES Morning Update November 24th 2025

0

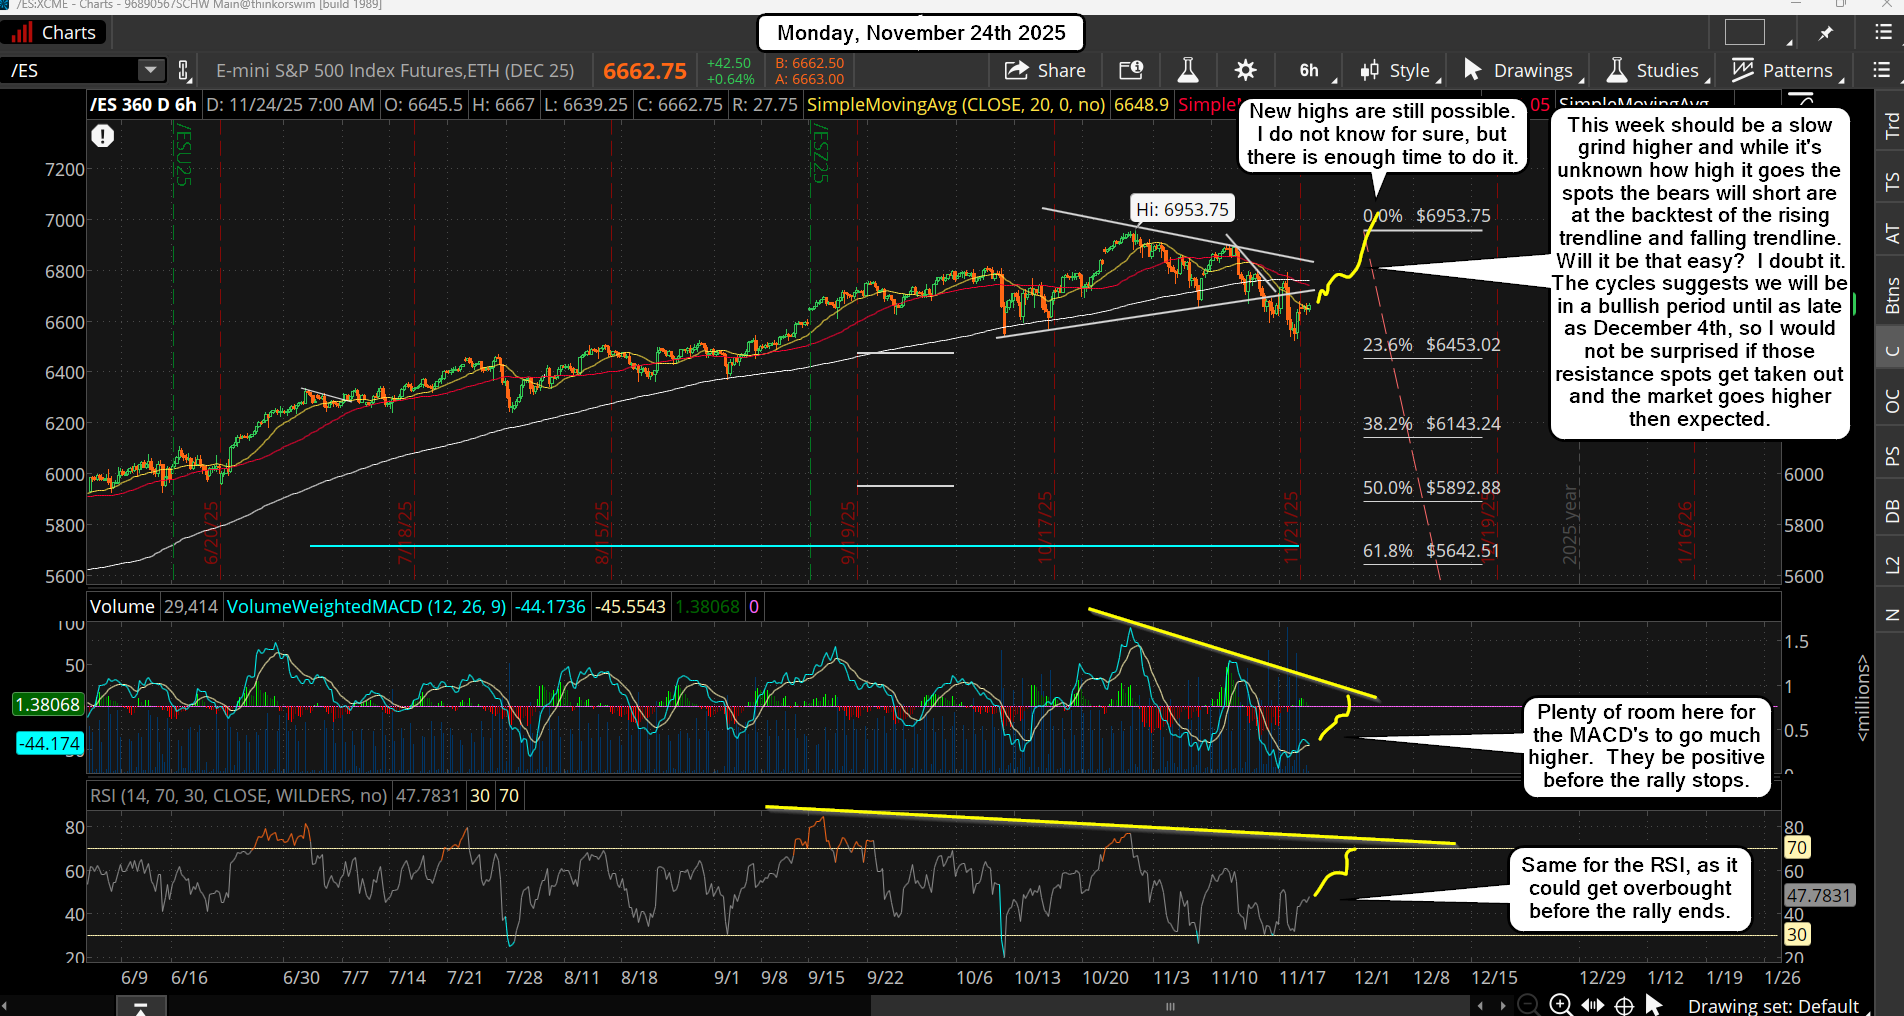
Last week was wild with all the big swings up and down but as we enter this week of Thanksgiving, and into next week, the bulls have the ball again according to the cycles. I said last week after the surprise big drop that odds were low that the bulls would make a new high, but really that's not the case.

With so much time left the bulls could still reach the 7000+ level into next week as it's really not that many points higher when you really look at it. Bears are going to be focused on the backtest of the falling trendline of the triangle, which is an obvious target for a move back up to end and rollover from. It's also a picture perfect right shoulder for a head and shoulder pattern. But with the Fear and Greed index buried so deeply in extreme fear I just don't think it's going to be that obvious and easy. Now if the bulls spend all of this week and part of next week to just reach that zone, then yes, that's likely all she wrote for them.

But I suspect we'll see that falling trendline hit this week, and the expected pullback from it won't happen like the bears are expecting. Sure, there should be some reaction there, but I think any pullback will be only be done to trap more bears before the squeeze through it. New all time highs are still possible into next week if the bulls want them.

We could then see a negative divergence setup on the MACD's of the daily chart of the ES and SPX, and even positive divergence on the VIX if it makes a higher low. That would be the perfect trick on the bulls and bears both to hit 7000+ into late next week when the bears will finally give up and the bulls will be thinking the Santa Rally started early and 7400, 7500, or even 7600+ is coming in December. But that is the trap on those bulls as they will be fully long and all the bears will have capitulated after the new highs.

It's a sneaky setup for a large drop to 6000 or so in front of Christmas, when no one is expecting it. It happened in 2018 and it could happen again this December, and I suspect that whatever high we get into next week will remain the high for several months as after the real Santa Rally happens January should have another drop even lower. Ultimately the ES is going to have to close the gap at 5339, but that might not occur until February or March of next year. After that we should see one final blow off top rally into April or May where 7600+ is likely... then the bear market starts.

Have an blessed day.

ES Morning Update November 21st 2025

0

WOW! I got completed blindsided with yesterdays drop. I did not see that coming. The bearish period, from prior cycles, was calling for a low between the 17th-19th of November and then up into as late as December 4th and as early as Thanksgiving. (the 27th), and that's still valid, but I thought the low was already in on Wednesday. Yesterdays drop was completely a surprise to me.

I had originally thought we would take out the low from October 10th and maybe hit the FP on the SPY of 640.44 to hit the stops on the bulls, but I gave up on that thinking when the market seemed exhausted (on the downside) with the low on Tuesday. There was positive divergence on the charts and it was right in the middle of the cycle low period.

But yesterdays early rally was a bull trap, not a bear trap. So while can still rally up into the end of the month odds of a new high are much lower now. I'd say we first need to see a bottom which should happen today (maybe the 640.44 FP after all?).

Once the rally gets going though I can only see a move up for a lower high into as late as December 4th, but I doubt if it last that long. Most of the time we get see these 3-4 day squeezes that hit some overhead resistance area (the falling white trendline?) and/or a Fibonacci Level (61.8%?)... then it's over with. Bottom line here is that we'll still likely get a rally next week, but it should ONLY be a retracement for a lower high and then we drop much lower in OPEX of December.

Have a great weekend.

ES Morning Update November 20th 2025

0

So far so good, the bulls do appear to be back and the low is very likely in for now. I don't expect to see much downside from here going forward. Any pullbacks should be brief in time and small in price, and might even happen afterhours or premarket

I do expect to see a grind higher day by day until we hit the falling white trendline on my chart, which we should normally pullback from, but I tend to think it will be small again and probably just grind sideways to down a little at it. Then it will push through it afterhours and backtest it before going higher again.

Bears will short this move up at every resistance point but the algo's will see where they put their stops and will keep going higher until it hits them and takes them all out. With so much time left for the bullish period I can't rule out a new all time high with that magical 7000 level being the target.

Have an blessed day.

ES Morning Update November 19th 2025

0

We hit and pierced the 6602 level where C=A in price, and we have lots of positive divergence as well as negative divergence on the VIX. Plus the bearish period from the cycles is ending now, so everything tells me we are going to rally up into the end of the month where new highs are possible, but no guaranteed.

Could it go lower? Sure, but odds are NOT skewed in favor of the bears now, and are turning very bullish. So I have to be a bull now and will stay one until the end of the month.  I had hoped for this pullback to reach the 588.79 FP on the SPY but time has run out for the bears and it's very unlikely to go any lower at this point.

Have an blessed day.

ES Morning Update November 18th 2025

0

A very controlled decline yesterday... super sneaky. I was looking for either a move up at least get close to the falling trendline to play out, and then down. But they just rolled over very slowly and declined all day to a new lower low then the Friday low. The rising trendline was broken on that move down but was recovered back into the close.

I said in yesterdays post that we could have a Bearish Wave Count play out where the C wave was equal to the A wave, and NOT a deep one to the 640.44 FP on the SPY like I would have loved to seen happen. This is looking more likely now that the C wave has either already ended at the 6658.50 low yesterday or will go a little low again today to reach the 6600 level. With the VIX up over 10% yesterday odds are very strong that we'll see a green day today or tomorrow at the latest.

If we decline again today for a lower low then it's a big buy in my opinion as there's positive divergence forming on the 2hr and 6hr chart of the ES, so a strong move is near. And the bearish period (from cycles) is ending today and/or tomorrow. The bullish period then starts and goes into the end of the month, where we could see a new all time high reached, like the 7000 level that the market is very attracted too.

We have earnings from NVDA out Wednesday too, so that could be used as a trigger for a squeeze to start... especially since we will be entering a bullish period then. All things point to a strong rally starting tomorrow, so if I was a bear I'd be looking for an exit today as "time" is running out for them.

Have an blessed day.

ES Morning Update November 17th 2025

0

The market did hold on the lower rising trendline and rallied nicely from it Friday. Today should end that move up and hopefully it reaches the top falling trendline by the close. If so, I'd look for one more pullback into Wednesday before the big Thanksgiving squeeze to 7000 starts (maybe?... there's a bearish scenario too).

That pullback could retest that lower rising trendline one more time... hard to say for sure. But as long as it's a higher low it's going to end up being my small wave 2 down with the rally from the low Friday being the small wave 1 up, inside medium wave 3 up. It does not have to be very deep, but MUST be a higher low then Fridays low.  If it doesn't hold then we are not in that Bullish Wave Count and instead we will be in the Bearish Wave Count.

The Bullish Wave Count...

As you can see, if we are in the Bullish Wave Count the move up from the Tuesday/Wednesday low will be the small wave 3 inside medium wave 3, which should last into the end of this month to finish off the remaining waves before a 5-10% correction in the first 2 weeks of December is expected to happen.

This Bullish Wave Count should have the market reaching the 7000+ level into Thanksgiving, and it is my "lean"... but I could be wrong and we could be on the Bearish Wave Count instead.  If we are on it then the drop into the low last Friday was a small wave 1 inside a medium wave C down, and the rally up from Fridays low was the small wave 2 bounce, which should end by the close Monday.

The Bearish Wave Count...

If we are on this path we'll see a new lower low into this Wednesday where the bearish period should end (cycle wise), and that final low could reach the 640.44 FP on the SPY, which is lower then the 10/10/25 low as well.  If this happens then I suspect the rally up into Thanksgiving will not reach 7000+ but instead it will put in a lower high (double top but pennies shy of a new high) to fool all the bears into thinking the low is in, and suck the bulls into going long looking for a breakout.

But it should not happen as if this does this move into the end of this month the bullish period will end and we'll enter a bearish period (cycle wise) for the first few weeks in December.  This is where a 5-10% correction could happen, and that's where I think we could reach the 588.79 FP on the SPY.

Side Note:  ... it does NOT have to go that deep.  The drop for the A wave was 298.25 points, and if C=A then 298.25 points down from the high of 6900.50 on 11/12/25 is 6602.25, so that "could" be all there is?

Remember that there's only 2 days for the drop for the C wave (in the Bearish Wave Count) to play out as after this Wednesday cycles get bullish again, and stay that way into the end of the month, and/or the first few days of December.

As for the big drop for the 5-10% correction... a drop like that would get all the bears looking for the April lows to get taken out, but that should not happen.  It will create enough bearishness though to get a powerful squeeze going the rest of the month and into early 2026.  This could be the plan but I won't know until I see where the market stops at this Wednesday as only then can I tell which wave count we are on.

On a big picture view the February 19th, 2025 high of 6166.50 ES was likely the end of an Extra Large Wave 3, with the October 2022 low being the bottom of the Extra Large Wave 2, and the January 2022 top being the end of the Extra Large Wave 1 up... which started from the 2020 Covid low. The pullback into the April 2025 low was the Extra Large Wave 4 most likely, and we've been in Large Wave 1 up, inside Extra Large Wave 5 since then.

The expected pullback in December should be the Large Wave 2 inside Extra Large Wave 5 up. This sets up a massive rally after that low for 5 Medium Waves, inside Large Wave 3 to play out into the first quarter of 2026. Then we'll see a Large Wave 4 pullback and Large Wave 5 up will be the blow off top somewhere between March to May I'd estimate. After that we get a bear market the rest of 2026.

Have an blessed day.

ES Morning Update November 14th 2025

0

We saw the move down I was looking for, and it filled the 6765 gap on the ES too. It's likely going to start back up today and into Monday possibly, but we could see another small pullback into next Wednesday. Call it a wave 1 up from the current low today/yesterday into a Monday/Tuesday high, and then a Tuesday/Wednesday wave 2 pullback.

After that the wave 3,4, and 5 should take the market up into the end of the month where we could see a new all time high... like the magical 7000 level maybe? I don't know what the high will be but the timing of the next high is around the end of this month, possibly the first day or two into December. It's from that high that we should (finally) see a 1-2 week pullback of 5-10%, where the 640.44 FP on the SPY could get hit.

Not much else to add. We are the Bullish Wave Count from this past Mondays update. We should turn back up today and rally into the close and/or next Monday. How much I don't know? But half the drop (or more) seems likely.

Have a great weekend.

ES Morning Update November 13th 2025

0

Today should be the day for the market to decline and put in a low of some kind. I think the cycles are running a little behind as if we start down today it probably won't put in a low today as well, but carry into Friday... maybe even Monday/Tuesday if it turns into a deeper then expected drop?

Hard to predict the dept of it, but I covered the Bullish and Bearish wave counts on Mondays post, so use it for refer if this pullback turns into a flush drop to catch bulls and bears by surprise. I feel like it's only going to go down to around the 6800 zone, but my feelings are irrelevant. If there's some negative news event we could see a hard flush out drop instead. We shall see...

Have an blessed day.

ES Morning Update November 12th 2025

0

Tuesday chopped around with a dip in the morning and rally into the close, but overall it really did what I thought could happen. Today we should see the market start to pullback small with the biggest move on Thursday and into early Friday probably. It could be either scenario, the Bullish one or the Bearish one, but it's looking more like the Bullish one will play out.

Remember that "time" is more important then price and the expected low is on the 13th/14th, and therefore whatever low we see will be it for the downside in my opinion. I would think we could fill the gap up on Sunday night at the 6765 ES high from last Friday. That would make the right shoulder for an inverted head and shoulders pattern.

It would be the wave 2 pullback as well with the rally up from that Friday low to the high from it being the wave 1... which sets up the wave 3 up into next week for OPEX. I have to think we'll see a new all time high easily if the pullback is only to fill that gap, so 7000 is very possible. The Bearish case would require some kind of new event to get such a large drop to happen in the next few days. I cannot predict that, so I won't even try. I'm just going to be focused on the date window of Thursday or Friday, and whatever low it is should be the best opportunity to get long for the wave 3 up.

Have an blessed day.

ES Morning Update November 11th 2025

0

Very nice squeeze yesterday as it even surprised me on how high it went. Nothing has changed though as there shouldn't be much left on the upside as we should start back down today or tomorrow with the biggest part of the decline expect on Thursday or Friday. I still do not know if it's going to be a C wave decline or wave 2 as discussed in yesterdays update.

We'll just have to let it get going first to see what happens, but the bearish period will expire by this Thursday or Friday and then the cycles will turn back up to bullish until the first week of December. The next 2 weeks are normally bullish anyway as it's the Thanksgiving Holiday period, so if we get a flush out, where the bull stops are taken out below the October 10th low, then the move up should be very strong as again, it will be powered by squeezing the bears and have very little bulls in it.

Beside the cycles pointing to a low this Thursday/Friday it's also a common pattern that used too happen a lot back in the past when there was only the monthly options. It was called "The PitBull Low" from Marty Schwartz as he first discovered it (as assume?) back many decades ago. It's where the market makers take the market down the week before the monthly OPEX to crush the longs and lure in the shorts. Then the week of OPEX (next week) they squeeze it hard after the retail longs got shook out. Maybe it happens again into this Thursday/Friday, who knows?

Have an blessed day.

ES Morning Update November 10th 2025

0

This week is an important one in my opinion as we should put in a low around the 14th, and then start a nice squeeze higher into the first week of December. The question is... will it be a higher low or a lower low? I can't answer that question unfortunately, so I'm just going to cover both wave counts and let whichever one play out that the market wants. I want to be ready for the rally after the low is put in as it should be a nice one. First, let's go over the bullish wave count below...

In this case we have already ended the wave 4 pullback and the move up from Fridays low into a likely high today is a wave 1, and the expected move down into the 14th would be a wave 2 for a higher low. The expected upside target today (possibly into Tuesday) is 6840-6870 on the ES, and that would end wave 1 up.

Then we'd see a choppy ABC down for wave 2 that bottoms around the 14th, which from that low we'd get a very strong rally up into the first week of December where we should reach 7000+ by then. The only issue I see with this wave count is that I cannot force an ABC down from the all time high into last Fridays low. It's a clean 5 wave decline and there's really no way to claim a valid ABC as what should be the C wave is too short.

Normally, there is either a one wave decline or three wave (ABC) for any wave 2 or wave 4, as they are corrective waves. For this reason I have to be open for that 5 wave decline NOT completing the wave 4 and that is is only the A wave inside a bigger ABC down for wave 4 that should make a lower low into the 14th with the C wave "at least" equaling the length of the A wave.

The all time high is 6953.75, and Fridays low was 6655.50, which is 298.25 points. So, if we bounce today up to 6850 (for example) then roughly a 300 point move down for the C wave would target around 6550... which is a perfect A=C ratio. However, it's more common for the C wave to extend to 1.5% or 1.618% of the A wave, and that would put the ES down in the 6350-6450 area, and that takes out the low of 6540.25 on October 10th... plus it would fail to reach the 6000-6100 area where so many traders are focused on.

If it did this it would turn back up strongly from that 6350-6450 zone and squeeze hard into early December with all the bulls chasing it up because it didn't go the the obvious 6000+ zone where everyone (bulls and bears) want to pile on long. The market doesn't want it to be easy, as it loves to inflict the most pain as possible. Taking out the October 10th lows to hit the stops on the bulls, but not reaching the 6000+ zone where the bears want to exit and become bulls, will trap those bears during the move back up and keep the bulls on the sidelines. To me, this looks like the perfect trap as it will trick the most traders. Will it happen? Only time will tell.

Have an blessed day.

ES Morning Update November 7th 2025

0

Yesterdays move down took out the low from the 4th and then bounced back up to around that zone again. I was thinking we stay above and break it next week, but in the end nothing has changed. We should still bounce up into Monday and decline again into Wednesday where yesterdays low should be tested again. All of this up and down, while it looks like a big move, is really just chop to burn some time so that the bigger time frame charts can work off some of the extremely overbought conditions and setup the market for the next big squeeze higher. In my opinion there's no good trade setup here, not short or long. But next week we should see a good long setup happen, which should take the market up into the first week of December where 7000+ should be hit.

Have a great weekend.
ES Morning Update November 6th 2025

0

Chop today is what I'm looking for as support held yesterday and the market bounced. It's not ready yet for another new all time but after one more pullback mid-late next week we should start another big rally up.

I spoke about massive QE on the sidelines several weeks ago and I thought it wouldn't be used until we got a correction to my target of 5339 on the ES to fill the gap. But I was wrong as the Fed injected it into the market last Friday as explained in the video on yesterdays post. This tells me they will not let that correction happen as they want the market to continue higher for some unknown period of time.

Maybe they keep it up all year, who knows for sure? But right now it's obvious that they won't allow any crash to happen, so I expect chop for about a week to work off some of the overbought conditions on higher time frames, and the only way to do that is to either chop to burn time or drop in price quickly to get it oversold. I'm thinking that we'll get down close to the 6700 zone on the ES at some point next week, and from that zone we'll start the next nice rally up into the first week of December where we should hit resistance and exhaust that 2 week rally.

Have an blessed day.

ES Morning Update November 5th 2025

0

Today is the 5th of November and nothing has been blown up, so it's a non-event for this year. Therefore it's back to the technicals and they are getting short term oversold and suggesting a bounce is coming, but not a new high. The bounce could last into next Monday and will probably be a B wave of some degree and the current pullback would be the A wave.

Then a C down into next Wednesday or Thursday should finish the correction, which will probably hit the rising white trendline on my chart that is in the mid-6600's now. No crash basically. It's been avoided at this point and after the coming ABC finishes next week it's off to the races on the upside again. On a side note I found this interesting video yesterday about liquidity in the market and how they injected a massive amount of QE into the market last Friday, which explains how they are currently holding it up and preventing the crash now. That video is below.

Have an blessed day.

ES Morning Update November 4th 2025

0

Today is the last for the market to stay directionless as tomorrow is the 5th of November and "if" anything is going to happen that's the day it must start. If nothing happens bad, like in the movie (talked about in last Fridays post) then the market should go down small into the 12th or so. If the events in the movie happen we should crash instead, and bottom into the 21st or so with the gap at 5539 on the ES being the target. I don't know what's going to play out but it should all start by tomorrow.

Have an blessed day.

s2Member®