
Wednesday Update...
(to watch on youtube: http://www.youtube.com/watch?v=nX_ckxJ4OMs)
Red
____________________________________________________
Will the market bounce on Monday... I don't know? It could crash, as the charts are still very bearish right now!
However, many of the indexes have actually hit their double bottom support levels from the first week of March early this year. The S&P500 is one of the few that still hasn't hit that 1250 area, which means that we could still see some more selling early next week. But, I do think that we are near a short term bottom before a nice rally back up to form a wave 2... and then one nasty wave 3 down!
(to watch on youtube: http://www.youtube.com/watch?v=bfnTMuxzy_A)
If we do sell off some more next week it would likely be a final wave 5 down inside this larger wave 1, and should find support at the 1250 area. This doesn't mean it won't pierce through it on some type of "flush out" move, cleaning out all the stops the bulls have just waiting to be cleared. I'm just not sure if they want to clear them out now, or rally first and then go back down later?
It's a tough call as the market is resting on the 200dma on the daily chart, and should have a multi-day bounce from it. But, it looks like it already had the mulit-day rally from the first hit, therefore the second time is a weaker support level that could be broken very easily... especially when you notice that on a weekly chart the 50ma is coming in at 1235 and should act like a magnet for the market to hit.
That leads me to believe that we could see more selling early next week before any relief rally starts. The only wildcard is if they come up with some perceived fix for the Greece problems... (or some surprise stimulus put into the market). Right now I just don't see it happening... which makes me believe that we are likely to continue down more next week, before any relief rally.
While I'm looking hard for a reason for the market to bounce, I'm not finding any. Yeah, we should rally, and yeah we're over sold on many charts, but I'm having my doubts on any rally coming until we go lower first. I'm a bear in disbelief right now, as it doesn't look like the same market we've seen for the last 2 years, where every sell off was met with a wall of bulls pushing it back up.
So... Where's The Bulls?
Did they all die when the stimulus money ended? It certainly looks that way now. I'm beginning to believe that "oversold" can stay "oversold" for much longer then we think it can... much like the last 2 years with all the "overbought" being ridiculously "overbought" to the point of insanity for any trader to believe. I guess we have truly (and finally) started Primary Wave 3 down, as the market just feels different this time around... don't you agree?
As for the short term charts, they are all mixed. The 60 minute is pointing up, the 30 minute down. The daily is pointing down too, but from oversold levels. I'm just not sure what to think about Monday? It could go either way. If there is light volume, the bulls could close the day positive... but if the bears want to attack, the bulls will retreat very quickly!
The bulls are seriously wounded right now, as a whole lot of technical support levels have been broken. The bears are in full control, and only if they decide to take a day off and rest will the bulls regain any ground... and somehow I don't think they will rest until the 50ma is hit on the weekly chart.
This chart below (from Astrocycle.net) shows an interesting correlation with the current bottom and vix level of 24, with the previous bottom and vix level of 28. This could mean that one final move down (in some type of 5th wave, inside of a larger wave 1 down) is yet to follow. The question is... will it come early this week and then rally back up, or rally up a little first and sell off later in the week?

Another interesting thing on the chart is the blue and red tick lines at the top of the chart. Reading them I would come to the conclusion that a move up would happen first. This is the 60 minute chart, so if it does move up first, it shouldn't last more the a day or two. Not shown on the chart is the next moon cycle on the 3rd of July, which could be another turning point... meaning that we should put in a bottom or a top. I don't know which, but if we go up early in the week, and then back down... I'd say a bottom.
Of course the opposite is true if we sell off to the 1235 area first and then rally into the first week of July, as then I'd expect a top to be put in around that moon cycle, followed by a much larger wave down to follow. All in all, I'm just going to say that calling the short term direction right now is a very tough call. But, a lot of evidence points to the high being put in, and Primary Wave 3 down starting... meaning, sell the rip's is the new theme!
On the darkside... nothing much worth mentioning right now. The old cabal gangsters are still in control, but slowly being pressured out. More recently they fled in fear from the Bilderberg meeting under threat of arrest... the first time ever! LOL! Here's the latest interview Ben Fulford did with Jeff Rense.
(to watch on youtube (part 1 of 4): http://www.youtube.com/watch?v=2eGNbnAplDs)
Part 2: http://www.youtube.com/watch?v=nGymXBLvWo0&NR=1
Part 3: http://www.youtube.com/watch?v=zUpeafs621s&NR=1
Part 4: http://www.youtube.com/watch?v=QdnHMO9IUQ0&NR=1
That's it for now gang. If you find an interesting story, email me it and I'll put it up here on the blog. Good luck as usual...
Red


Red, nice video. What are your thoughts on the fact that the weekly S&P stochastics are more oversold than May of 2010 after the flash crash, yet there has been less price destruction on this sell off than during the flash crash period?
How do figure that? The STO’s were above 80 on May the 5th and didn’t hit the 20 level until the end of June, 2010. At that point, the MACD’s had just hit the zero level and fell below it slightly for several weeks before starting a big rally in early September.
While we are approaching oversold levels on the weekly chart, we aren’t there yet. The daily is another story of course. However, it’s really weird right now, as something just feels different. I can’t put it in words. But I think we have put in a final top for quite a long time. The gangsters are out of money, and out of time.
The whole system is reaching a point of exhaustion, and will soon collapse on it’s own weight. All those derivatives can’t be paid, and a crash must happen to clean them out of the system. I still think the market will go down until summer is over, and rally into the fall for the elections… then start crashing the week of October 23rd (per the end of the Legatus meeting).
You figure it by looking at the stochastic value. Look at any index, the Russell, Nasdaq, S&P. It’s all the same. The full stochastic values on the weekly charts now are LOWER than they were during the flash crash correction on the weekly chart in May/June 2010, yet there has been less selling in net. The flash crash period saw the S&P shed 200 handles. We’ve only shed around 100 and it’s taken more time and gotten more oversold.
I’m afraid to say it, but the bears are simply too weak. As you like to say, many charts are starting to “reset” without any real technical damage done.
This all supports the notion of a renewed uptrend and new highs by the end of the year. When I saw how terribly weak the bears were during this correction (very little damage done with massive bearish sentiment) I have no choice but to be bullish for the time being. In fact, I’m not more bullish than I was, because of how weak the bears are, and I now expect the NDX to rise 60% over the next two years, in addition to the S&P making new all time highs.
This is temporarily my view. If the bears can pull something out of the hat and crash this thing, I might believe otherwise. For now, the facts just don’t support it. And I also feel that all the Elliot Wave people out there are full of it….P3….I mean, who actually trades that garbage? It’s meaningless.
Yes, EW is an “after the fact” indicator, and I only use it as speculation. However, I must disagree with you on a new high. During the May/June 2010 period the monthly chart was under the zero level on the MACD’s and never even got a bearish cross. I just went sideways during the drop in the market and then resumed it’s way back up.
Now the MACD’s are between +25 and +50 and rolling over. The whole move up from the 2009 low has now put in a clean ABC pattern. The MACD Histogram bars now have a negative divergence on them, and the entire chart from 1997 to present shows a perfect “MA” pattern on it… very bearish. The right side of the MA is just now starting and projects a low well below the March 2009 level.
As for more money put into the system to keep it up… I don’t see it happening. This is just the start of a huge move down in my opinion… but we are both just guessing in the end, and neither of us have a crystal ball.
The moves over the last decade look like a double bottom to me, or a sideways consolidation at best. It looks very bullish until proven otherwise. Speculating on this alleged P3 has been the quickest ways for bears to lose their shirts, and I don’t see it ending anytime soon. They will continue to bet against a strong rally until they give up hope. And maybe then I’ll be turning bearish.
Aren’t the next presidential elections on Tuesday, November 6th 2012? I don’t think an “election manipulation rally” is in the cards yet. I’m like you though Red, I want the elections to happen now. I can’t stand the current regime…
Thanks for the update video.
Duh… yes they are in 2012 for 2013, not 2011 for 2012. What was I thinking? Sorry about that… but I still see a collapse starting the week of October 23rd, 2011 as that’s the end of the Legatus gangster meeting.
The Legatus meeting could be the catalyst… I am sitting on my hands here while facing a possible head and shoulders pattern and an inverse head and shoulders pattern at the same time. The market doesn’t know which way to go yet, but one things for sure, when it decides, it’ll be a strong move after a retest of the neckline.
Agreed Kevin… I was very unsure which way the market would go today. There were arguments for both ways. Now that we see it, we have something to work with. I’m now leaning toward this rally continuing until the end of the week, making a larger wave 2 up, with wave 3 down to follow after the 3 day weekend.
Of course we could just roll back down tomorrow, but I think we got more upside to go first. Beside that, if they vote in favor of a $12 billion euro bailout for Greece this Wednesday, this could give the market a little more bounce. With George Soro’s saying “we are on the edge of collapse”, I tend to think the opposite and suspect a nice but short lived rally.
It’s GRAND JUBILEE 666 Week!!!! Time for the market to tank and cut through the 200 day average.
Today is 23years 8months 7days from 10-19-1987. Futures are down quite abit for crude oil,silver, and currencies although stock futures have levelled off. But with the currencies and in particular near a multi-week low and crude and silver threatening to do so, I can’t say it looks good for the stock indices tomorrow.
The Russell rebalancing on Friday artificially propped up the markets on Friday.
EURUSD Triangle pattern: http://niftychartsandpatterns.blogspot.com/2011/06/eurusd-triangle-pattern.html
Well, it looks like they decided to rally first. I wonder how high they will take it?
What is the Reptilian Illuminati Gangster George Soro’s up in this post? Is he already short and wants to panic the public so the market will crash so he can steal more money from the sheep… or is something else in play here?
http://beforeitsnews.com/story/755/113/George_Soros:_we_are_on_the_edge_of_collapse.html
Always be weary of what the gangsters say as they are deceivers and mis-leaders.
Red,
Just like Lindsey Williams says, watch for their buzz words. They are telling us what is going to happen. It’s just a function of when. If there is anyone who knows what is going to happen, it’s Georgie Soros…
Well, Soro’s called the bottom (short term of course) when he said that “we are on the edge of collapse”. Just do the opposite, as Lindsey Williams did say… “listen to their buzz words”
ES near resistance line: http://niftychartsandpatterns.blogspot.com/2011/06/es-near-resistance-line.html
Up huge today on my longs.
Nice call on your longs Cletus. While I’m not in agreement with you on your long term outlook, the short term appears to be in the bulls hands right now. My upside target (assuming the bulls continue) is now coming in around the 1310-1315 area… what’s yours?
i have overnight signals, that slightly favor the bears on the qqq, if so, possible retest of 55.0, tuesday
hi red, XOM was 76.8— had a 78.4 AH friday high. guess what? it reached 78.4…i closed the position 78.2, no sense in trying to chase that last 20 cents…sometimes those after hour highs, are as good as a fake print.
Yes Z… I agree. Others caught a 128.30 spy print, but it matched the previous days’ open, so I didn’t think it was real. We hit it today of course. LOL.
It’s still a series of 1 and 2s until proven otherwise. Nasdaq finally tagged its 20 day average.
It looks like they POMO’d the bleep out of the euro at the open. It just skyrocketed from 8:30 central and on. Crude, silver and other commodities bottomed at that point but the raging stock market couldn’t prevent silver and gold from rolling over again and dropping to new lows during the day.
Tomorrow is 58 days from the 5-1 date or Wednesday if one wants to use the 5-2 high for the stock market. But the commodities got hammered starting on 5-1 and silver looks like its starting to freefall again. GLD finished beneath its lower BB today and $xeu (euro) starting to see its lower BB flare as the 20 day average begins to roll over.
Window dressing going well. Bullish bias next few days….
ES Resistance levels: http://niftychartsandpatterns.blogspot.com/2011/06/es-support-and-resistance-levels.html
It’s so boring when the bulls are back. I like bears much more… they always make it exciting! LOL
Rollover here to set up the right shoulder? The 15-30-60 min charts are in overbought territory. What say you, Red?
Yes, the 60, 30, and 15 are overbought, but not the daily. The daily is still in negative territory on the MACD’s around -10 to -15. The Full STO’s are around the 50 level and pointing up, and the Slow STO’s are around 20-25 and pointing up.
The weekly is oversold and looking like it wants to curl back up on the Full STO’s, but not oversold on the MACD’s… which supports the theory of a rally. I’m still looking for the market to hit the necktie of resistance around the 1310 area, but it doesn’t have too be straight up. We could sell off some before then, but with so many trapped bears on board, I’m not sure if they will allow it?
red, what is your read on Tomorrow’s Greek vote by looking at the chart?
I guess it will be more boring tomorrow?
It depends on how the market interprets the vote I guess? I’m not sure right now? If we close around the high of the day, with very little selling in the last half hour, that would tell me that the insiders know the outcome of the vote and are positioned long in front of more rallying. If we sell off a little, then no one knows… and if we sell of a lot, then they are expecting a negative outcome. That’s about the best guessing I can do.
Here’s a quickie video for you guys…
http://screencast.com/t/jrcNuOX3cOvS
Nice. I like quickies.
Selling Zone of SPY: http://stk.ly/j2b2Wr
They say that there are rarely triple tops where the next attempt wasn’t broken through… I wonder if this time will be one of those rare times (making a quadruple top)?
I am expecting a down move here as well Leo. The whole structure looks like a rounding bottom formation for me. So this might take some more time before it gives a breakout.
those $1/4 billion buy and (2) $100 mil buys in after hours on XOM at 76.8, controlled the bid for 2 days in a row. AH volume–looks to me, is another place to find fake prints or the elites publishing what they are about to do…hehe
—-
XOM today, dam near 80
Yes Z… keep your eye’s open for some FP’s as I expect some will show up soon.
i eye, will do!
spy has a possible white soldier pattern, inverse falling knife—-i’m not shorting nor buying today
No… now is not a good time to short! Wait for resistance to be hit, in my opinion.
my overnight charts are predicting a possible dow 12,300 within 48 hours, then short that. in spx, that’s around 1310 or so.
chart is saying 12,000 is now the key support next few days. if that’s broken…nothing but air, below
Not a white soldier…there was a gap between yesterday and today in both SPY and SPX.
i thought those extra-ordinary block trades, only controlled the bid for the next day. i know better now. it’s for more than one day.
there were probably other block trades on lots of other stocks, that day in after hours.. but i don’t have or know of the programming to search them out.
Window dressing working as advertised…..
So Robert, do you have an “upside” target in mind before this bull falls off the cliff?
YEAAAAHHHHHHHHHHHHH!!!!
New highs coming in August, baby! We’re topping out in the next few days, then maybe a pullback the week or two after that, but nothing too bad, then we’re off to the races for new highs.
It’s guaranteed by a couple metrics on sentiment.
The pullback should be around the 1310 area Cletus, but we could go up to the 1350 area later on. However, I’m not expecting a new high like you are, but neither of us know for sure what will happen. Either way, I’ll be shorting if we get to 1310 and worry about 1350 later…
Red, you’ve got to save Cletus from the Dark Side.
Madman Ben is not your father!!!
Someone sold 18 million spy after hours. at the end 15 min. 22 million was bought to push up and trap bulls.. any comments
Looks like both the buyer of the 18 million spy contracts and the seller of the 22 million were both wrong, as we seem to be going nowhere today. A pause day here would indicate more upside though… at least usually, as it would likely reset the short term overbought charts. Of course if the charts are still overbought by the end of the day, then the pause day could fail as an “continuation” day and we could sell off tomorrow.
Interesting read:
http://www.zerohedge.com/article/options-based-market-flash-crash-imminent
Here we go again……
SPY Chart: http://stk.ly/mK4MKv
The top of that cloud is about where my 1310 spx is, and a wall of resistance. I still think that will be our best shorting spot.
Here’s the chart showing the New Moon on July 3rd…

It’s been pretty accurate lately, so I wouldn’t be surprised if we open next Tuesday, July the 5th and start the sell off.
red, the last in this series of eclipses on July 1st – partial solar eclipse
So, a turning point should be either this Friday or next Tuesday… who’s brave enough to go short over the weekend (just in case they stage some false flag for Independence Day)?
Mr. TopStep is calling for a possible retest of the 1373 high… LOL! I don’t think we are going that high without a pullback first. The area of resistance looks to be around 1315 spx now, as the 2 ma lines flattened out and didn’t continue down as I previously said. They are almost crossing, which is a necktie of resistance. That, along with the downward sloping trendline, should stop the bulls advance and force a pullback before another attempt higher can occur. If so, the high I have is about the 1350 level, but not a higher high.
http://www.youtube.com/watch?v=YZweH7yWzrA
Dow Jones hits the trend line: http://stk.ly/kY4qDg
The eclipse will start on 30th June for some – Thursday morning’s trading session for US, the eclipse will actually affect the US on Friday morning. If the previous eclipses are anything to go by we might get another run down well before the weekend. This run up today might be it for a few days. Then again… lol
The necktie of resistance for the 2 moving averages on the daily chart is now around 1316 spx, which tells me that a possible “pop and drop” could happen tomorrow… especially with the eclipse on Thursday, followed by the July 3rd New Moon.
On my charts S&P has hit required 1310 so what do you think on balance, Red. Up or down from here?
Up a little more… to 1316 spx tomorrow on a quick pop. The 1310 target was a “moving target” and is now about 1316 spx.
seems like too many people thinking lower low
ES got swatted down from a Bernoulli channel line. Trying to sneak
back into it’s old up channel, but confirming the new downchannel for
now. Looking at July 1 to 5 as turn down, new moon, and other
important stuff, including a classic deception on the Fear Factor
http://oahutrading.blogspot.com/
now i know why this site loads so slow. i got an error message, shockwave flash crashed…that means there’s too many you tube videos in my tabs—-if i have another site opened with a youtube video, this site won’t load.
anyway, my overnight chart signals got reliable again. they go in and out of being reliable. here’s what they say.
—-
i have signals! even if the DIA can reach the 123-123.25 area. 121 should gets re-tested, soon. then go long 121-120.5
to stop this site from crashing on your PC zstock7 just go to google and get ccleaner know as crap cleaner are run it and clean out your temp files
Refresh page for new video update…
EURUSD Triangle pattern: http://niftychartsandpatterns.blogspot.com/2011/06/triangle-pattern-of-eurusd.html
Wedge of ES: http://niftychartsandpatterns.blogspot.com/2011/06/rising-wedge-of-es.html
Shorting here at 1316 S & P? End of QE2 push up has to retrace after that crappy initial claims number, Also hitting 50 SMA. I think a retrace to at least 1300 is in order.
I’m thinking the same thing Kevin… just one more push higher please.
Oink, Oink? LOL. You may be right though. Hey, I’m watching the Alex Jones “cremation of care” video circa 2000 regarding the illuminati rituals. Have you seen that one?
No… post the link to it, and I’ll watch it later.
http://reconearth.blogspot.com/2011/05/illuminati-alex-jones-dark-secrets.html
Inside Bohemian Grove. It’s pretty long…
Wow! The market is very overbought here, on all the short term charts. Looks like a big bear squeeze too me. They are pushing hard up against that resistance zone, and I’m not sure if it’s going to hold them back or not? We should know within the next hour or so I believe.
Yeah, defying gravity so far. Looks like the are cleaning out the end of QE2 shorts,…for now. The initial claims report had NO effect and it was crap… It is comical what matters and what doesn’t to the market.
DJIT broke out of the down trend line already while SPX is right at it right now
Does DJIT lead the general market?
I seen that too… and yeah, sometimes it does. But the NYST (symbol NYA) is a better representation and it usually leads the DOW. Since it also has broken out this tells me that the SPX will likely go higher to the 1350 area before rolling over into wave 3 down. But, that doesn’t mean we don’t get a pullback here today or tomorrow. Maybe a backtest to the 1300 level, and then back up?
Another link for ya, Red…
http://theilluminatiwatch.com/2011/05/19/nwo-bilderberg-controls-the-world-alex-jones/
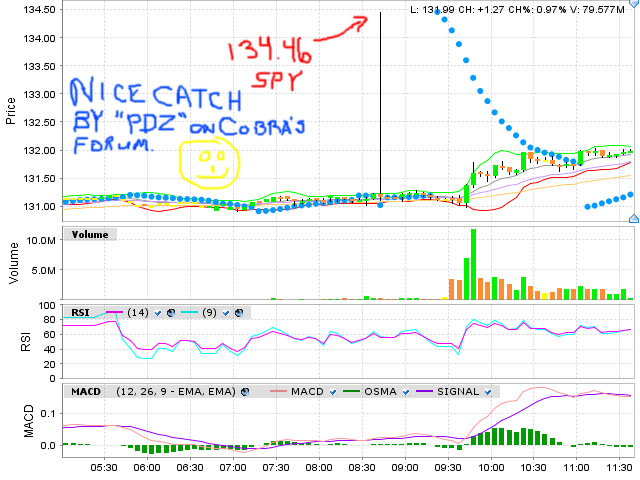
Nice FP catch by PDZ on Cobra’s Forum…
http://stockcharts.com/def/servlet/Favorites.CServlet?obj=ID3729231
Looks like we know our upside target now. It’s not quite the 1350 spx level I was expecting, but close enough. Notice that it came in the morning around 8:40 am, and the market hasn’t been to that level in quite awhile. This tells me it’s real.
Opps… wrong link. Sorry. Here it is…
It’s possible, but the last time I saw a big print that close to the top, it dropped and never looked back. Check out some of the SPY prints when the market has reversed downwards before. They might be for after QE3 is announced?
LOL… I was just asking you if you seen this print I posted while you were typing this response.
SPY Chart: http://niftychartsandpatterns.blogspot.com/2011/06/spy-hits-100-day-moving-average.html
All this sideways trading is bad news for the bears. It’s forming a bull flag now and you know how the like to fulfill them overnight with gap up opens. I’m glad I didn’t go short yet, as I think they are going to break this resistance tomorrow on a gap open. I don’t know if it will hold or not, but they appear to be basing for gap over it. Of course they could just push on through it the last half hour, but I really expect it after the close.
I’m out of longs and shorting big. A close beneath 1296 in the next two weeks is guaranteed by the theory of end of month trading, therefore, great value to short here regardless of how high it goes.
Just remember the money has now slowed to a trickle. The next 2 weeks there are only 2 small POMOs, which the banks will be stumbling over each other to use. With all the massive leverage, and the sad, sad volume that has been sapped to almost nothing, there will be redemptions.
Did you see that FP I posted earlier that someone one Cobra’s forum caught? It shows the spy at 134.46, which is close to my 1350 spx target area. While I think we will sell off some early next week, I think that’s the final upside target before wave 3 down starts.
Yeah, it’s still on thinkorswim, if you still use that platform. 134.46@8:44 am EST.
See how good these criminals are at psychological warfare? Just last week who thought we would be right back up at 1320? Who wasn’t expecting a small rally and another big leg down? Now, we’re waiting for a small pullback before another huge rally! WOW!
POMO is done (except for dividend reinvestment of MBS garbage) and for the first time in 6 months, there will actually be a net outflow from the market.
I don’t know exactly when this market will be taken down, but it will need to be taken down farther for the criminal scum to get QE3, whatever form it takes.
Window dressing is done and very profitable I might add. Pomo is over. Pigs get slaughtered, pullback would be healthy…:)
SPX Analysis after closing bell: http://niftychartsandpatterns.blogspot.com/2011/07/s-500-analysis-after-closing-bell.html
New false print on DIA indicates that they are going to either sell it off or pull it back, but we are going lower here soon.
http://marketmanipulationfun.blogspot.com/
This market is too resilient. It continues to advance higher and the bears continue to run with their money.
http://stockoneradar.blogspot.com
ES Chart: http://stk.ly/ihHSUr
Now we know that the Fed is continuing to funnel money to the criminals unofficially. I was wondering what that “Other Assets” category was…it started to increase dramatically the last couple months.
Isn’t it just amazing how obviously manipulated this is? WTF? No real market would have blasted through that resistance zone yesterday without any pullback at all! I’m just glad I didn’t go short, as it just looked too strong to risk it.
When even
Goldman is downplaying the end all report which is certainly not all it
is being touted to be, there is little that can be added:
BOTTOM LINE:
The ISM beats expectations and rises in June. The details of the
report, however, were weaker than the headline as more than half of the
headline increase was due to an increase in inventoriesThe
Institute for Supply Management (ISM) rises unexpectedly in June, up 1.8
points to 55.3. As the median forecast and ourselves had looked for a
decline, this is clearly an encouraging upside surprise. The composition of the report, however, was on the weaker side.
Specifically, a sharp increase in the inventories index (from 48.7 to
54.1) explained 1.1 points of the 1.8 increase in the headline index. If anything, an increase in inventories is a negative for future activity. The
remaining 0.7 point of the headline increase was due to small increases
in new orders (by 0.6 point to 51.6), production (by 0.5 point to
54.5), supplier deliveries (0.6 point to 56.3) as well as a more sizable
increase in employment (1.7 points to 59.9).
Reading what you stated I almost thought the numbers were important, as you did a nice explanation of it… but then I took another Red Pill and realized that the numbers are all made up and don’t mean anything, as they simple spin it to move the market in whatever direction they want it to go.
It’s sad really, as us sheep could actually make some money in the market with technical analysis and news data reports… if they were accurate. All the studying of both TA and how certain news effects the market seems pointless when it all just a staged game of cards, and they are the house!
But, nice post anyway… thanks
Red, in the 90’s the retail investor (with the use of the internet) changed the game. The institutions had retail in the dark with no way of making money in the market on a short term basis. They were caught off guard and now the big banks have changed the game by working with the government and media to use diversional tactics which includes outright lies to make the market a casino for the retail traders. These reports that are sooo important are fibbed when they want them to be. A nice tactic I like is how they “revise” the numbers of the previous report that was already traded on. A nice way of softening a poor report. It’s a joke and eventually this house of cards will collapse, probably when enough retail 401k mutual fund money is back into stocks. One thing is for sure, when D-day comes, this market will fall violently before the sheep can get on the phone. Until then,…either go long or wait.
Yelp… you are absolutely correct, the internet evened the playing field as the retail trader got the same data as the big institutions… and they couldn’t make money that way. So, they have to lie about the data, and have fore knowledge of it, so they front run it. Gangsters! Hang’em All…
Just went short. Going to slap this market silly as of tuesday morning!
The
Institute for Supply Management’s factory index unexpectedly rose to
55.3 in June from 53.5 the prior month, the Tempe, Arizona-based group
said today. Economists projected the gauge would drop to 52,
according to the median forecast in a Bloomberg News survey. Estimates
of the 77 economists ranged from 49 to 55.Other figures today
showed manufacturing growth is slowing from China to Europe. China’s
factory index fell in June to the weakest level since February 2009,
while in the 17-nation euro area, a gauge slipped to an 18-month low.
German manufacturing expanded at the slowest pace in 17 months, while
Italy, Ireland, Spain and Greece contracted.
If XLF breaks $15.80,..essentially busting through the 200 DSMA abd the upper downtrendline, you better strap yourselves in. The markets have been led down by the financials and Nasdaq and the Nas has already reaquired the 200 DSMA.
Print Watch is issuing a print hit signal which means a trend change of some scale is imminent.
An IYR print hit that was posted a month ago.
Woo, I bet they’re scared on Wall St. now…
What about the 134.46 spy print? It hasn’t been hit yet…
I’m selling my longs into this today. The market will have to breakout to new highs for me to go long again. Prove it, market! Long weekend and that Greece stuff isn’t over yet. This could be a huge headfake to suck us all in and it looks like it’s working, OR,…I am dead wrong. I have been before. LOL!
I didn’t see it on the charts therefore it doesn’t count. I only consider ones on the charts valid. Ones issued on other systems may or may not work. Either way, many signals are coming together for a turn.
I’d say we have a “pop and drop” Monday (assuming they don’t pull a surprise weekend false flag event)
This is nuts! Almost to the 134.46 spy FP!