
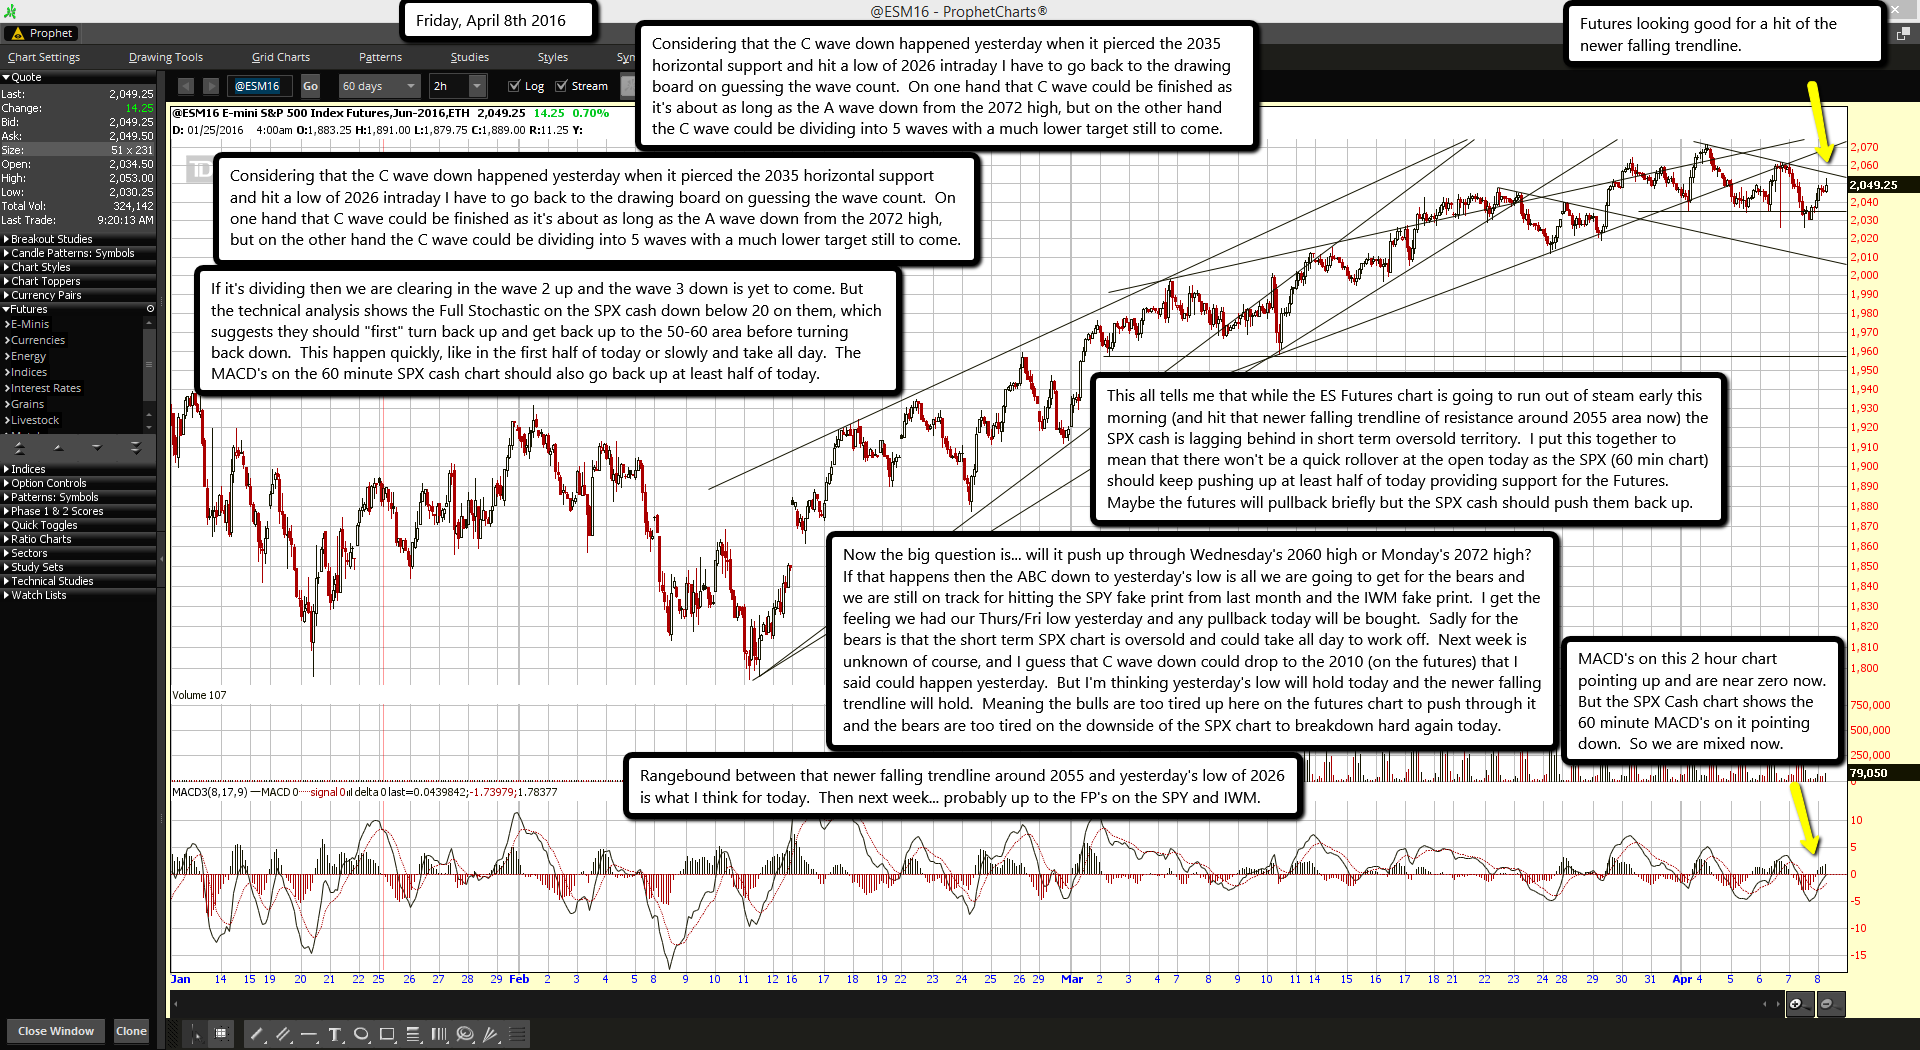
Futures looking good for a hit of the newer falling trendline.
MACD's on this 2 hour chart pointing up and are near zero now. But the SPX Cash chart shows the 60 minute MACD's on it pointing down. So we are mixed now.
Considering that the C wave down happened yesterday when it pierced the 2035 horizontal support and hit a low of 2026 intraday I have to go back to the drawing board on guessing the wave count. On one hand that C wave could be finished as it's about as long as the A wave down from the 2072 high, but on the other hand the C wave could be dividing into 5 waves with a much lower target still to come.
If it's dividing then we are clearing in the wave 2 up and the wave 3 down is yet to come. But the technical analysis shows the Full Stochastic on the SPX cash down below 20 on them, which suggests they should "first" turn back up and get back up to the 50-60 area before turning back down. This happen quickly, like in the first half of today or slowly and take all day. The MACD's on the 60 minute SPX cash chart should also go back up at least half of today.
This all tells me that while the ES Futures chart is going to run out of steam early this morning (and hit that newer falling trendline of resistance around 2055 area now) the SPX cash is lagging behind in short term oversold territory. I put this together to mean that there won't be a quick rollover at the open today as the SPX (60 min chart) should keep pushing up at least half of today providing support for the Futures. Maybe the futures will pullback briefly but the SPX cash should push them back up.
Now the big question is... will it push up through Wednesday's 2060 high or Monday's 2072 high? If that happens then the ABC down to yesterday's low is all we are going to get for the bears and we are still on track for hitting the SPY fake print from last month and the IWM fake print. I get the feeling we had our Thurs/Fri low yesterday and any pullback today will be bought. Sadly for the bears is that the short term SPX chart is oversold and could take all day to work off. Next week is unknown of course, and I guess that C wave down could drop to the 2010 (on the futures) that I said could happen yesterday. But I'm thinking yesterday's low will hold today and the newer falling trendline will hold. Meaning the bulls are too tired up here on the futures chart to push through it and the bears are too tired on the downside of the SPX chart to breakdown hard again today.
Rangebound between that newer falling trendline around 2055 and yesterday's low of 2026 is what I think for today. Then next week... probably up to the FP's on the SPY and IWM.

