
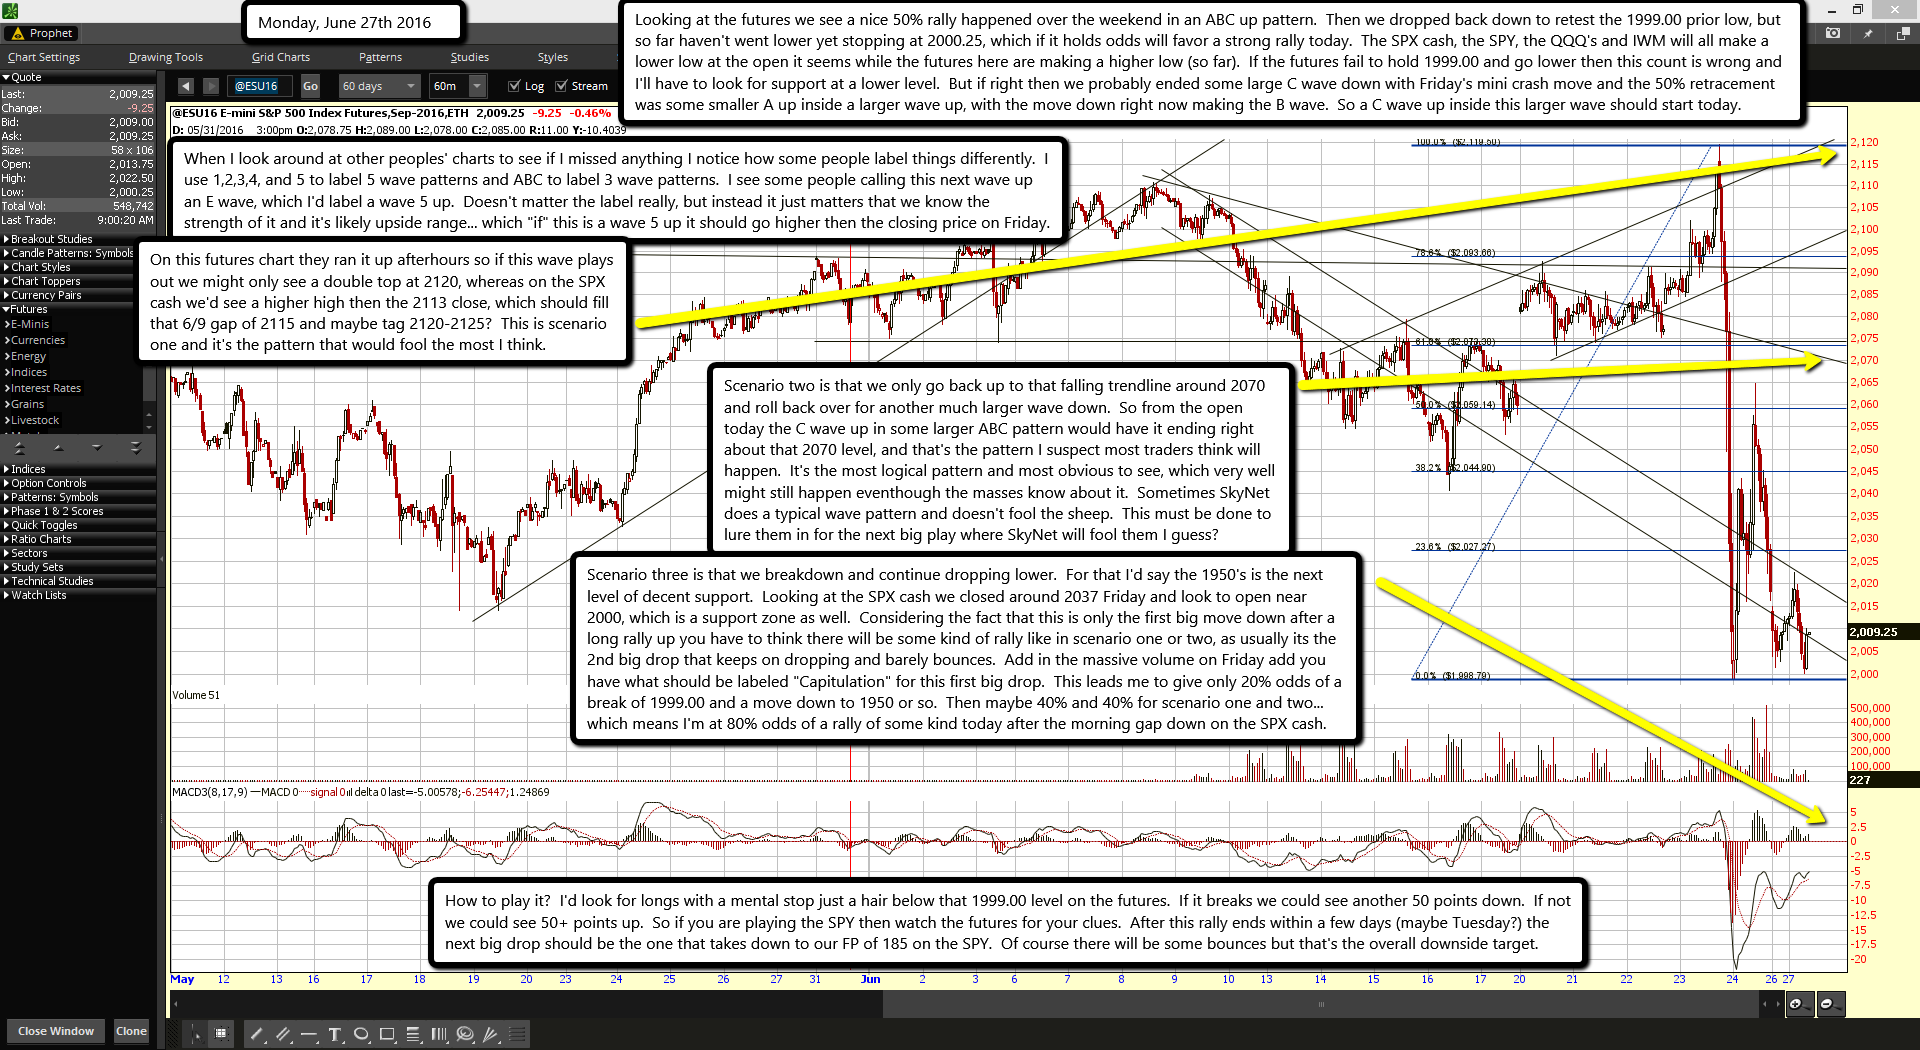
Looking at the futures we see a nice 50% rally happened over the weekend in an ABC up pattern. Then we dropped back down to retest the 1999.00 prior low, but so far haven't went lower yet stopping at 2000.25, which if it holds odds will favor a strong rally today. The SPX cash, the SPY, the QQQ's and IWM will all make a lower low at the open it seems while the futures here are making a higher low (so far). If the futures fail to hold 1999.00 and go lower then this count is wrong and I'll have to look for support at a lower level. But if right then we probably ended some large C wave down with Friday's mini crash move and the 50% retracement was some smaller A up inside a larger wave up, with the move down right now making the B wave. So a C wave up inside this larger wave should start today.
When I look around at other peoples' charts to see if I missed anything I notice how some people label things differently. I use 1,2,3,4, and 5 to label 5 wave patterns and ABC to label 3 wave patterns. I see some people calling this next wave up an E wave, which I'd label a wave 5 up. Doesn't matter the label really, but instead it just matters that we know the strength of it and it's likely upside range... which "if" this is a wave 5 up it should go higher then the closing price on Friday.
On this futures chart they ran it up after-hours so if this wave plays out we might only see a double top at 2120, whereas on the SPX cash we'd see a higher high then the 2113 close, which should fill that 6/9 gap of 2115 and maybe tag 2120-2125? This is scenario one and it's the pattern that would fool the most I think.
Scenario two is that we only go back up to that falling trendline around 2070 and roll back over for another much larger wave down. So from the open today the C wave up in some larger ABC pattern would have it ending right about that 2070 level, and that's the pattern I suspect most traders think will happen. It's the most logical pattern and most obvious to see, which very well might still happen even-though the masses know about it. Sometimes SkyNet does a typical wave pattern and doesn't fool the sheep. This must be done to lure them in for the next big play where SkyNet will fool them I guess?
Scenario three is that we breakdown and continue dropping lower. For that I'd say the 1950's is the next level of decent support. Looking at the SPX cash we closed around 2037 Friday and look to open near 2000, which is a support zone as well. Considering the fact that this is only the first big move down after a long rally up you have to think there will be some kind of rally like in scenario one or two, as usually its the 2nd big drop that keeps on dropping and barely bounces. Add in the massive volume on Friday add you have what should be labeled "Capitulation" for this first big drop. This leads me to give only 20% odds of a break of 1999.00 and a move down to 1950 or so. Then maybe 40% and 40% for scenario one and two... which means I'm at 80% odds of a rally of some kind today after the morning gap down on the SPX cash.
How to play it? I'd look for longs with a mental stop just a hair below that 1999.00 level on the futures. If it breaks we could see another 50 points down. If not we could see 50+ points up. So if you are playing the SPY then watch the futures for your clues. After this rally ends within a few days (maybe Tuesday?) the next big drop should be the one that takes down to our FP of 185 on the SPY. Of course there will be some bounces but that's the overall downside target.

