
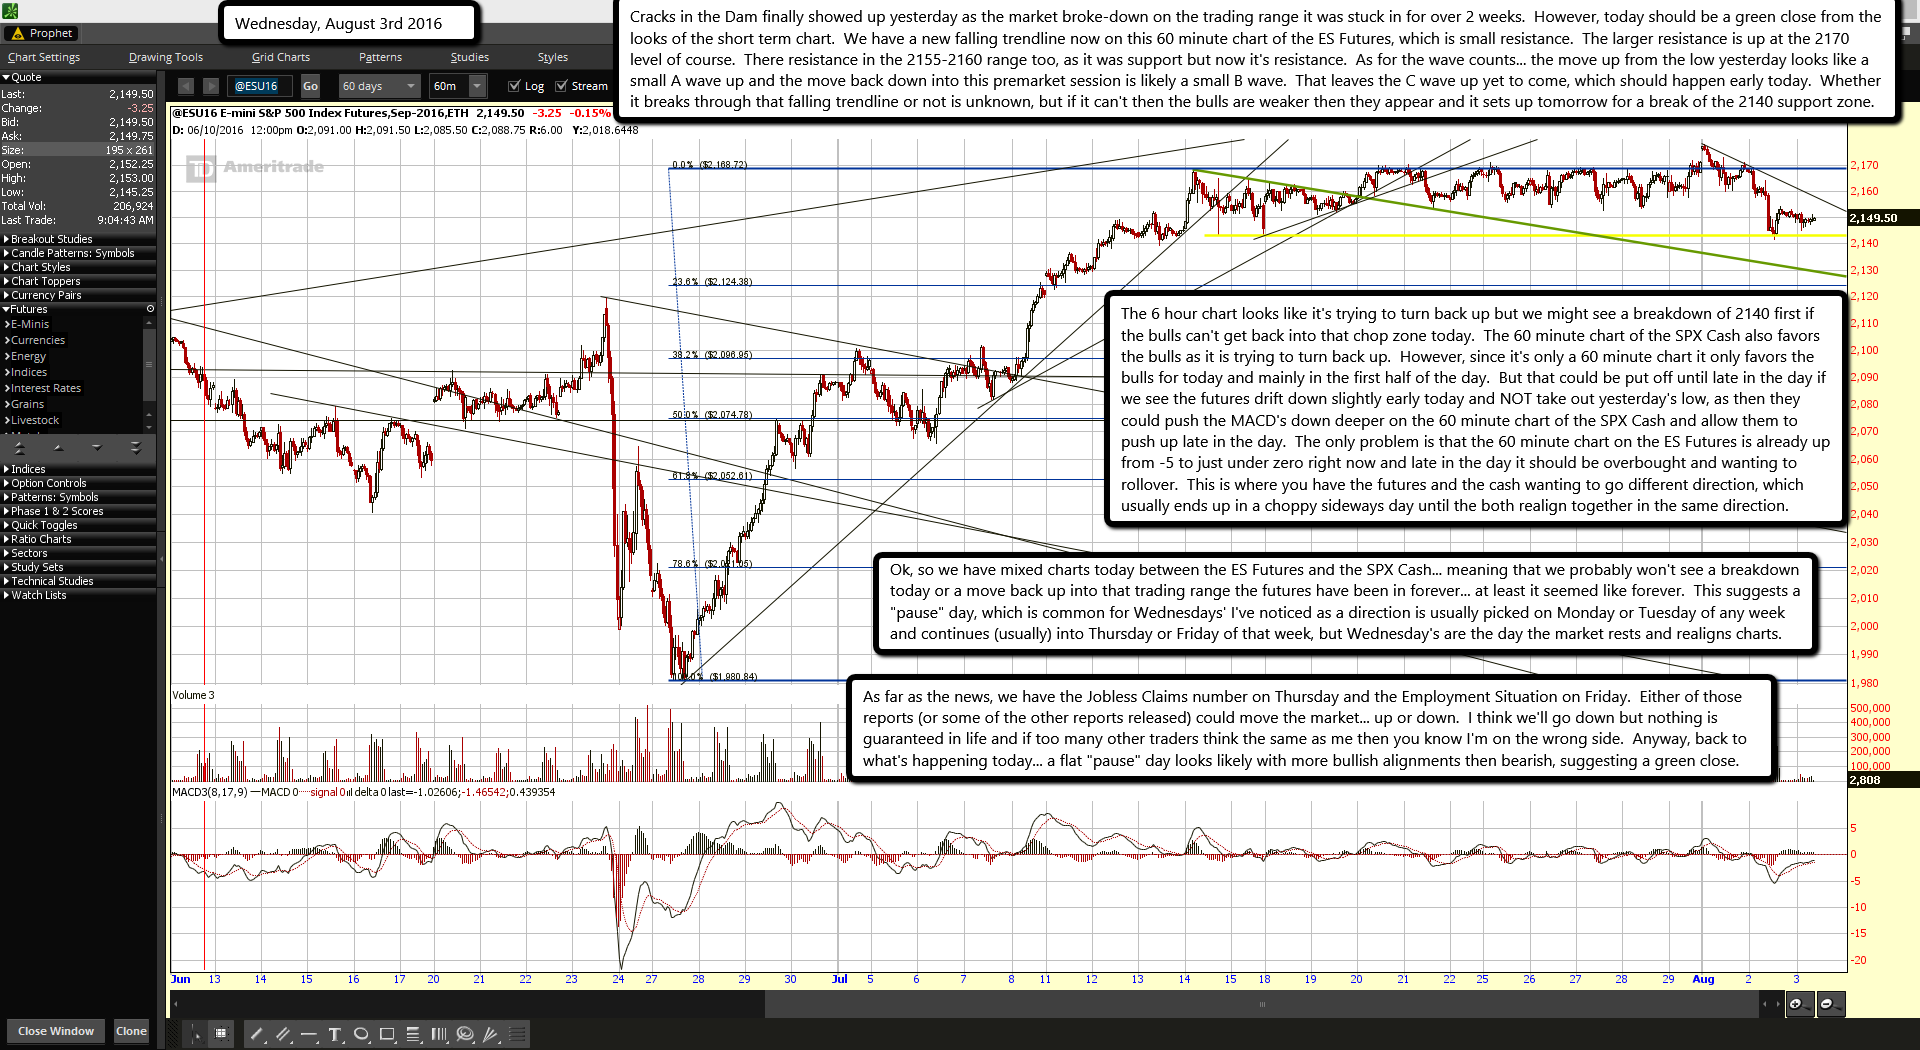
Cracks in the Dam finally showed up yesterday as the market broke-down on the trading range it was stuck in for over 2 weeks. However, today should be a green close from the looks of the short term chart. We have a new falling trendline now on this 60 minute chart of the ES Futures, which is small resistance. The larger resistance is up at the 2170 level of course. There resistance in the 2155-2160 range too, as it was support but now it's resistance. As for the wave counts... the move up from the low yesterday looks like a small A wave up and the move back down into this premarket session is likely a small B wave. That leaves the C wave up yet to come, which should happen early today. Whether it breaks through that falling trendline or not is unknown, but if it can't then the bulls are weaker then they appear and it sets up tomorrow for a break of the 2140 support zone.
The 6 hour chart looks like it's trying to turn back up but we might see a breakdown of 2140 first if the bulls can't get back into that chop zone today. The 60 minute chart of the SPX Cash also favors the bulls as it is trying to turn back up. However, since it's only a 60 minute chart it only favors the bulls for today and mainly in the first half of the day. But that could be put off until late in the day if we see the futures drift down slightly early today and NOT take out yesterday's low, as then they could push the MACD's down deeper on the 60 minute chart of the SPX Cash and allow them to push up late in the day. The only problem is that the 60 minute chart on the ES Futures is already up from -5 to just under zero right now and late in the day it should be overbought and wanting to rollover. This is where you have the futures and the cash wanting to go different direction, which usually ends up in a choppy sideways day until the both realign together in the same direction.
Ok, so we have mixed charts today between the ES Futures and the SPX Cash... meaning that we probably won't see a breakdown today or a move back up into that trading range the futures have been in forever... at least it seemed like forever. This suggests a "pause" day, which is common for Wednesdays' I've noticed as a direction is usually picked on Monday or Tuesday of any week and continues (usually) into Thursday or Friday of that week, but Wednesday's are the day the market rests and realigns charts.
As far as the news, we have the Jobless Claims number on Thursday and the Employment Situation on Friday. Either of those reports (or some of the other reports released) could move the market... up or down. I think we'll go down but nothing is guaranteed in life and if too many other traders think the same as me then you know I'm on the wrong side. Anyway, back to what's happening today... a flat "pause" day looks likely with more bullish alignments then bearish, suggesting a green close.

