
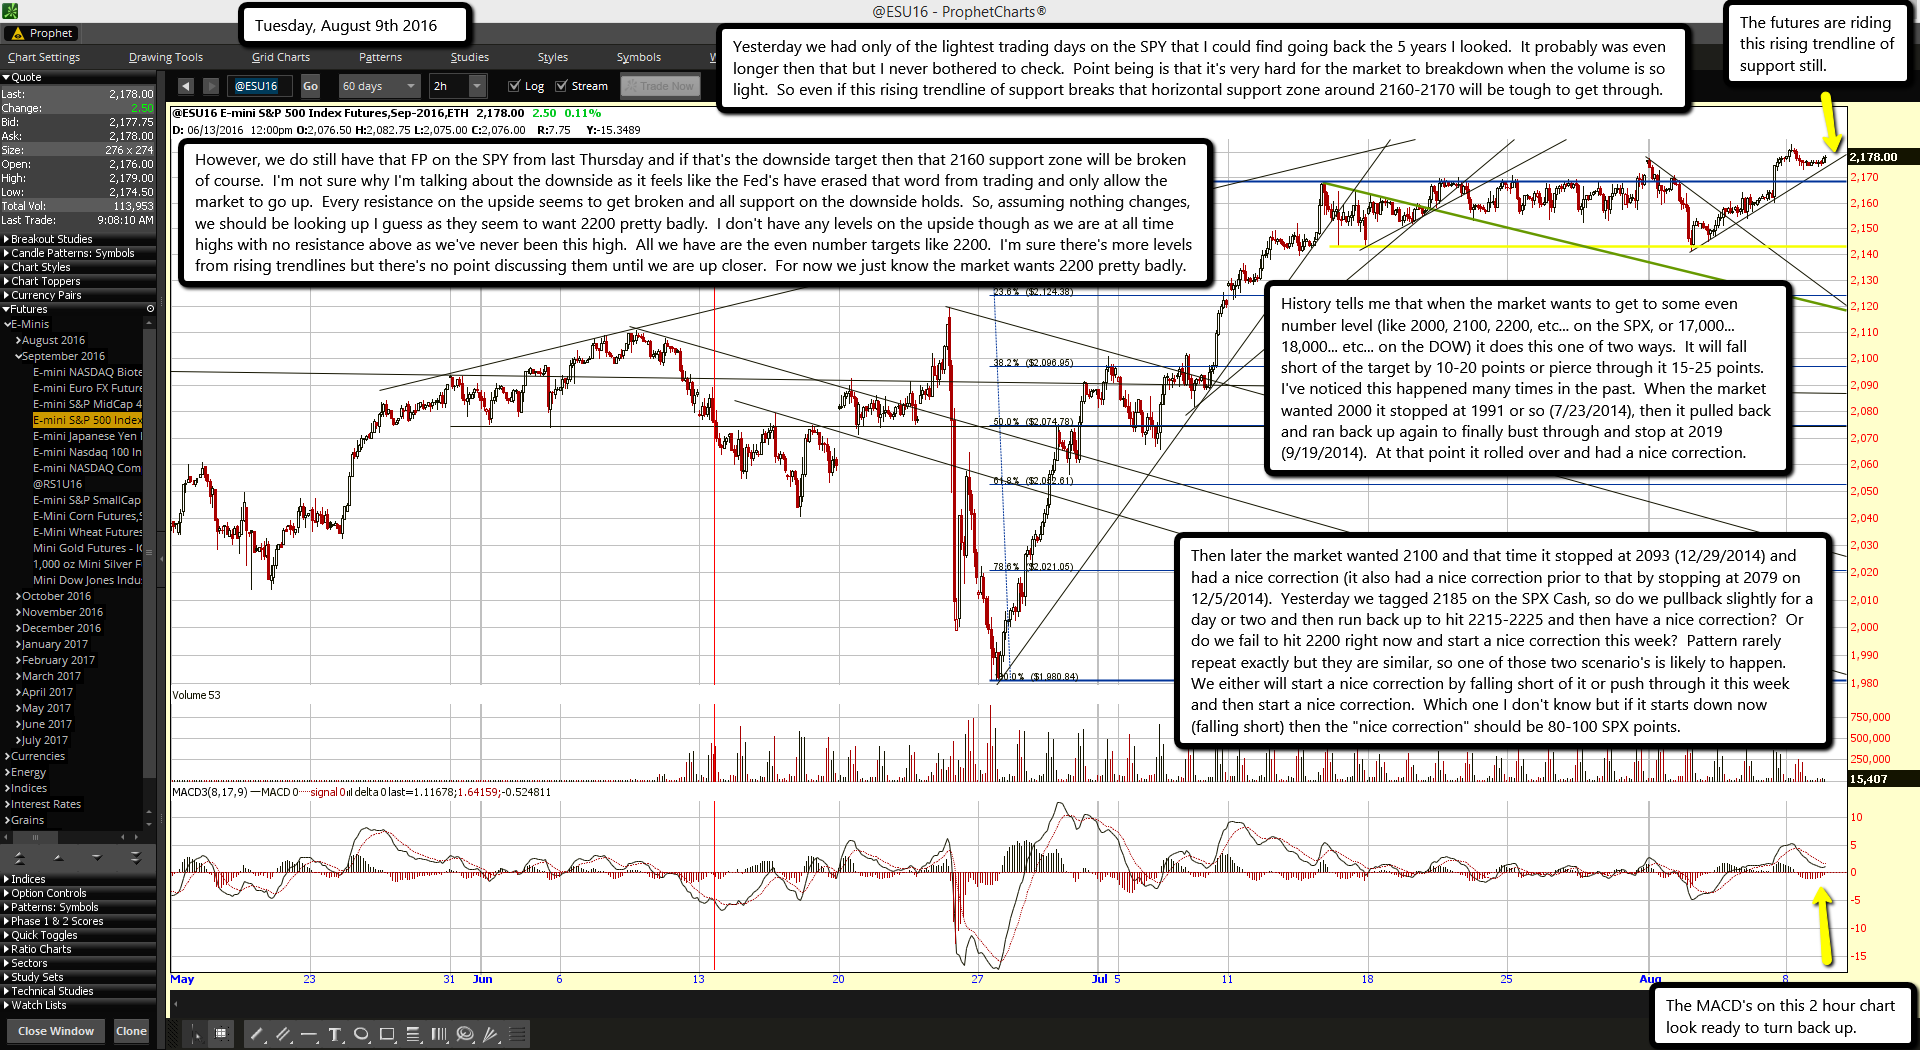
The futures are riding this rising trendline of support still.
The MACD's on this 2 hour chart look ready to turn back up.
Yesterday we had only of the lightest trading days on the SPY that I could find going back the 5 years I looked. It probably was even longer then that but I never bothered to check. Point being is that it's very hard for the market to breakdown when the volume is so light. So even if this rising trendline of support breaks that horizontal support zone around 2160-2170 will be tough to get through.
However, we do still have that FP on the SPY from last Thursday and if that's the downside target then that 2160 support zone will be broken of course. I'm not sure why I'm talking about the downside as it feels like the Fed's have erased that word from trading and only allow the market to go up. Every resistance on the upside seems to get broken and all support on the downside holds. So, assuming nothing changes, we should be looking up I guess as they seem to want 2200 pretty badly. I don't have any levels on the upside though as we are at all time highs with no resistance above as we've never been this high. All we have are the even number targets like 2200. I'm sure there's more levels from rising trendlines but there's no point discussing them until we are up closer. For now we just know the market wants 2200 pretty badly.
History tells me that when the market wants to get to some even number level (like 2000, 2100, 2200, etc... on the SPX, or 17,000... 18,000... etc... on the DOW) it does this one of two ways. It will fall short of the target by 10-20 points or pierce through it 15-25 points. I've noticed this happened many times in the past. When the market wanted 2000 it stopped at 1991 or so (7/23/2014), then it pulled back and ran back up again to finally bust through and stop at 2019 (9/19/2014). At that point it rolled over and had a nice correction.
Then later the market wanted 2100 and that time it stopped at 2093 (12/29/2014) and had a nice correction (it also had a nice correction prior to that by stopping at 2079 on 12/5/2014). Yesterday we tagged 2185 on the SPX Cash, so do we pullback slightly for a day or two and then run back up to hit 2215-2225 and then have a nice correction? Or do we fail to hit 2200 right now and start a nice correction this week? Pattern rarely repeat exactly but they are similar, so one of those two scenario's is likely to happen. We either will start a nice correction by falling short of it or push through it this week and then start a nice correction. Which one I don't know but if it starts down now (falling short) then the "nice correction" should be 80-100 SPX points.

