
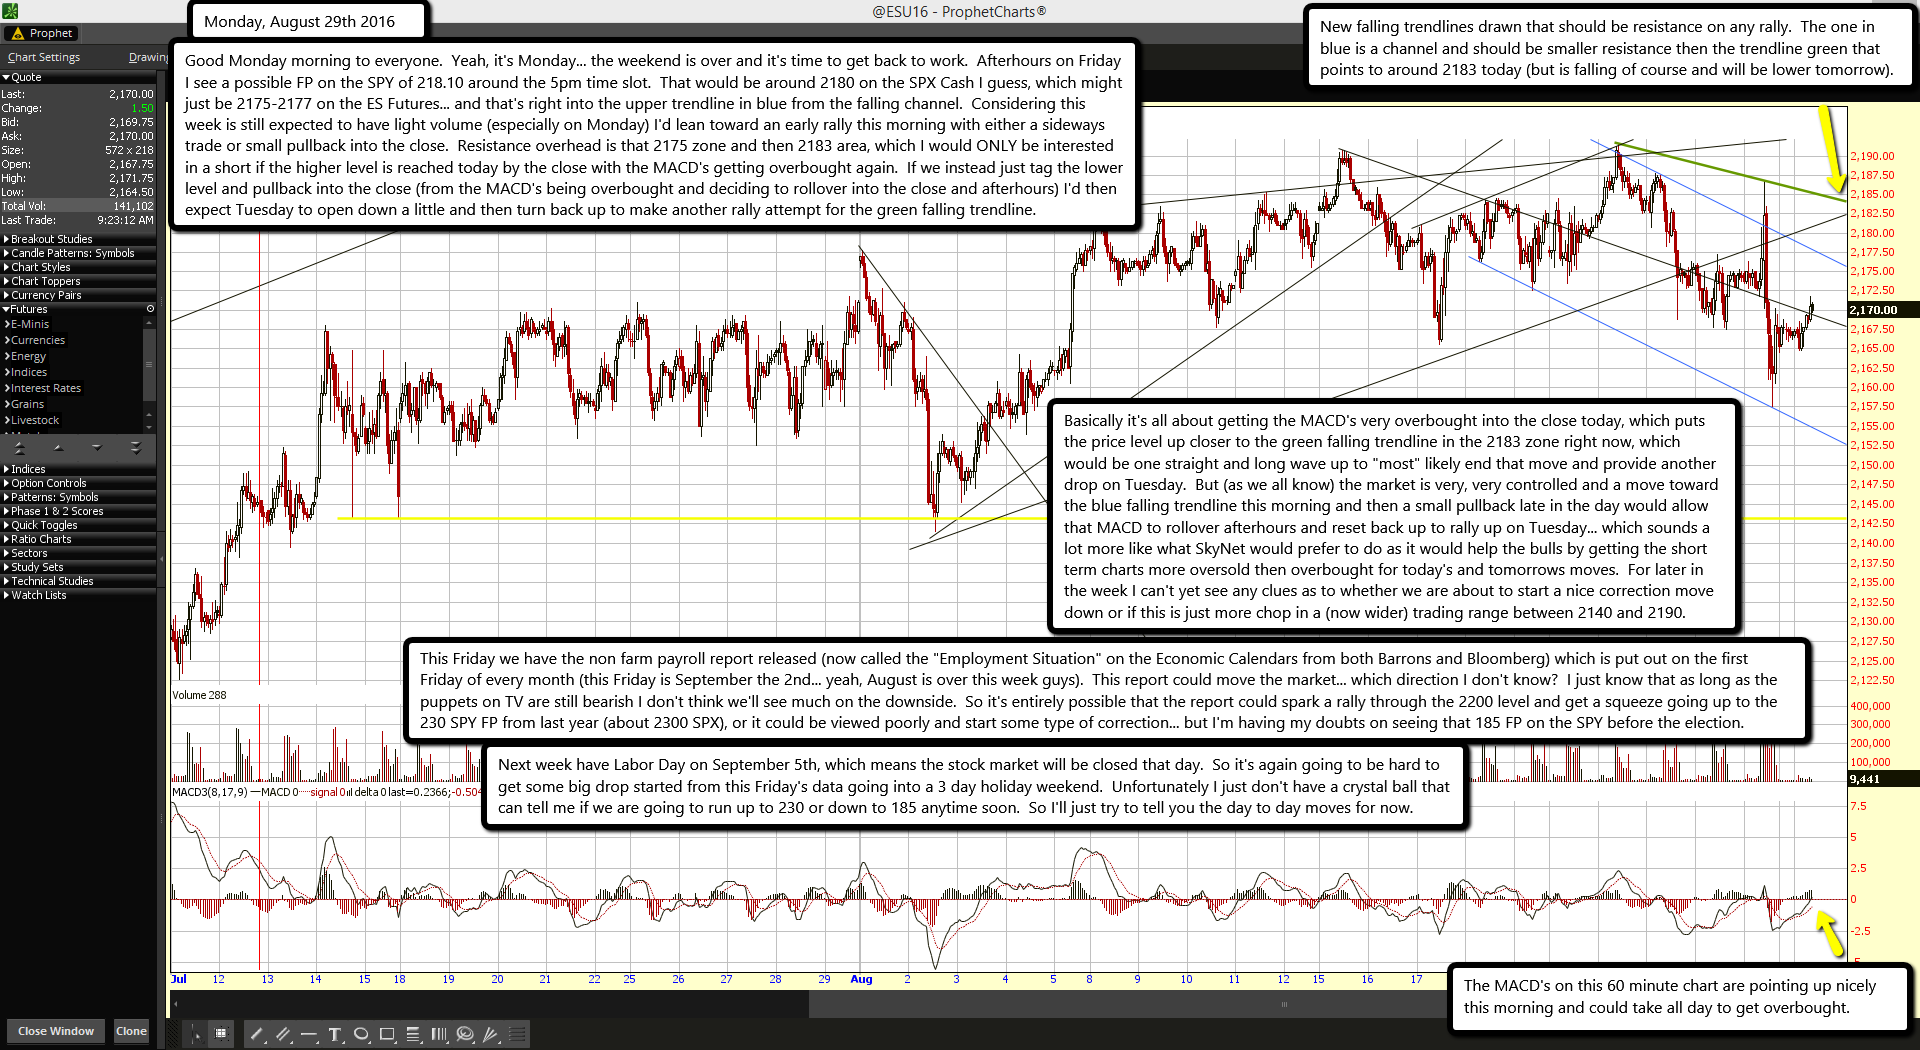
New falling trendlines drawn that should be resistance on any rally. The one in blue is a channel and should be smaller resistance then the trendline green that points to around 2183 today (but is falling of course and will be lower tomorrow).
The MACD's on this 60 minute chart are pointing up nicely this morning and could take all day to get overbought.
Good Monday morning to everyone. Yeah, it's Monday... the weekend is over and it's time to get back to work. Afterhours on Friday I see a possible FP on the SPY of 218.10 around the 5pm time slot. That would be around 2180 on the SPX Cash I guess, which might just be 2175-2177 on the ES Futures... and that's right into the upper trendline in blue from the falling channel. Considering this week is still expected to have light volume (especially on Monday) I'd lean toward an early rally this morning with either a sideways trade or small pullback into the close. Resistance overhead is that 2175 zone and then 2183 area, which I would ONLY be interested in a short if the higher level is reached today by the close with the MACD's getting overbought again. If we instead just tag the lower level and pullback into the close (from the MACD's being overbought and deciding to rollover into the close and afterhours) I'd then expect Tuesday to open down a little and then turn back up to make another rally attempt for the green falling trendline.
Basically it's all about getting the MACD's very overbought into the close today, which puts the price level up closer to the green falling trendline in the 2183 zone right now, which would be one straight and long wave up to "most" likely end that move and provide another drop on Tuesday. But (as we all know) the market is very, very controlled and a move toward the blue falling trendline this morning and then a small pullback late in the day would allow that MACD to rollover afterhours and reset back up to rally up on Tuesday... which sounds a lot more like what SkyNet would prefer to do as it would help the bulls by getting the short term charts more oversold then overbought for todays and tomorrows moves. For later in the week I can't yet see any clues as to whether we are about to start a nice correction move down or if this is just more chop in a (now wider) trading range between 2140 and 2190.
This Friday we have the non farm payroll report released (now called the "Employment Situtaion" on the Economic Calendars from both Barrons and Bloomberg) which is put out on the first Friday of every month (this Friday is September the 2nd... yeah, August is over this week guys). This report could move the market... which direction I don't know? I just know that as long as the puppets on TV are still bearish I don't think we'll see much on the downside. So it's entirely possible that the report could spark a rally through the 2200 level and get a squeeze going up to the 230 SPY FP from last year (about 2300 SPX), or it could be viewed poorly and start some type of correction... but I'm having my doubts on seeing that 185 FP on the SPY before the election.
Next week have Labor Day on September 5th, which means the stock market will be closed that day. So it's again going to be hard to get some big drop started from this Friday's data going into a 3 day holiday weekend. Unfortunately I just don't have a crystal ball that can tell me if we are going to run up to 230 or down to 185 anytime soon. So I'll just try to tell you the day to day moves for now.

