
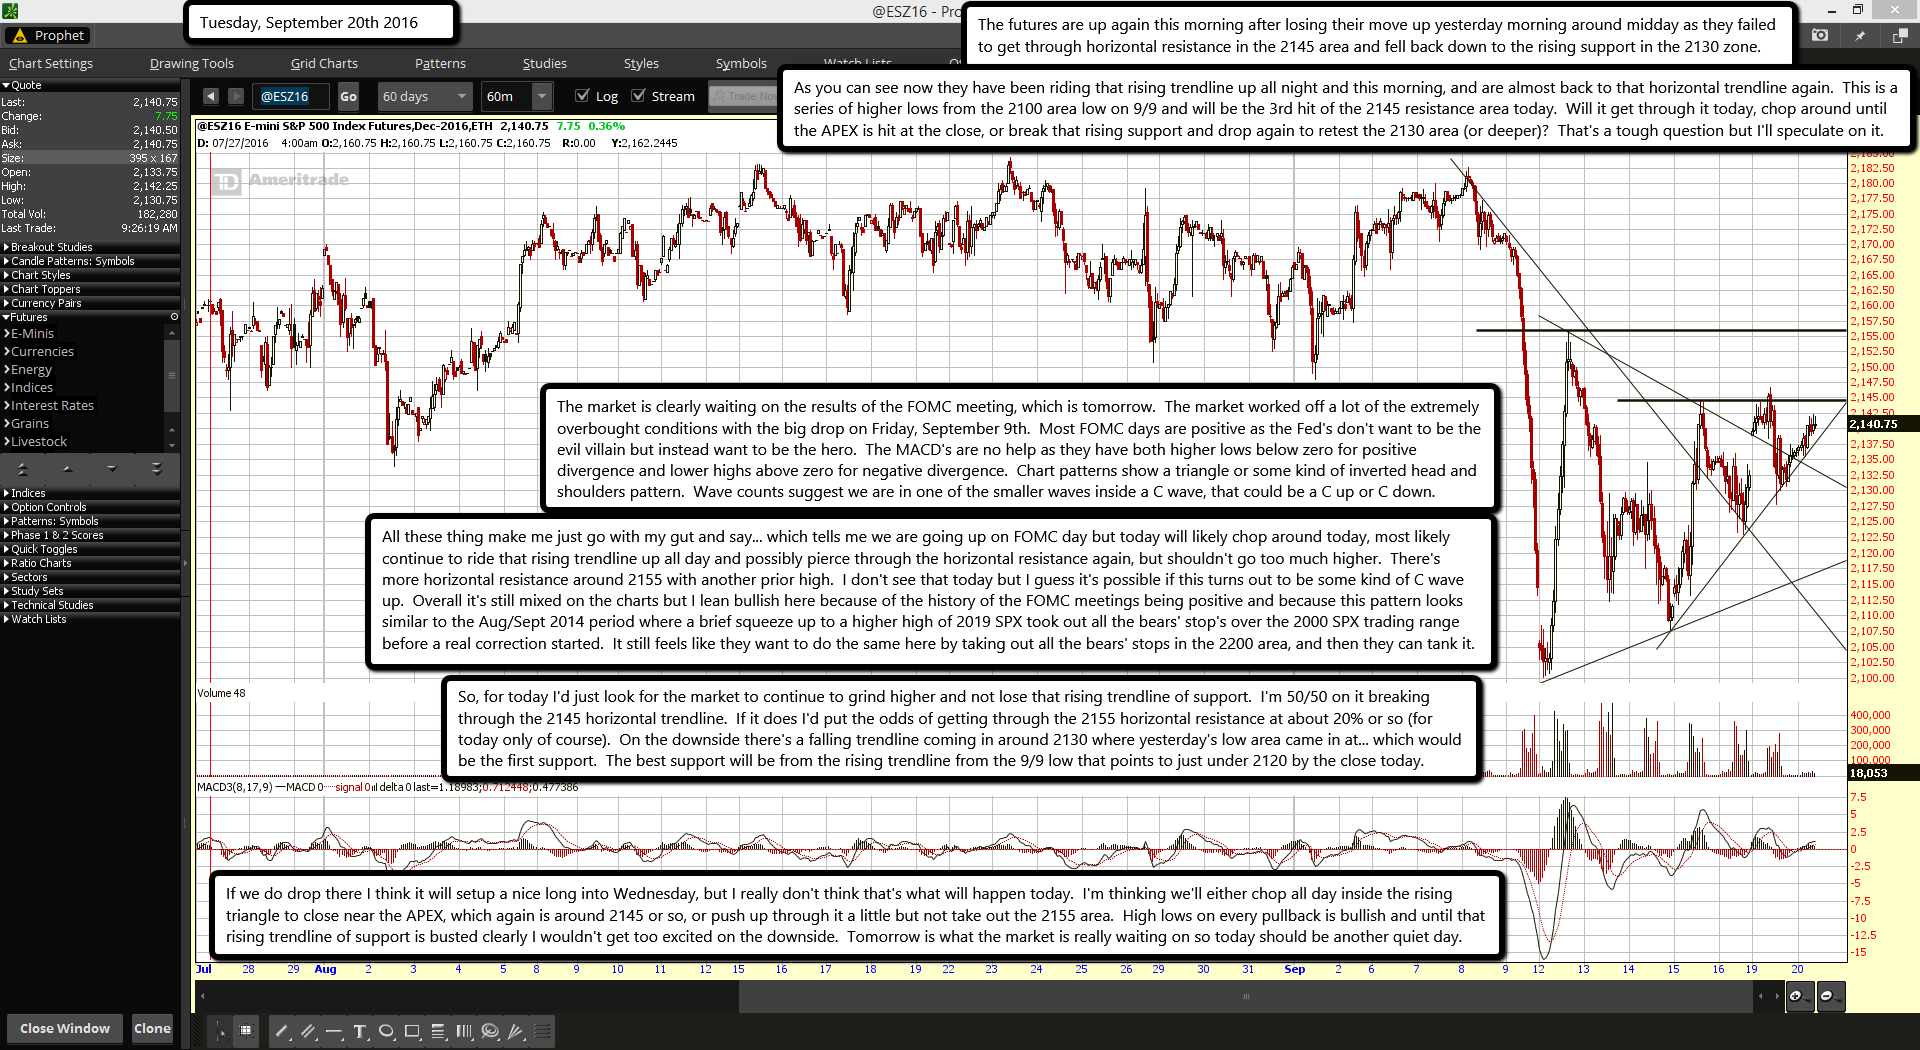
The futures are up again this morning after losing their move up yesterday morning around midday as they failed to get through horizontal resistance in the 2145 area and fell back down to the rising support in the 2130 zone.
As you can see now they have been riding that rising trendline up all night and this morning, and are almost back to that horizontal trendline again. This is a series of higher lows from the 2100 area low on 9/9 and will be the 3rd hit of the 2145 resistance area today. Will it get through it today, chop around until the APEX is hit at the close, or break that rising support and drop again to retest the 2130 area (or deeper)? That's a tough question but I'll speculate on it.
The market is clearly waiting on the results of the FOMC meeting, which is tomorrow. The market worked off a lot of the extremely overbought conditions with the big drop on Friday, September 9th. Most FOMC days are positive as the Fed's don't want to be the evil villain but instead want to be the hero. The MACD's are no help as they have both higher lows below zero for positive divergence and lower highs above zero for negative divergence. Chart patterns show a triangle or some kind of inverted head and shoulders pattern. Wave counts suggest we are in one of the smaller waves inside a C wave, that could be a C up or C down.
All these thing make me just go with my gut and say... which tells me we are going up on FOMC day but today will likely chop around today, most likely continue to ride that rising trendline up all day and possibly pierce through the horizontal resistance again, but shouldn't go too much higher. There's more horizontal resistance around 2155 with another prior high. I don't see that today but I guess it's possible if this turns out to be some kind of C wave up. Overall it's still mixed on the charts but I lean bullish here because of the history of the FOMC meetings being positive and because this pattern looks similar to the Aug/Sept 2014 period where a brief squeeze up to a higher high of 2019 SPX took out all the bears' stop's over the 2000 SPX trading range before a real correction started. It still feels like they want to do the same here by taking out all the bears' stops in the 2200 area, and then they can tank it.
So, for today I'd just look for the market to continue to grind higher and not lose that rising trendline of support. I'm 50/50 on it breaking through the 2145 horizontal trendline. If it does I'd put the odds of getting through the 2155 horizontal resistance at about 20% or so (for today only of course). On the downside there's a falling trendline coming in around 2130 where yesterday's low area came in at... which would be the first support. The best support will be from the rising trendline from the 9/9 low that points to just under 2120 by the close today.
If we do drop there I think it will setup a nice long into Wednesday, but I really don't think that's what will happen today. I'm thinking we'll either chop all day inside the rising triangle to close near the APEX, which again is around 2145 or so, or push up through it a little but not take out the 2155 area. High lows on every pullback is bullish and until that rising trendline of support is busted clearly I wouldn't get too excited on the downside. Tomorrow is what the market is really waiting on so today should be another quiet day.

