
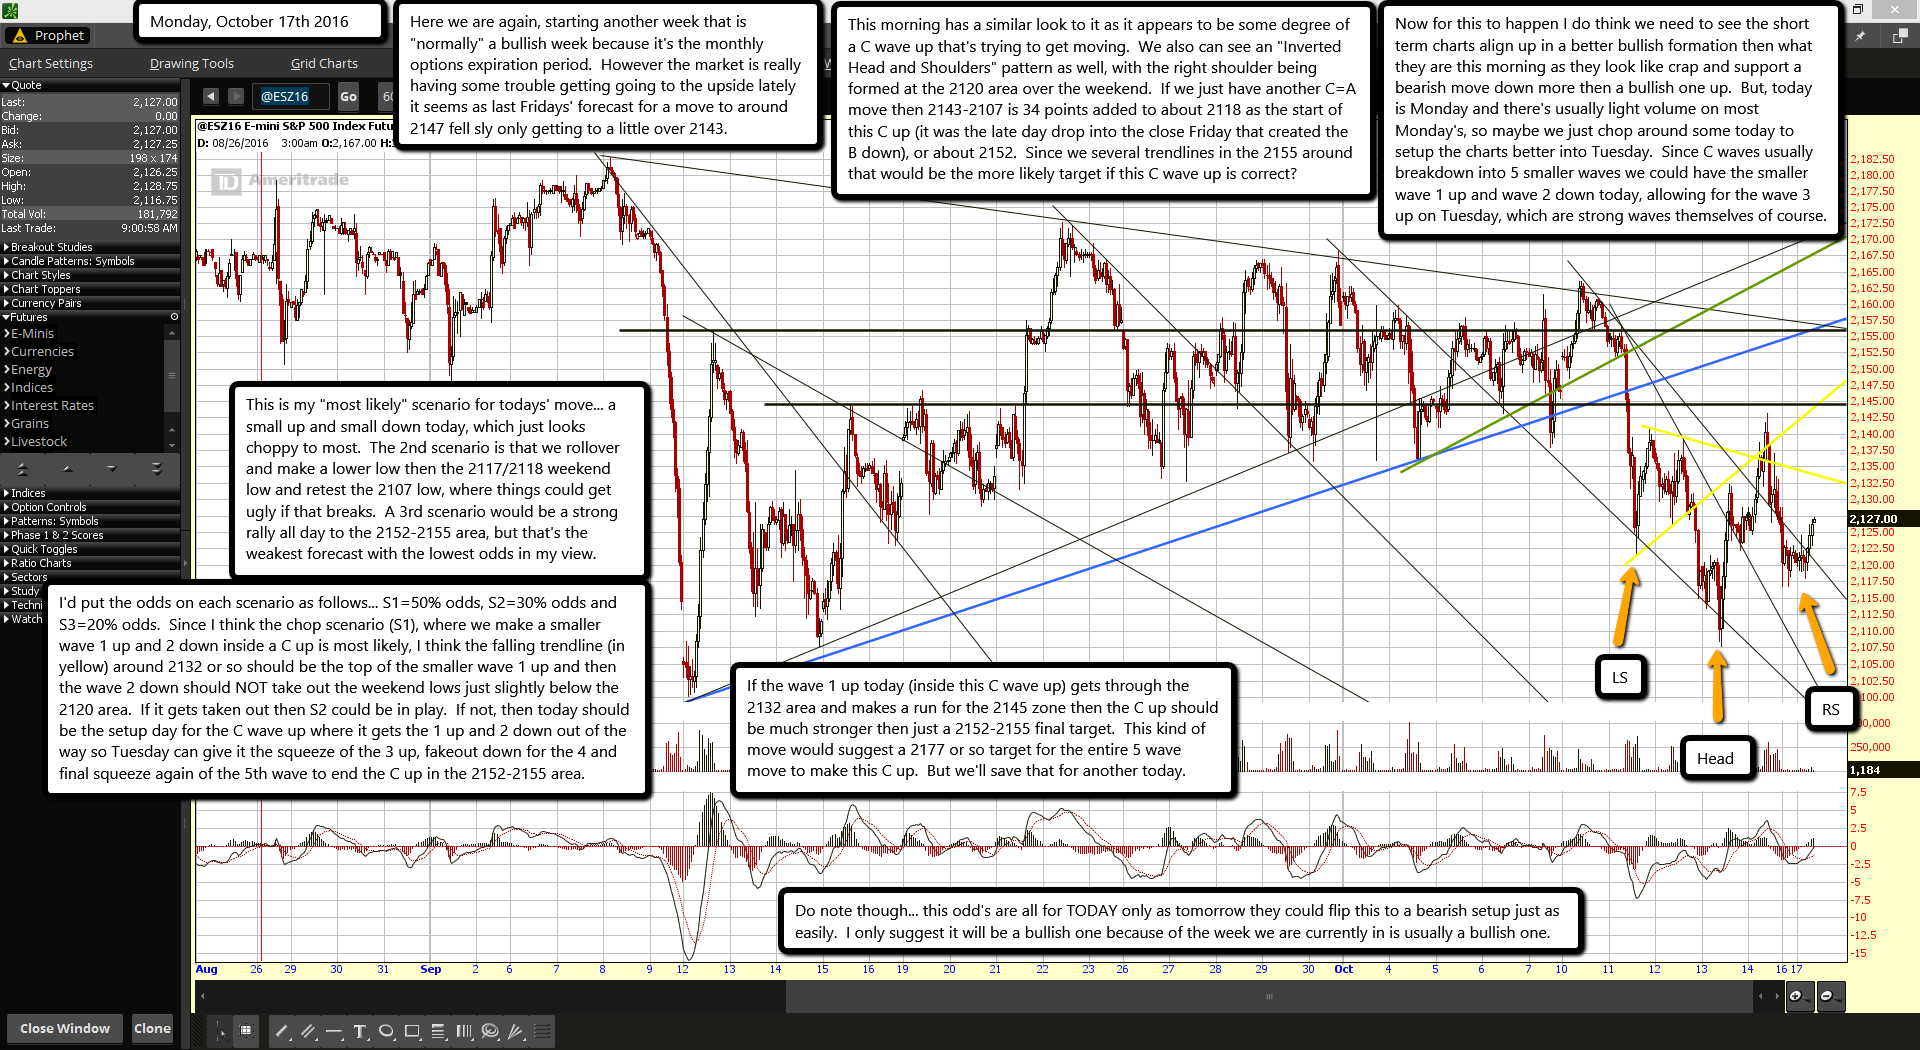
Here we are again, starting another week that is "normally" a bullish week because it's the monthly options expiration period. However the market is really having some trouble getting going to the upside lately it seems as last Fridays' forecast for a move to around 2147 fell sly only getting to a little over 2143.
This morning has a similar look to it as it appears to be some degree of a C wave up that's trying to get moving. We also can see an "Inverted Head and Shoulders" pattern as well, with the right shoulder being formed at the 2120 area over the weekend. If we just have another C=A move then 2143-2107 is 34 points added to about 2118 as the start of this C up (it was the late day drop into the close Friday that created the B down), or about 2152. Since we several trendlines in the 2155 around that would be the more likely target if this C wave up is correct?
Now for this to happen I do think we need to see the short term charts align up in a better bullish formation then what they are this morning as they look like crap and support a bearish move down more then a bullish one up. But, today is Monday and there's usually light volume on most Monday's, so maybe we just chop around some today to setup the charts better into Tuesday. Since C waves usually breakdown into 5 smaller waves we could have the smaller wave 1 up and wave 2 down today, allowing for the wave 3 up on Tuesday, which are strong waves themselves of course.
This is my "most likely" scenario for todays move... a small up and small down today, which just looks choppy to most. The 2nd scenario is that we rollover and make a lower low then the 2117/2118 weekend low and retest the 2107 low, where things could get ugly if that breaks. A 3rd scenario would be a strong rally all day to the 2152-2155 area, but that's the weakest forecast with the lowest odds in my view.
I'd put the odds on each scenario as follows... S1=50% odds, S2=30% odds and S3=20% odds. Since I think the chop scenario (S1), where we make a smaller wave 1 up and 2 down inside a C up is most likely, I think the falling trendline (in yellow) around 2132 or so should be the top of the smaller wave 1 up and then the wave 2 down should NOT take out the weekend lows just slightly below the 2120 area. If it gets taken out then S2 could be in play. If not, then today should be the setup day for the C wave up where it gets the 1 up and 2 down out of the way so Tuesday can give it the squeeze of the 3 up, fakeout down for the 4 and final squeeze again of the 5th wave to end the C up in the 2152-2155 area.
If the wave 1 up today (inside this C wave up) gets through the 2132 area and makes a run for the 2145 zone then the C up should be much stronger then just a 2152-2155 final target. This kind of move would suggest a 2177 or so target for the entire 5 wave move to make this C up. But we'll save that for another today.
Do note though... this odds are all for TODAY only as tomorrow they could flip this to a bearish setup just as easily. I only suggest it will be a bullish one because of the week we are currently in is usually a bullish one.

