
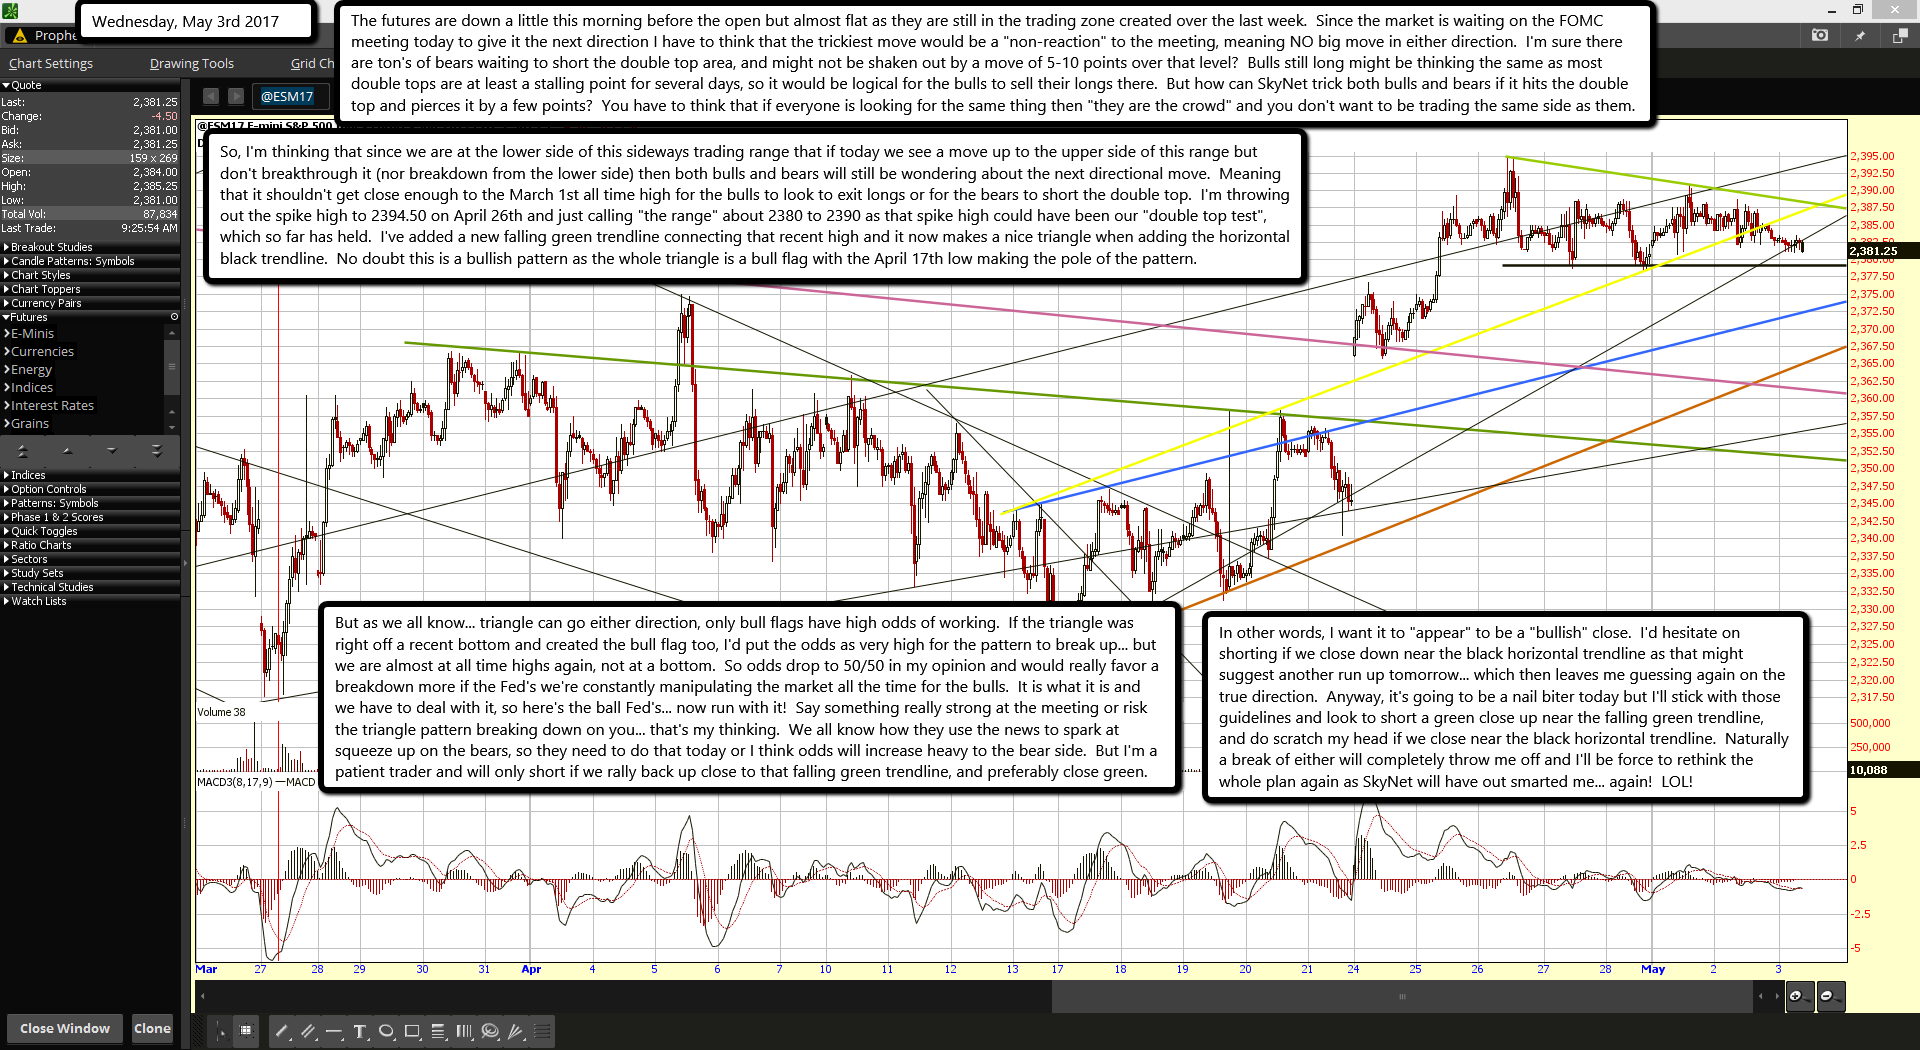
The futures are down a little this morning before the open but almost flat as they are still in the trading zone created over the last week. Since the market is waiting on the FOMC meeting today to give it the next direction I have to think that the trickiest move would be a "non-reaction" to the meeting, meaning NO big move in either direction. I'm sure there are ton's of bears waiting to short the double top area, and might not be shaken out by a move of 5-10 points over that level? Bulls still long might be thinking the same as most double tops are at least a stalling point for several days, so it would be logical for the bulls to sell their longs there. But how can SkyNet trick both bulls and bears if it hits the double top and pierces it by a few points? You have to think that if everyone is looking for the same thing then "they are the crowd" and you don't want to be trading the same side as them.
So, I'm thinking that since we are at the lower side of this sideways trading range that if today we see a move up to the upper side of this range but don't breakthrough it (nor breakdown from the lower side) then both bulls and bears will still be wondering about the next directional move. Meaning that it shouldn't get close enough to the March 1st all time high for the bulls to look to exit longs or for the bears to short the double top. I'm throwing out the spike high to 2394.50 on April 26th and just calling "the range" about 2380 to 2390 as that spike high could have been our "double top test", which so far has held. I've added a new falling green trendline connecting that recent high and it now makes a nice triangle when adding the horizontal black trendline. No doubt this is a bullish pattern as the whole triangle is a bull flag with the April 17th low making the pole of the pattern.
But as we all know... triangle can go either direction, only bull flags have high odds of working. If the triangle was right off a recent bottom and created the bull flag too, I'd put the odds as very high for the pattern to break up... but we are almost at all time highs again, not at a bottom. So odds drop to 50/50 in my opinion and would really favor a breakdown more if the Fed's we're constantly manipulating the market all the time for the bulls. It is what it is and we have to deal with it, so here's the ball Fed's... now run with it! Say something really strong at the meeting or risk the triangle pattern breaking down on you... that's my thinking. We all know how they use the news to spark at squeeze up on the bears, so they need to do that today or I think odds will increase heavy to the bear side. But I'm a patient trader and will only short if we rally back up close to that falling green trendline, and preferably close green.
In other words, I want it to "appear" to be a "bullish" close. I'd hesitate on shorting if we close down near the black horizontal trendline as that might suggest another run up tomorrow... which then leaves me guessing again on the true direction. Anyway, it's going to be a nail biter today but I'll stick with those guidelines and look to short a green close up near the falling green trendline, and do scratch my head if we close near the black horizontal trendline. Naturally a break of either will completely throw me off and I'll be force to rethink the whole plan again as SkyNet will have out smarted me... again! LOL!

