
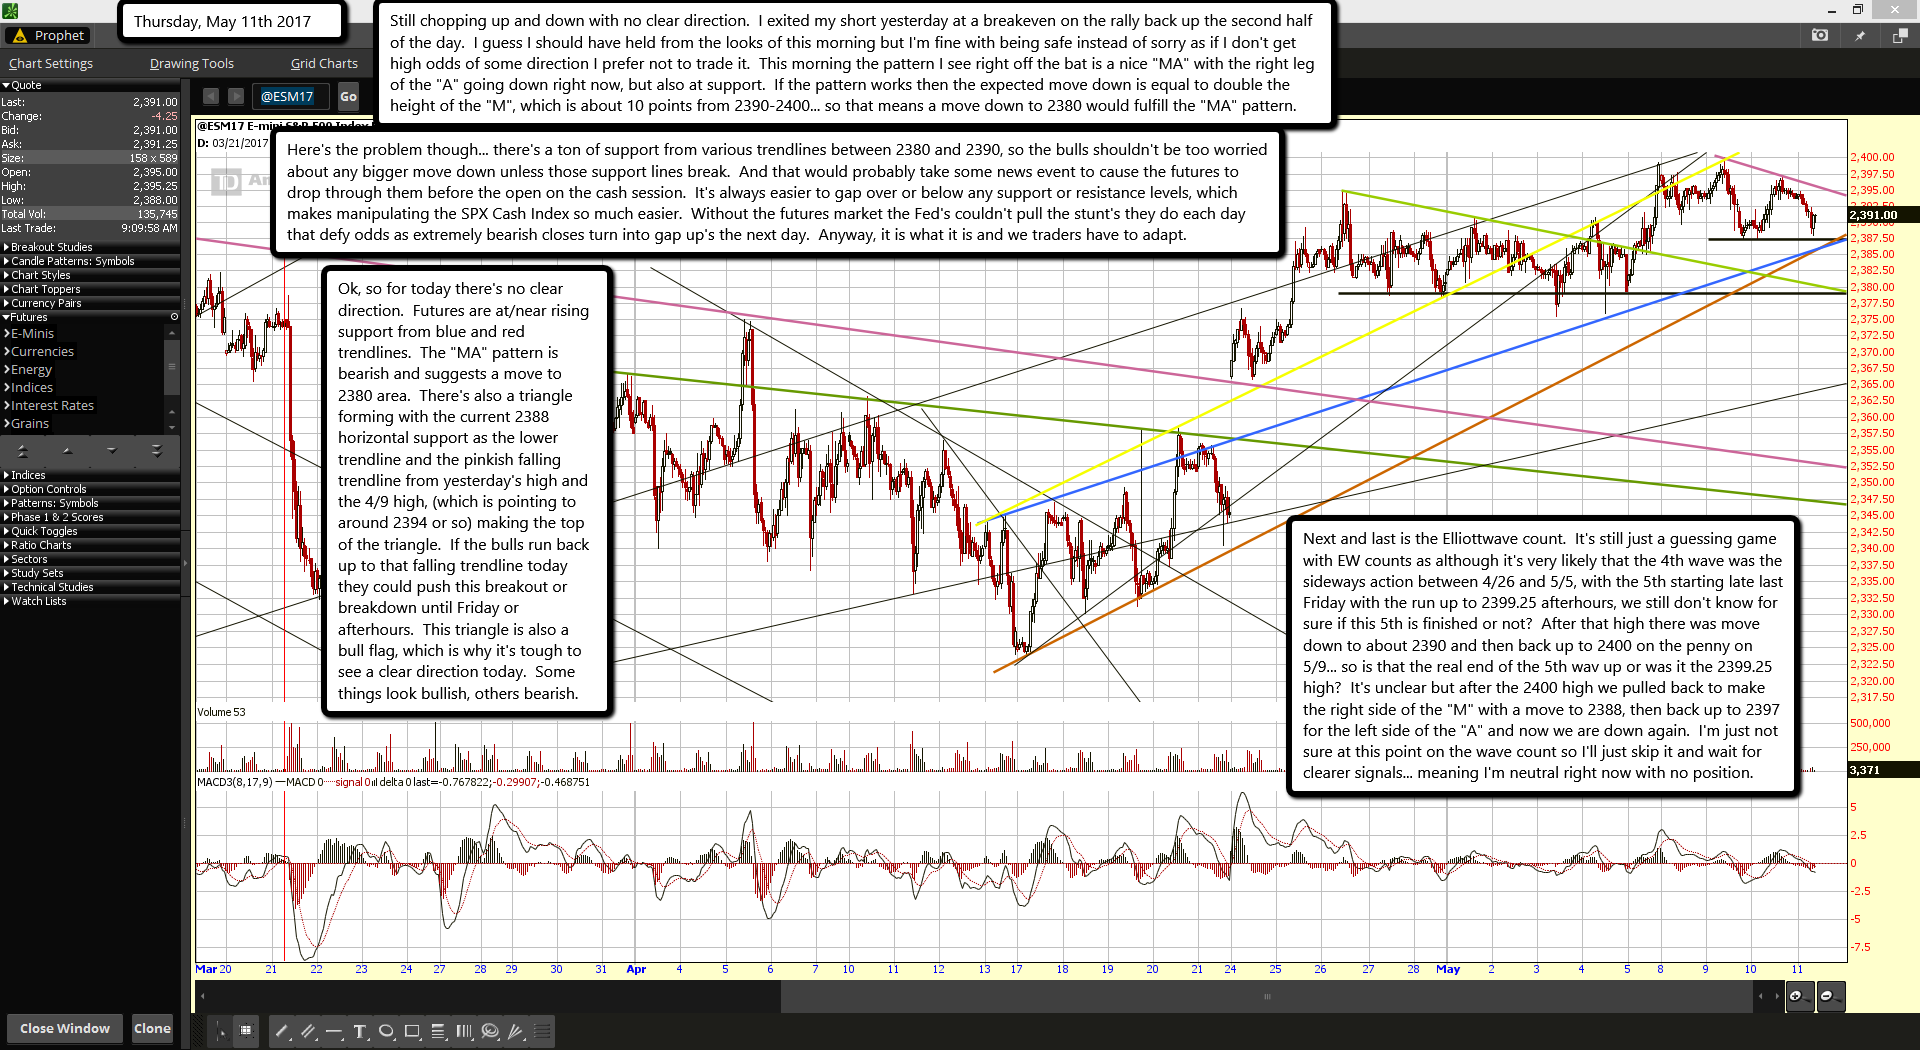
Still chopping up and down with no clear direction. I exited my short yesterday at a breakeven on the rally back up the second half of the day. I guess I should have held from the looks of this morning but I'm fine with being safe instead of sorry as if I don't get high odds of some direction I prefer not to trade it. This morning the pattern I see right off the bat is a nice "MA" with the right leg of the "A" going down right now, but also at support. If the pattern works then the expected move down is equal to double the height of the "M", which is about 10 points from 2390-2400... so that means a move down to 2380 would fulfill the "MA" pattern.
Here's the problem though... there's a ton of support from various trendlines between 2380 and 2390, so the bulls shouldn't be too worried about any bigger move down unless those support lines break. And that would probably take some news event to cause the futures to drop through them before the open on the cash session. It's always easier to gap over or below any support or resistance levels, which makes manipulating the SPX Cash Index so much easier. Without the futures market the Fed's couldn't pull the stunt's they do each day that defy odds as extremely bearish closes turn into gap up's the next day. Anyway, it is what it is and we traders have to adapt.
Ok, so for today there's no clear direction. Futures are at/near rising support from blue and red trendlines. The "MA" pattern is bearish and suggests a move to 2380 area. There's also a triangle forming with the current 2388 horizontal support as the lower trendline and the pinkish falling trendline from yesterday's high and the 4/9 high, (which is pointing to around 2394 or so) making the top of the triangle. If the bulls run back up to that falling trendline today they could push this breakout or breakdown until Friday or afterhours. This triangle is also a bull flag, which is why it's tough to see a clear direction today. Some things look bullish, others bearish.
Next and last is the Elliottwave count. It's still just a guessing game with EW counts as although it's very likely that the 4th wave was the sideways action between 4/26 and 5/5, with the 5th starting late last Friday with the run up to 2399.25 afterhours, we still don't know for sure if this 5th is finished or not? After that high there was move down to about 2390 and then back up to 2400 on the penny on 5/9... so is that the real end of the 5th wav up or was it the 2399.25 high? It's unclear but after the 2400 high we pulled back to make the right side of the "M" with a move to 2388, then back up to 2397 for the left side of the "A" and now we are down again. I'm just not sure at this point on the wave count so I'll just skip it and wait for clearer signals... meaning I'm neutral right now with no position.

