
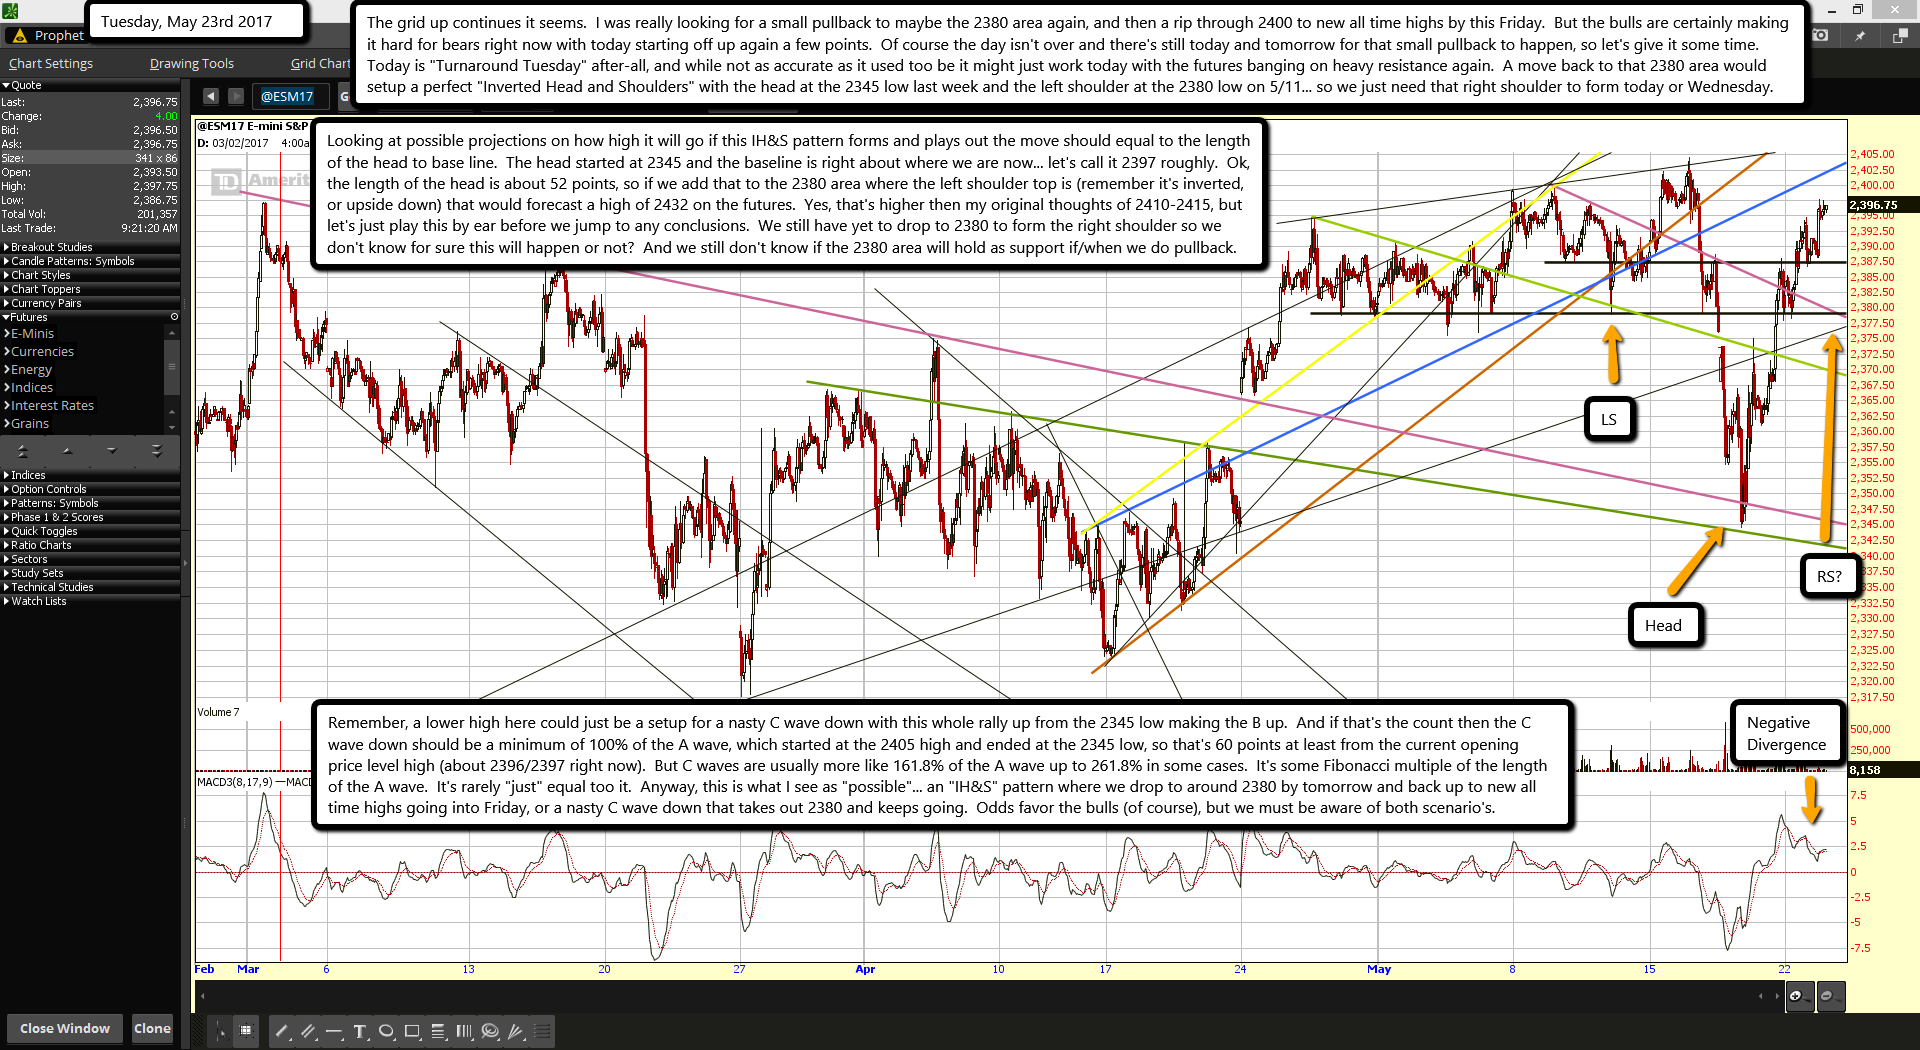
The grid up continues it seems. I was really looking for a small pullback to maybe the 2380 area again, and then a rip through 2400 to new all time highs by this Friday. But the bulls are certainly making it hard for bears right now with today starting off up again a few points. Of course the day isn't over and there's still today and tomorrow for that small pullback to happen, so let's give it some time. Today is "Turnaround Tuesday" after-all, and while not as accurate as it used too be it might just work today with the futures banging on heavy resistance again. A move back to that 2380 area would setup a perfect "Inverted Head and Shoulders" with the head at the 2345 low last week and the left shoulder at the 2380 low on 5/11... so we just need that right shoulder to form today or Wednesday.
Looking at possible projections on how high it will go if this IH&S pattern forms and plays out the move should equal to the length of the head to base line. The head started at 2345 and the baseline is right about where we are now... let's call it 2397 roughly. Ok, the length of the head is about 52 points, so if we add that to the 2380 area where the left shoulder top is (remember it's inverted, or upside down) that would forecast a high of 2432 on the futures. Yes, that's higher then my original thoughts of 2410-2415, but let's just play this by ear before we jump to any conclusions. We still have yet to drop to 2380 to form the right shoulder so we don't know for sure this will happen or not? And we still don't know if the 2380 area will hold as support if/when we do pullback.
Remember, a lower high here could just be a setup for a nasty C wave down with this whole rally up from the 2345 low making the B up. And if that's the count then the C wave down should be a minimum of 100% of the A wave, which started at the 2405 high and ended at the 2345 low, so that's 60 points at least from the current opening price level high (about 2396/2397 right now). But C waves are usually more like 161.8% of the A wave up to 261.8% in some cases. It's some Fibonacci multiple of the length of the A wave. It's rarely "just" equal too it. Anyway, this is what I see as "possible"... an "IH&S" pattern where we drop to around 2380 by tomorrow and back up to new all time highs going into Friday, or a nasty C wave down that takes out 2380 and keeps going. Odds favor the bulls (of course), but we must be aware of both scenario's.

