
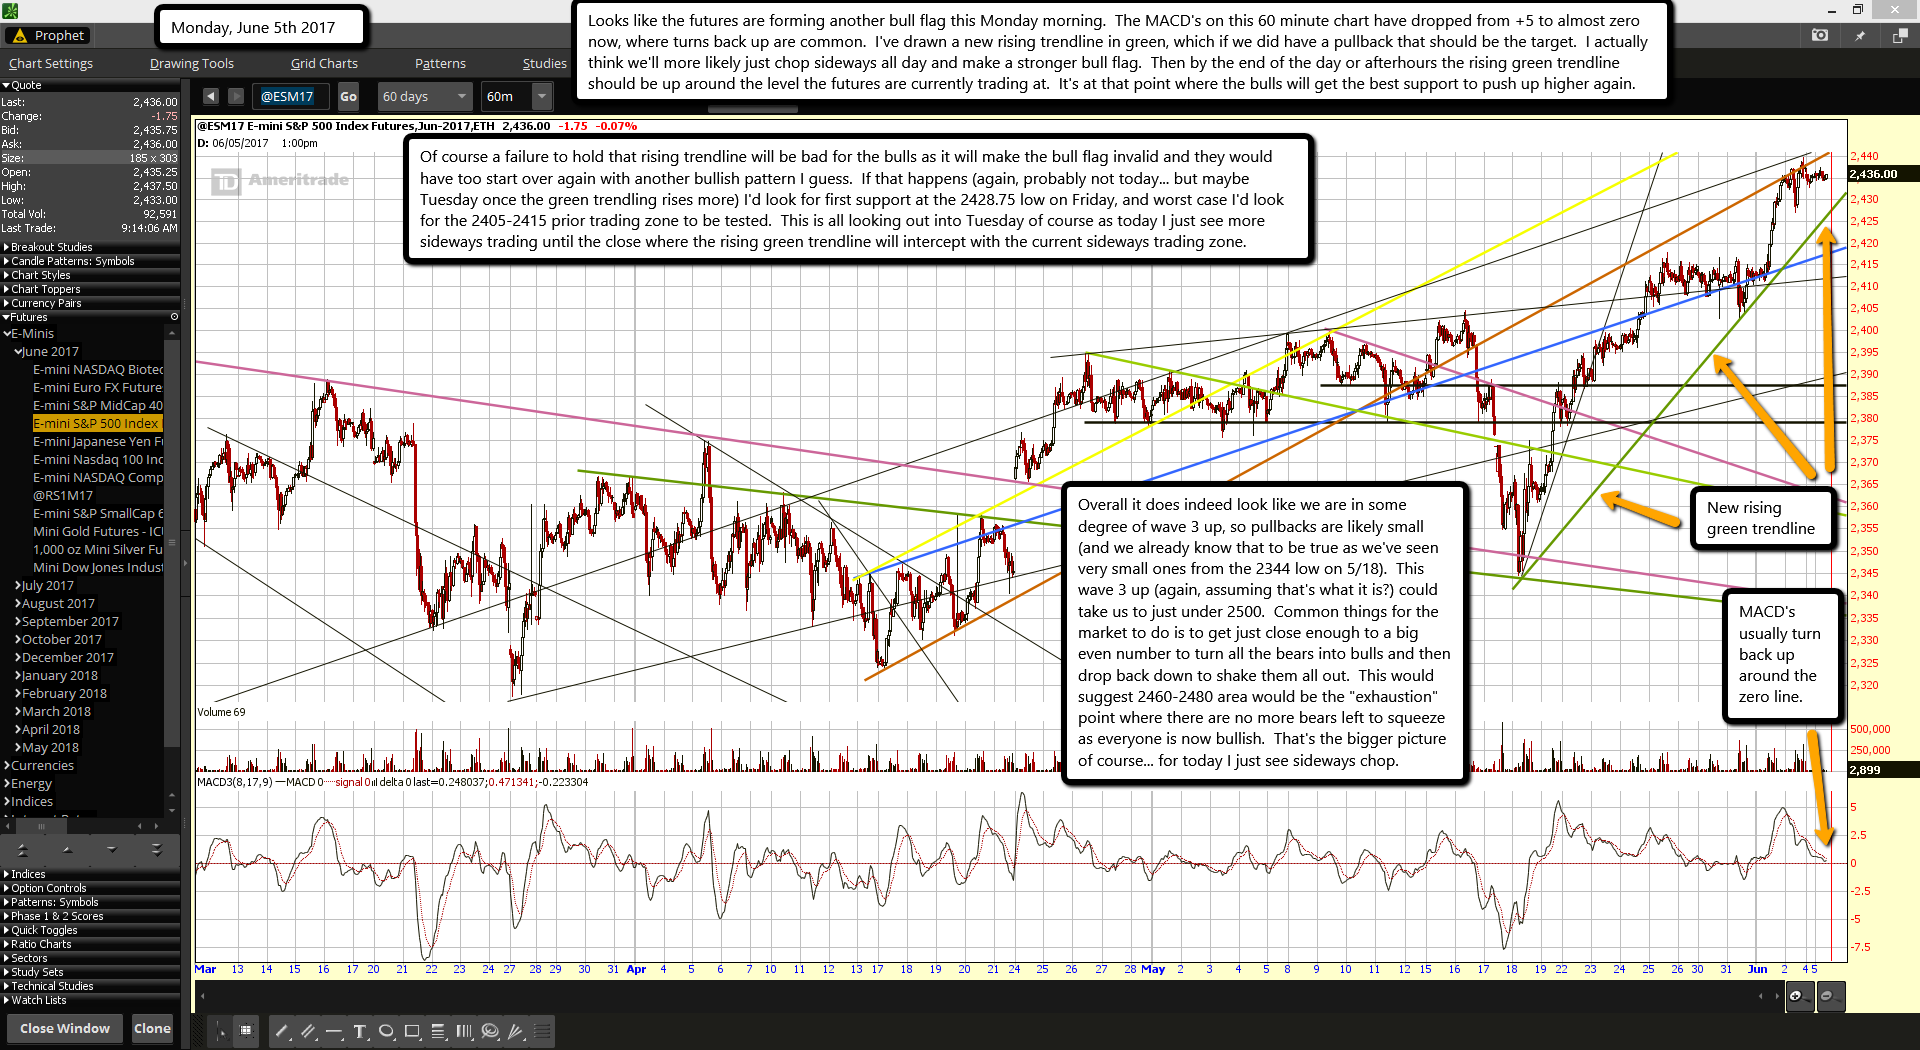
Looks like the futures are forming another bull flag this Monday morning. The MACD's on this 60 minute chart have dropped from +5 to almost zero now, where turns back up are common. I've drawn a new rising trendline in green, which if we did have a pullback that should be the target. I actually think we'll more likely just chop sideways all day and make a stronger bull flag. Then by the end of the day or afterhours the rising green trendline should be up around the level the futures are currently trading at. It's at that point where the bulls will get the best support to push up higher again.
Of course a failure to hold that rising trendline will be bad for the bulls as it will make the bull flag invalid and they would have too start over again with another bullish pattern I guess. If that happens (again, probably not today... but maybe Tuesday once the green trendling rises more) I'd look for first support at the 2428.75 low on Friday, and worst case I'd look for the 2405-2415 prior trading zone to be tested. This is all looking out into Tuesday of course as today I just see more sideways trading until the close where the rising green trendline will intercept with the current sideways trading zone.
Overall it does indeed look like we are in some degree of wave 3 up, so pullbacks are likely small (and we already know that to be true as we've seen very small ones from the 2344 low on 5/18). This wave 3 up (again, assuming that's what it is?) could take us to just under 2500. Common things for the market to do is to get just close enough to a big even number to turn all the bears into bulls and then drop back down to shake them all out. This would suggest 2460-2480 area would be the "exhaustion" point where there are no more bears left to squeeze as everyone is now bullish. That's the bigger picture of course... for today I just see sideways chop.

