
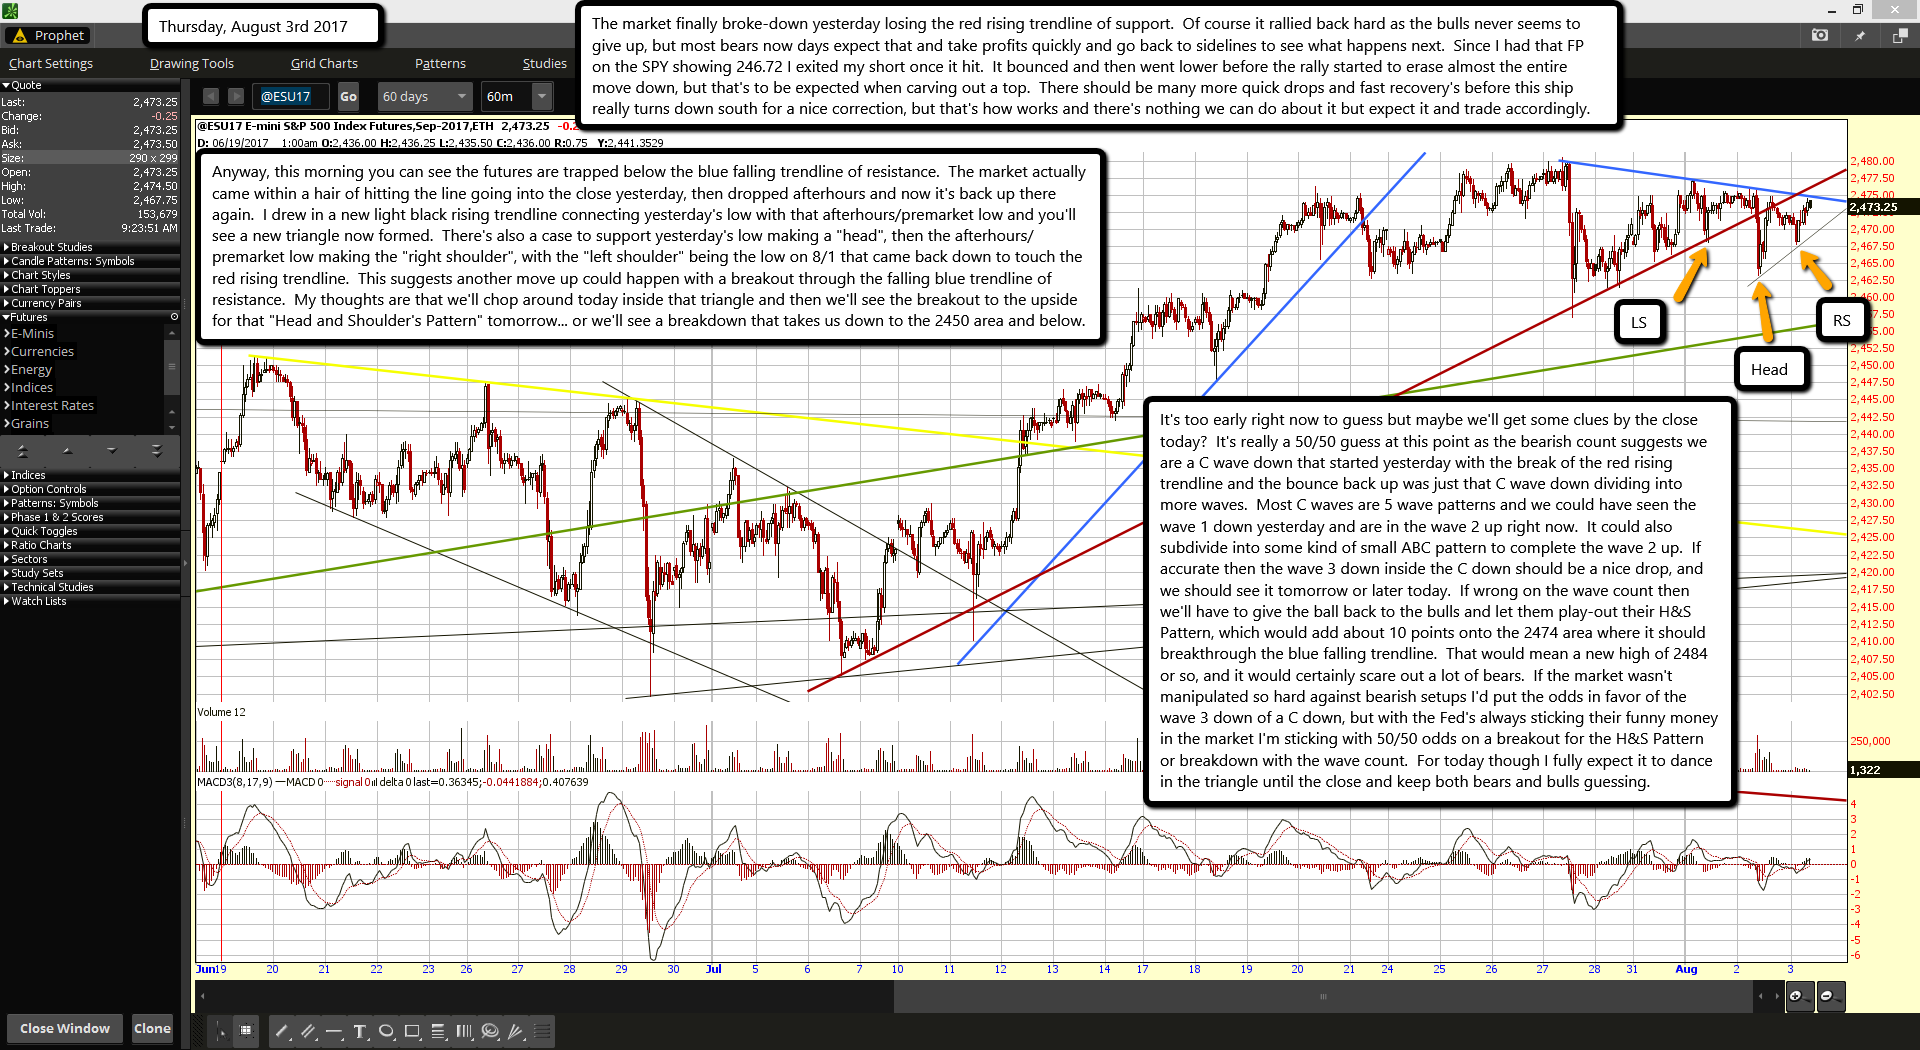
The market finally broke-down yesterday losing the red rising trendline of support. Of course it rallied back hard as the bulls never seems to give up, but most bears now days expect that and take profits quickly and go back to sidelines to see what happens next. Since I had that FP on the SPY showing 246.72 I exited my short once it hit. It bounced and then went lower before the rally started to erase almost the entire move down, but that's to be expected when carving out a top. There should be many more quick drops and fast recovery's before this ship really turns down south for a nice correction, but that's how works and there's nothing we can do about it but expect it and trade accordingly.
Anyway, this morning you can see the futures are trapped below the blue falling trendline of resistance. The market actually came within a hair of hitting the line going into the close yesterday, then dropped afterhours and now it's back up there again. I drew in a new light black rising trendline connecting yesterday's low with that afterhours/premarket low and you'll see a new triangle now formed. There's also a case to support yesterday's low making a "head", then the afterhours/premarket low making the "right shoulder", with the "left shoulder" being the low on 8/1 that came back down to touch the red rising trendline. This suggests another move up could happen with a breakout through the falling blue trendline of resistance. My thoughts are that we'll chop around today inside that triangle and then we'll see the breakout to the upside for that "Head and Shoulder's Pattern" tomorrow... or we'll see a breakdown that takes us down to the 2450 area and below.
It's too early right now to guess but maybe we'll get some clues by the close today? It's really a 50/50 guess at this point as the bearish count suggests we are a C wave down that started yesterday with the break of the red rising trendline and the bounce back up was just that C wave down dividing into more waves. Most C waves are 5 wave patterns and we could have seen the wave 1 down yesterday and are in the wave 2 up right now. It could also subdivide into some kind of small ABC pattern to complete the wave 2 up. If accurate then the wave 3 down inside the C down should be a nice drop, and we should see it tomorrow or later today. If wrong on the wave count then we'll have to give the ball back to the bulls and let them play-out their H&S Pattern, which would add about 10 points onto the 2474 area where it should breakthrough the blue falling trendline. That would mean a new high of 2484 or so, and it would certainly scare out a lot of bears. If the market wasn't manipulated so hard against bearish setups I'd put the odds in favor of the wave 3 down of a C down, but with the Fed's always sticking their funny money in the market I'm sticking with 50/50 odds on a breakout for the H&S Pattern or breakdown with the wave count. For today though I fully expect it to dance in the triangle until the close and keep both bears and bulls guessing.

