
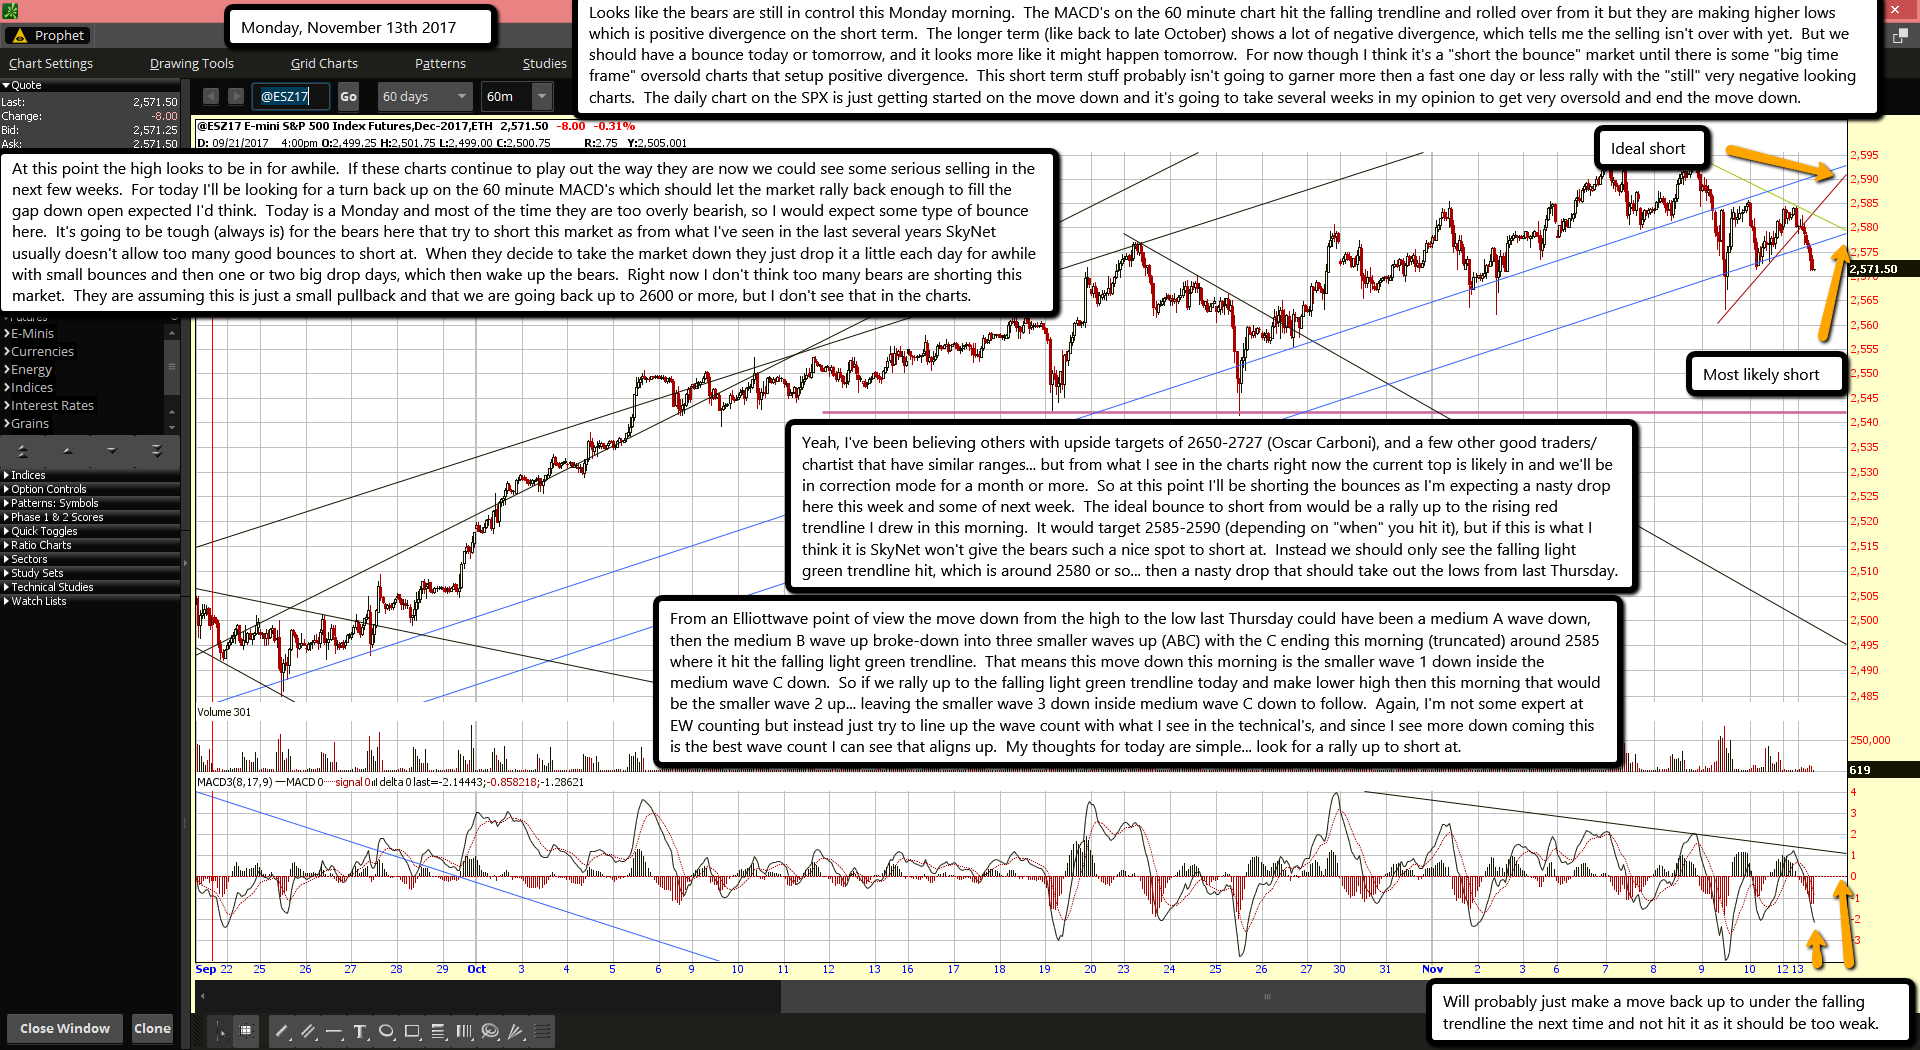
Looks like the bears are still in control this Monday morning. The MACD's on the 60 minute chart hit the falling trendline and rolled over from it but they are making higher lows which is positive divergence on the short term. The longer term (like back to late October) shows a lot of negative divergence, which tells me the selling isn't over with yet. But we should have a bounce today or tomorrow, and it looks more like it might happen tomorrow. For now though I think it's a "short the bounce" market until there is some "big time frame" oversold charts that setup positive divergence. This short term stuff probably isn't going to garner more then a fast one day or less rally with the "still" very negative looking charts. The daily chart on the SPX is just getting started on the move down and it's going to take several weeks in my opinion to get very oversold and end the move down.
At this point the high looks to be in for awhile. If these charts continue to play out the way they are now we could see some serious selling in the next few weeks. For today I'll be looking for a turn back up on the 60 minute MACD's which should let the market rally back enough to fill the gap down open expected I'd think. Today is a Monday and most of the time they are too overly bearish, so I would expect some type of bounce here. It's going to be tough (always is) for the bears here that try to short this market as from what I've seen in the last several years SkyNet usually doesn't allow too many good bounces to short at. When they decide to take the market down they just drop it a little each day for awhile with small bounces and then one or two big drop days, which then wake up the bears. Right now I don't think too many bears are shorting this market. They are assuming this is just a small pullback and that we are going back up to 2600 or more, but I don't see that in the charts.
Yeah, I've been believing others with upside targets of 2650-2727 (Oscar Carboni), and a few other good traders/chartist that have similar ranges... but from what I see in the charts right now the current top is likely in and we'll be in correction mode for a month or more. So at this point I'll be shorting the bounces as I'm expecting a nasty drop here this week and some of next week. The ideal bounce to short from would be a rally up to the rising red trendline I drew in this morning. It would target 2585-2590 (depending on "when" you hit it), but if this is what I think it is SkyNet won't give the bears such a nice spot to short at. Instead we should only see the falling light green trendline hit, which is around 2580 or so... then a nasty drop that should take out the lows from last Thursday.
From an Elliottwave point of view the move down from the high to the low last Thursday could have been a medium A wave down, then the medium B wave up broke-down into three smaller waves up (ABC) with the C ending this morning (truncated) around 2585 where it hit the falling light green trendline. That means this move down this morning is the smaller wave 1 down inside the medium wave C down. So if we rally up to the falling light green trendline today and make lower high then this morning that would be the smaller wave 2 up... leaving the smaller wave 3 down inside medium wave C down to follow. Again, I'm not some expert at EW counting but instead just try to line up the wave count with what I see in the technical's, and since I see more down coming this is the best wave count I can see that aligns up. My thoughts for today are simple... look for a rally up to short at.

