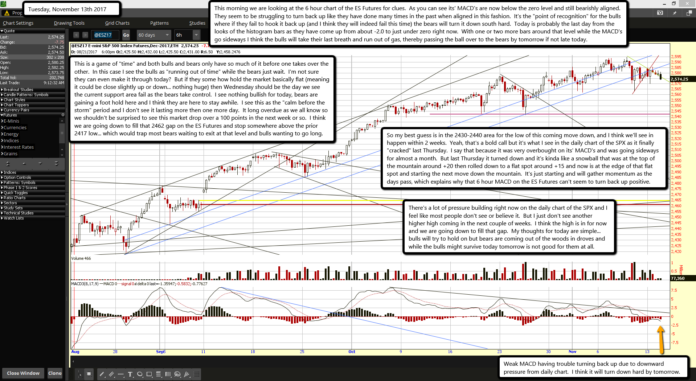
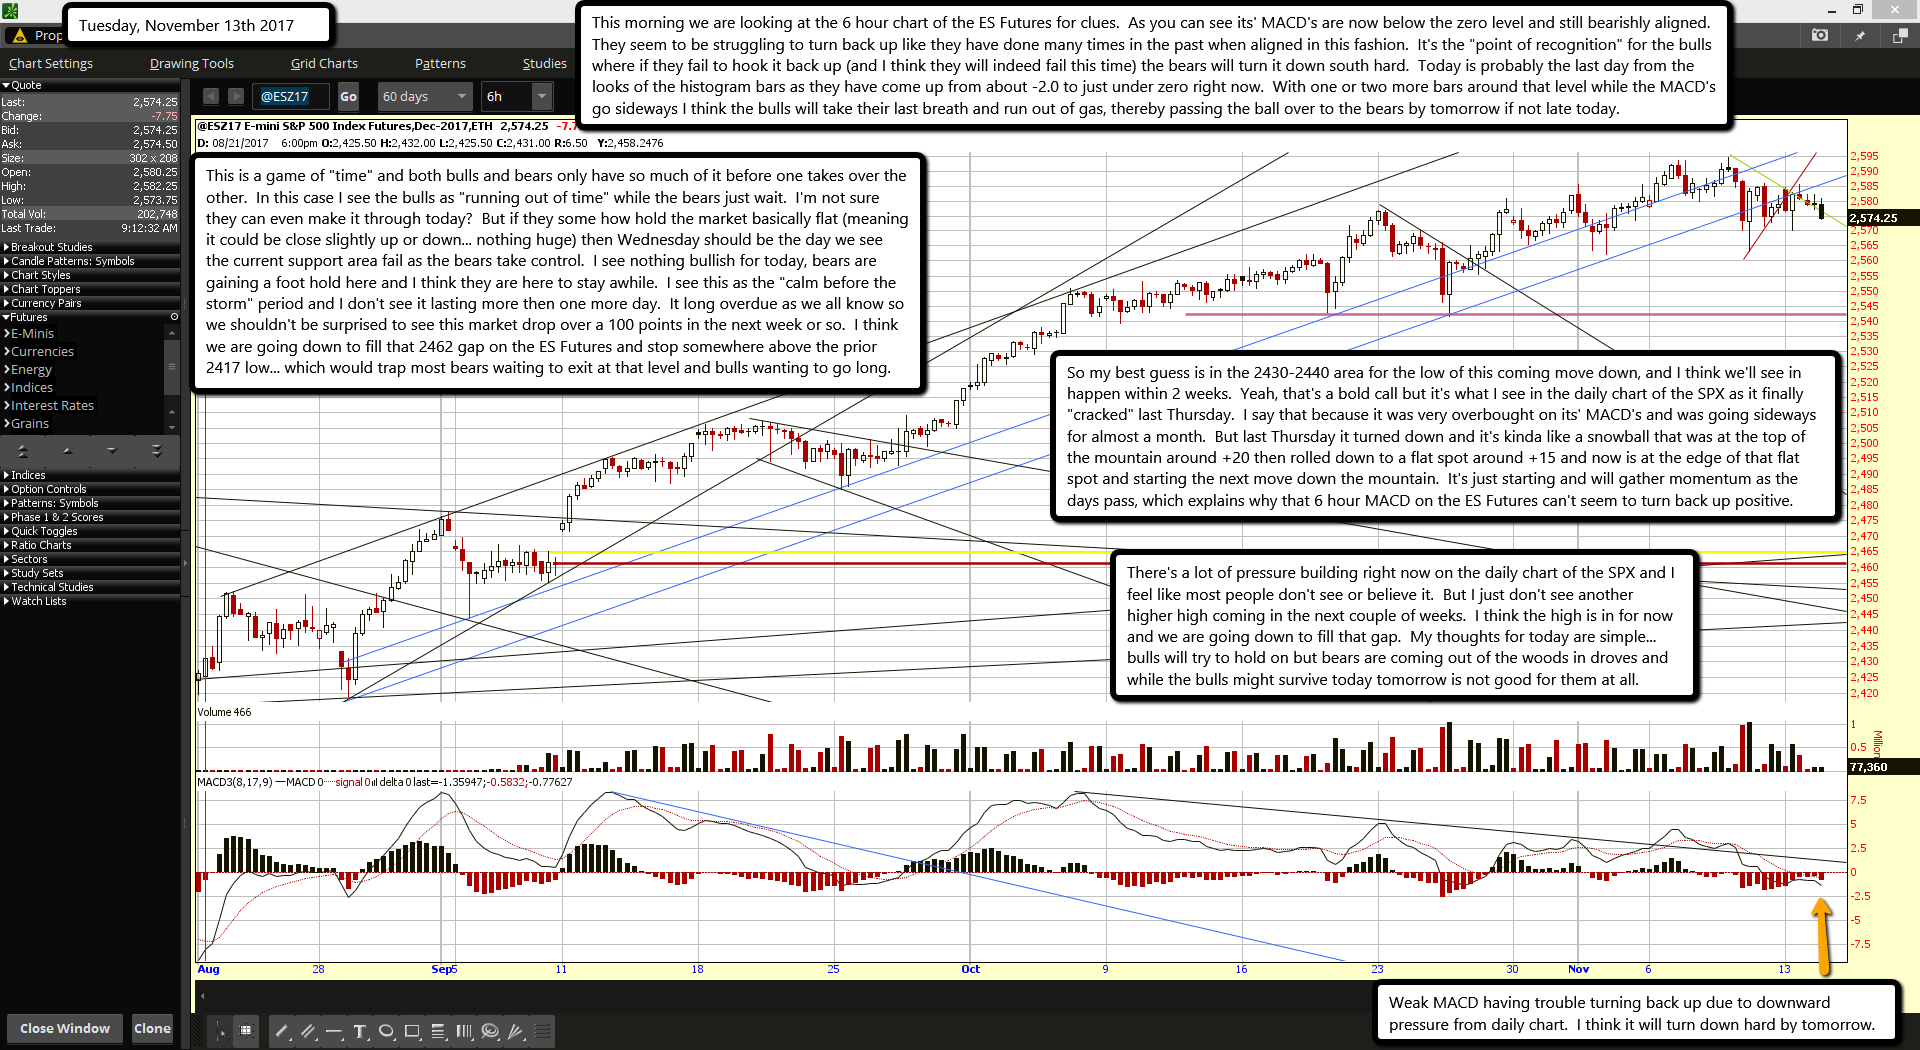
This morning we are looking at the 6 hour chart of the ES Futures for clues. As you can see its' MACD's are now below the zero level and still bearishly aligned. They seem to be struggling to turn back up like they have done many times in the past when aligned in this fashion. It's the "point of recognition" for the bulls where if they fail to hook it back up (and I think they will indeed fail this time) the bears will turn it down south hard. Today is probably the last day from the looks of the histogram bars as they have come up from about -2.0 to just under zero right now. With one or two more bars around that level while the MACD's go sideways I think the bulls will take their last breath and run out of gas, thereby passing the ball over to the bears by tomorrow if not late today.
This is a game of "time" and both bulls and bears only have so much of it before one takes over the other. In this case I see the bulls as "running out of time" while the bears just wait. I'm not sure they can even make it through today? But if they some how hold the market basically flat (meaning it could be close slightly up or down... nothing huge) then Wednesday should be the day we see the current support area fail as the bears take control. I see nothing bullish for today, bears are gaining a foot hold here and I think they are here to stay awhile. I see this as the "calm before the storm" period and I don't see it lasting more then one more day. It long overdue as we all know so we shouldn't be surprised to see this market drop over a 100 points in the next week or so. I think we are going down to fill that 2462 gap on the ES Futures and stop somewhere above the prior 2417 low... which would trap most bears waiting to exit at that level and bulls wanting to go long.
So my best guess is in the 2430-2440 area for the low of this coming move down, and I think we'll see in happen within 2 weeks. Yeah, that's a bold call but it's what I see in the daily chart of the SPX as it finally "cracked" last Thursday. I say that because it was very overbought on its' MACD's and was going sideways for almost a month. But last Thursday it turned down and it's kinda like a snowball that was at the top of the mountain around +20 then rolled down to a flat spot around +15 and now is at the edge of that flat spot and starting the next move down the mountain. It's just starting and will gather momentum as the days pass, which explains why that 6 hour MACD on the ES Futures can't seem to turn back up positive.
There's a lot of pressure building right now on the daily chart of the SPX and I feel like most people don't see or believe it. But I just don't see another higher high coming in the next couple of weeks. I think the high is in for now and we are going down to fill that gap. My thoughts for today are simple... bulls will try to hold on but bears are coming out of the woods in droves and while the bulls might survive today tomorrow is not good for them at all.


