
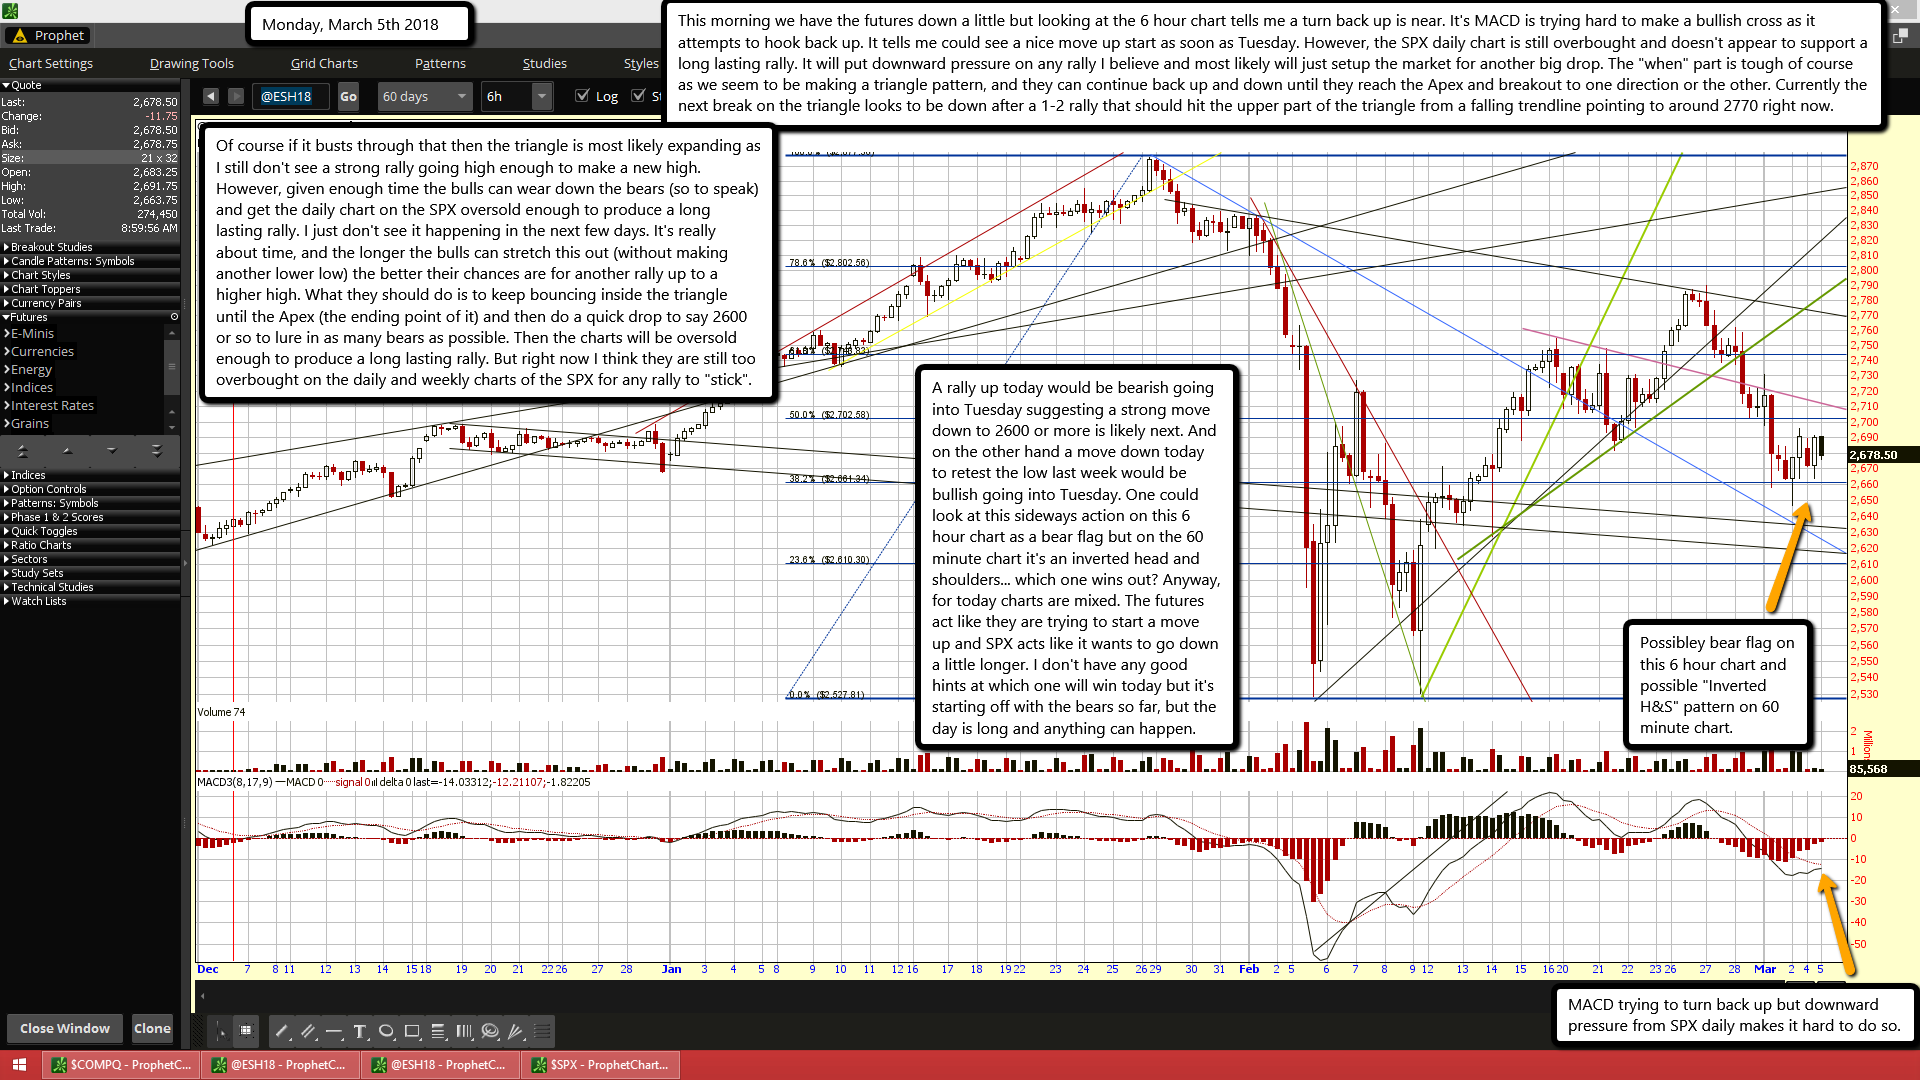
This morning we have the futures down a little but looking at the 6 hour chart tells me a turn back up is near. It's MACD is trying hard to make a bullish cross as it attempts to hook back up. It tells me could see a nice move up start as soon as Tuesday. However, the SPX daily chart is still overbought and doesn't appear to support a long lasting rally. It will put downward pressure on any rally I believe and most likely will just setup the market for another big drop. The "when" part is tough of course as we seem to be making a triangle pattern, and they can continue back up and down until they reach the Apex and breakout to one direction or the other. Currently the next break on the triangle looks to be down after a 1-2 rally that should hit the upper part of the triangle from a falling trendline pointing to around 2770 right now.
Of course if it busts through that then the triangle is most likely expanding as I still don't see a strong rally going high enough to make a new high. However, given enough time the bulls can wear down the bears (so to speak) and get the daily chart on the SPX oversold enough to produce a long lasting rally. I just don't see it happening in the next few days. It's really about time, and the longer the bulls can stretch this out (without making another lower low) the better their chances are for another rally up to a higher high. What they should do is to keep bouncing inside the triangle until the Apex (the ending point of it) and then do a quick drop to say 2600 or so to lure in as many bears as possible. Then the charts will be oversold enough to produce a long lasting rally. But right now I think they are still too overbought on the daily and weekly charts of the SPX for any rally to "stick".
A rally up today would be bearish going into Tuesday suggesting a strong move down to 2600 or more is likely next. And on the other hand a move down today to retest the low last week would be bullish going into Tuesday. One could look at this sideways action on this 6 hour chart as a bear flag but on the 60 minute chart it's an inverted head and shoulders... which one wins out? Anyway, for today charts are mixed. The futures act like they are trying to start a move up and SPX acts like it wants to go down a little longer. I don't have any good hints at which one will win today but it's starting off with the bears so far, but the day is long and anything can happen.

