
WOW is all I can say about yesterday. Another huge drop and even bigger recovery back up. A very wild and crazy day indeed. Now, the question is... will it stick? Is that the bottom? Or will we go back down again today to retrace half or it or more? I wish I knew the answer on that one but I don't. If I were SkyNet I'd just trade it sideways all day into the close and not give bulls or bears a chance at trading today. Most traders missed that move up and would love to see another dip to get long at, and bears got trapped shorting that early morning move down and would also like a chance to get out.
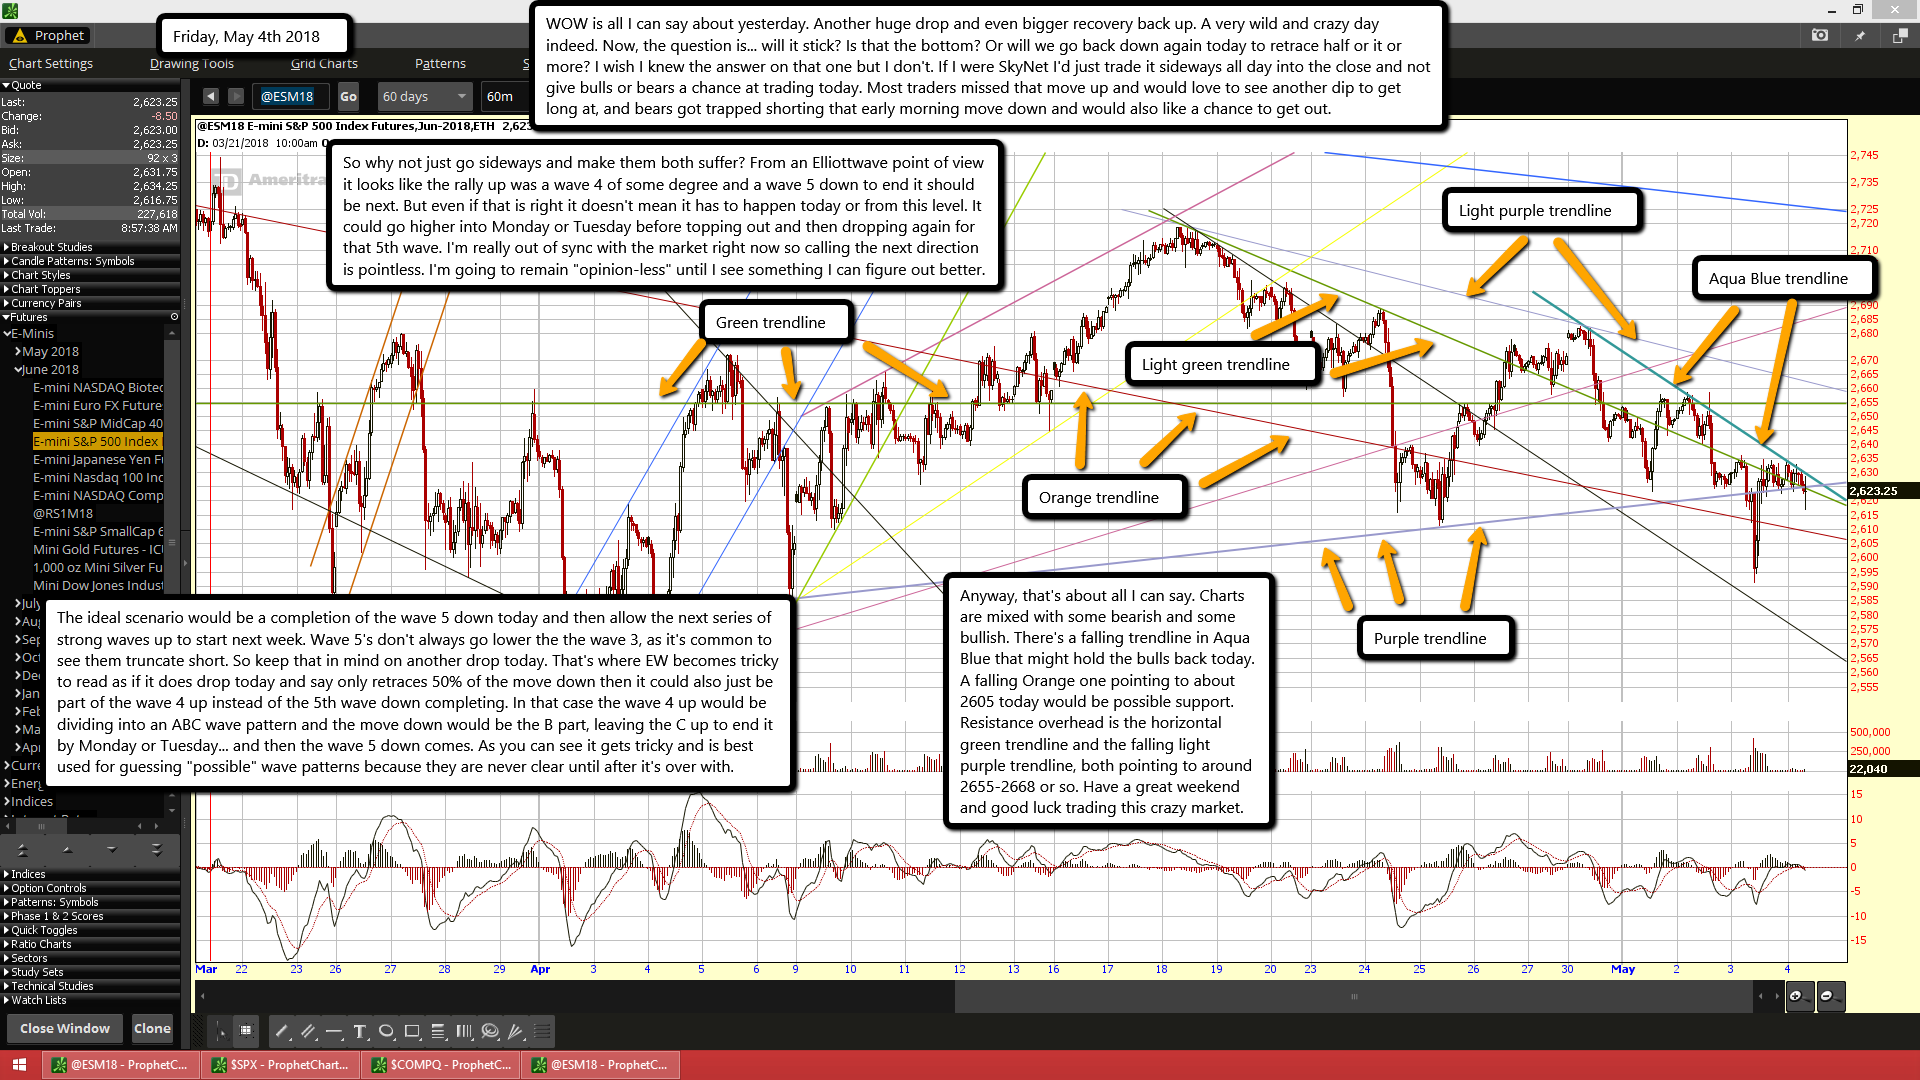
So why not just go sideways and make them both suffer? From an Elliottwave point of view it looks like the rally up was a wave 4 of some degree and a wave 5 down to end it should be next. But even if that is right it doesn't mean it has to happen today or from this level. It could go higher into Monday or Tuesday before topping out and then dropping again for that 5th wave. I'm really out of sync with the market right now so calling the next direction is pointless. I'm going to remain "opinion-less" until I see something I can figure out better.
The ideal scenario would be a completion of the wave 5 down today and then allow the next series of strong waves up to start next week. Wave 5's don't always go lower the the wave 3, as it's common to see them truncate short. So keep that in mind on another drop today. That's where EW becomes tricky to read as if it does drop today and say only retraces 50% of the move down then it could also just be part of the wave 4 up instead of the 5th wave down completing. In that case the wave 4 up would be dividing into an ABC wave pattern and the move down would be the B part, leaving the C up to end it by Monday or Tuesday... and then the wave 5 down comes. As you can see it gets tricky and is best used for guessing "possible" wave patterns because they are never clear until after it's over with.
Anyway, that's about all I can say. Charts are mixed with some bearish and some bullish. There's a falling trendline in Aqua Blue that might hold the bulls back today. A falling Orange one pointing to about 2605 today would be possible support. Resistance overhead is the horizontal green trendline and the falling light purple trendline, both pointing to around 2655-2668 or so. Have a great weekend and good luck trading this crazy market.

