
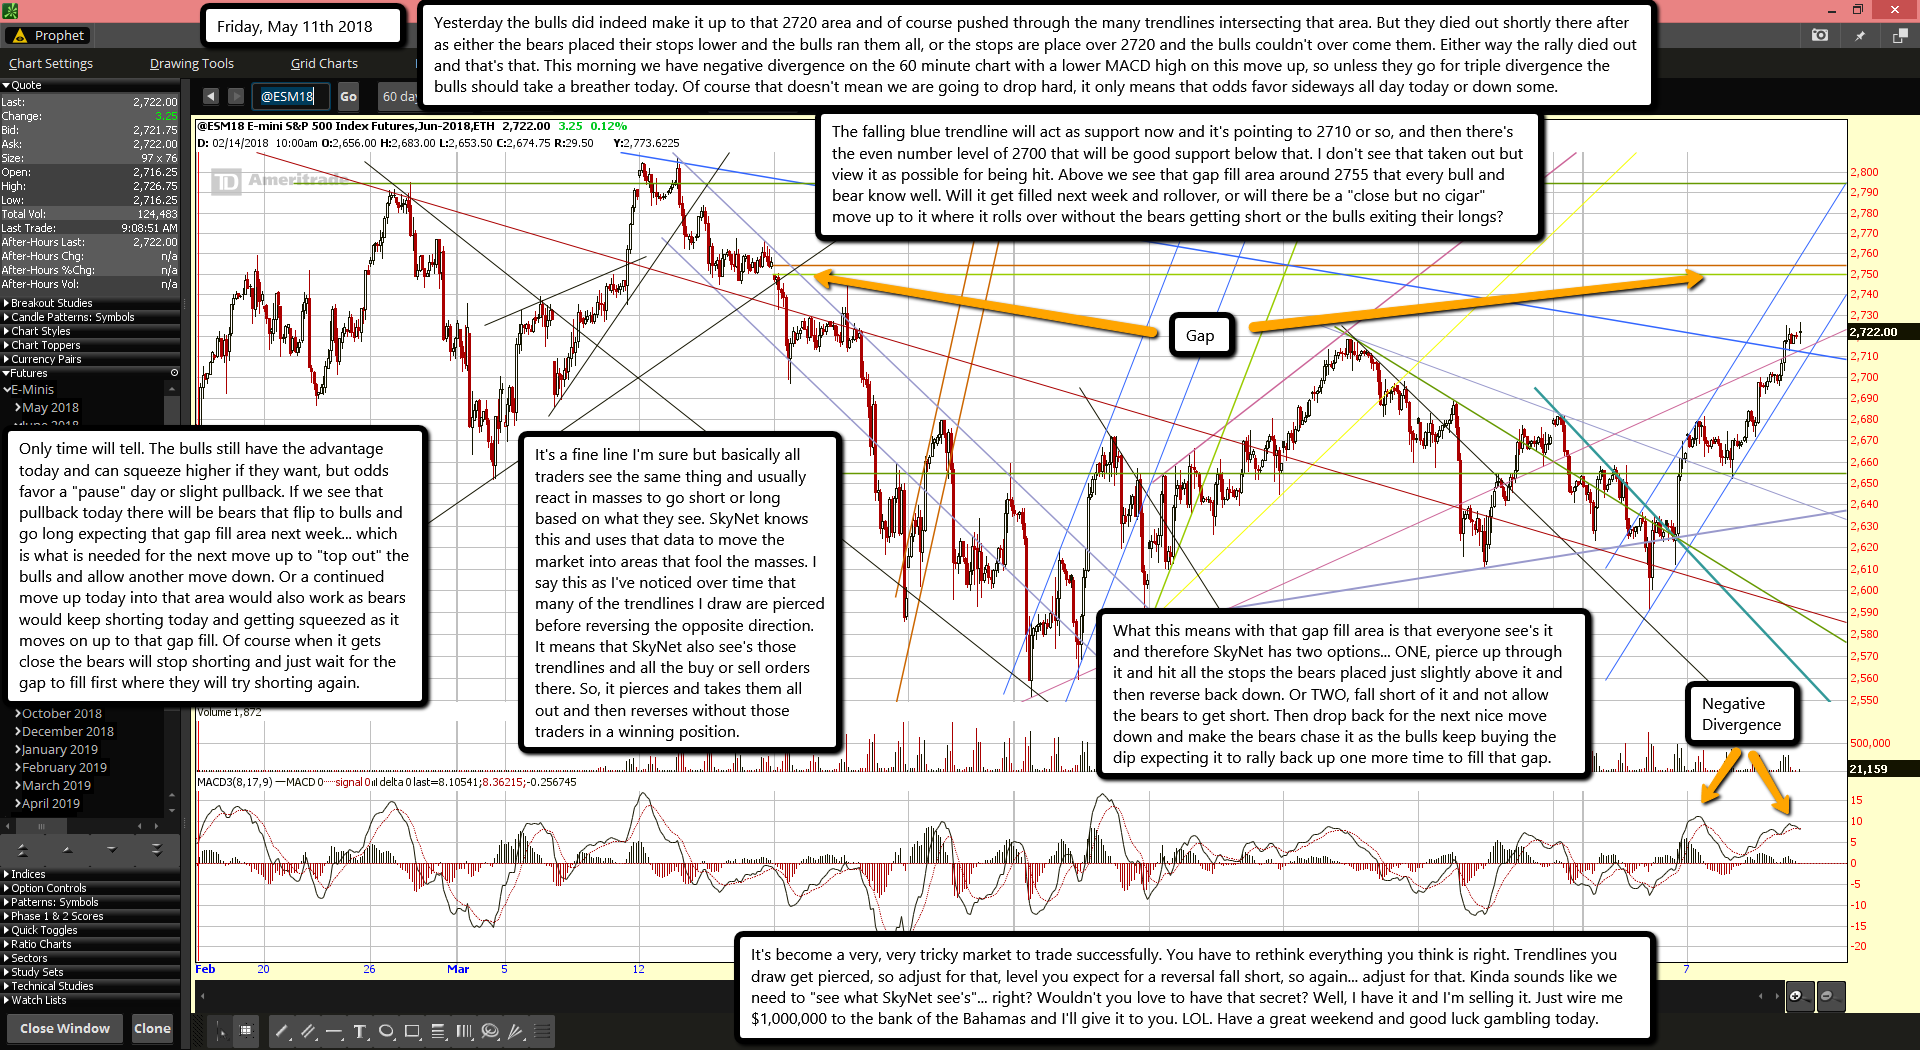
Yesterday the bulls did indeed make it up to that 2720 area and of course pushed through the many trendlines intersecting that area. But they died out shortly there after as either the bears placed their stops lower and the bulls ran them all, or the stops are place over 2720 and the bulls couldn't over come them. Either way the rally died out and that's that. This morning we have negative divergence on the 60 minute chart with a lower MACD high on this move up, so unless they go for triple divergence the bulls should take a breather today. Of course that doesn't mean we are going to drop hard, it only means that odds favor sideways all day today or down some.
The falling blue trendline will act as support now and it's pointing to 2710 or so, and then there's the even number level of 2700 that will be good support below that. I don't see that taken out but view it as possible for being hit. Above we see that gap fill area around 2755 that every bull and bear know well. Will it get filled next week and rollover, or will there be a "close but no cigar" move up to it where it rolls over without the bears getting short or the bulls exiting their longs?
Only time will tell. The bulls still have the advantage today and can squeeze higher if they want, but odds favor a "pause" day or slight pullback. If we see that pullback today there will be bears that flip to bulls and go long expecting that gap fill area next week... which is what is needed for the next move up to "top out" the bulls and allow another move down. Or a continued move up today into that area would also work as bears would keep shorting today and getting squeezed as it moves on up to that gap fill. Of course when it gets close the bears will stop shorting and just wait for the gap to fill first where they will try shorting again.
It's a fine line I'm sure but basically all traders see the same thing and usually react in masses to go short or long based on what they see. SkyNet knows this and uses that data to move the market into areas that fool the masses. I say this as I've noticed over time that many of the trendlines I draw are pierced before reversing the opposite direction. It means that SkyNet also see's those trendlines and all the buy or sell orders there. So, it pierces and takes them all out and then reverses without those traders in a winning position.
What this means with that gap fill area is that everyone see's it and therefore SkyNet has two options... ONE, pierce up through it and hit all the stops the bears placed just slightly above it and then reverse back down. Or TWO, fall short of it and not allow the bears to get short. Then drop back for the next nice move down and make the bears chase it as the bulls keep buying the dip expecting it to rally back up one more time to fill that gap.
It's become a very, very tricky market to trade successfully. You have to rethink everything you think is right. Trendlines you draw get pierced, so adjust for that, level you expect for a reversal fall short, so again... adjust for that. Kinda sounds like we need to "see what SkyNet see's"... right? Wouldn't you love to have that secret? Well, I have it and I'm selling it. Just wire me $1,000,000 to the bank of the Bahamas and I'll give it to you. LOL. Have a great weekend and good luck gambling today.

